9 paid, shareware and free programs for tracking application code
Tracking the must-have code in the development environment. But how much do you need this tool in production? Anyone who only painstakingly collects the logs will say, “Well, what for him, my ELK does not fail me” and will be right in his own way. For the time being.

No, logs, of course, a powerful tool. But looking only in them you will not see uncatchable errors or the values of variables assigned at the moment of the occurrence of the error. Read in this issue:
1. Rollbar
2. Raygun
3. Sentry
4. OverOps
5. Airbrake
6. BugSnag
7. StackHunter
8. VBATelemetry
9. Appenlight
')

Dashboard Rollbar
They write on their site "Catch mistakesif you can while users have not done it for you." Well, let's try. Rollbar provides cloud service and is able to work with several programming languages due to the implantation of its SDK in a controlled application.

Rollbar code implantation
On dashboard groups errors, shows the total amount. Not supercosmic techology, but allows you to see errors from the entire stack of the application. For some reason on the site, they compare themselves with New Relic . I understand that the appointment is similar, but why comparisons for Appdynamics or Dynatrace are not made are a mystery.
Not a lot, but not a little: JavaScript, Angular, Node.js, Python, Ruby, Django, PHP, Clojure, .NET, Android, iOS, Haskell, Drupal, Rails and others.
Standard type set:
- disable or hide certain monitoring objects that you know about;
- determine the degree of severity of each error and receive a notification if the error persists;
- send any event to a team member that needs to be resolved in order to keep the dashboards pristine.
And there is also an interesting feature - the delivery of ready-made parameters for the repetition of a transaction through curl.

Query parameters through curl
Integration:
Free up to 5,000 events per month, up to 100,000 events $ 41, up to 500,000 events $ 124. A complete list of prices can be found on the vendor's website .
Dashboard Pulse
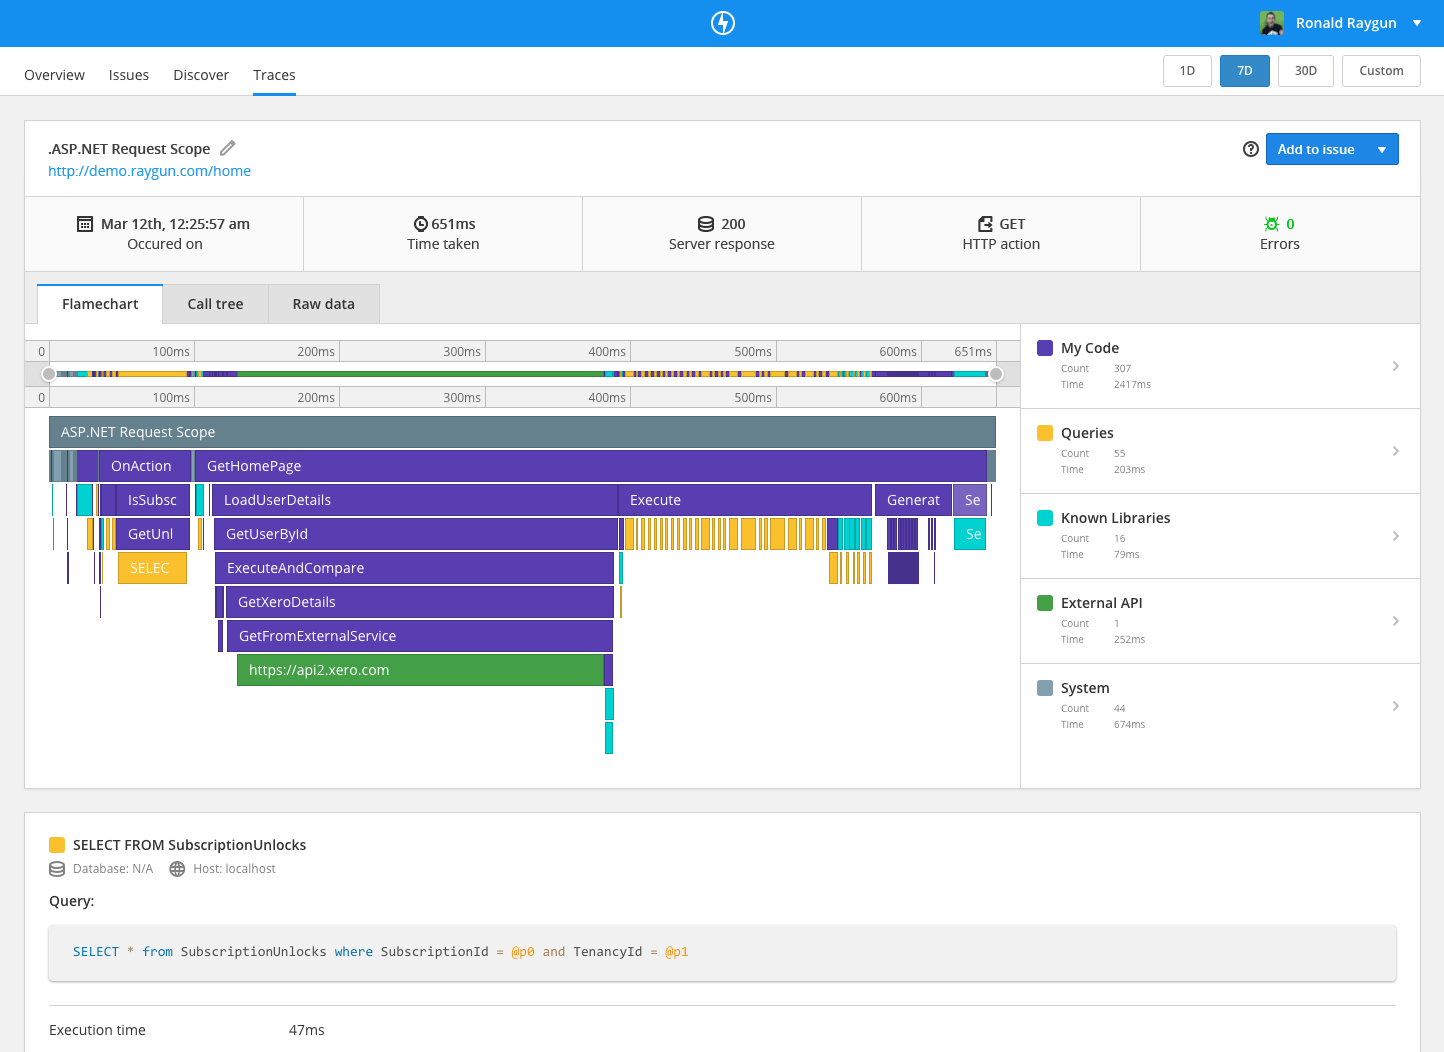
Raygun offers 2 cloud services: Real User Monitoring (aka Pulse) and Crash Reporting. Pulse monitors user sessions and detects performance problems, for each of which you can configure an alert. It has a separate dashboard that informs you about the load time of pages from specific countries, browsers and devices.
Crash Reporting monitors the operation of the application itself and displays diagnostic reports and other related data on the dashboard.
Dashboard Crash Reporting
.NET, Android, Drupal, Go, iOS, JavaScript, Node.js, PHP, Python, Ruby, Unity and others.
Just in case, if you suddenly did not notice the absence of Java in this list (which does not support any bad tone today): in order to trace Java, add the Raygun4Java library to the application. This allows you to send exceptions directly to Raygun dashboards. If anything, the Raygun documentation has a description of how this is done.
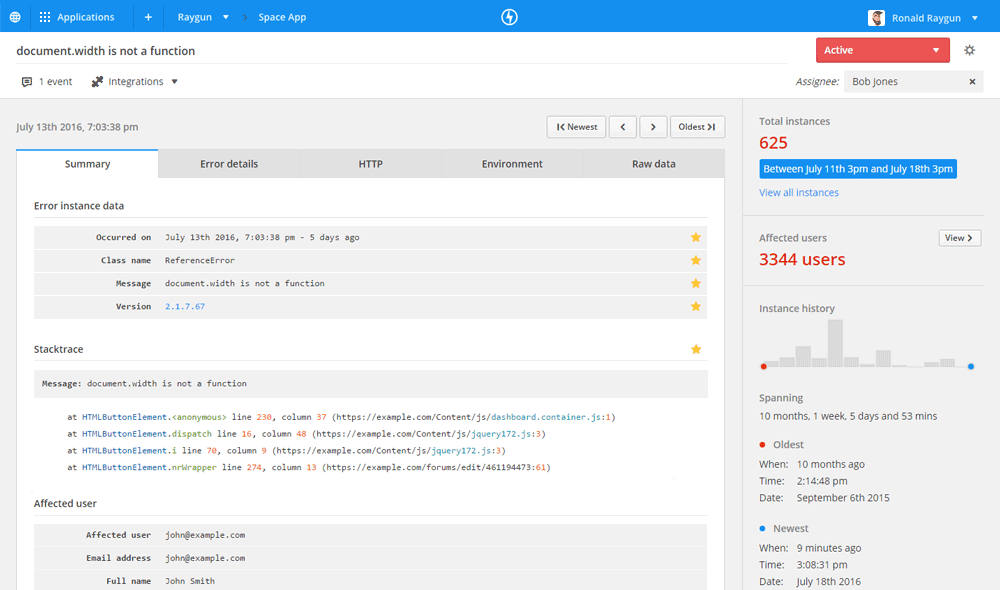
Raygun is able to group multiple errors. On the dashboard, you can tag the error groups or their instances for later reporting.
In each group of errors, team members can see status updates, comments, and other information, and the number of users affected by each error is shown on the dashboard.
There is a full-text search option that helps you quickly find the right error. Well, where to without the support of webhooks and sending notifications to third-party alert systems.
Integration:
Raygun sells Pulse and Crash Reporting as 2 different services, for which you have to pay separately. For unlimited version you can buy both at once.
The price for Pulse starts at $ 99 / month for 100,000 user sessions per month. The next tariff plan is $ 198 / month for 200,000 sessions, and for 500,000 sessions, they ask for $ 495 / month.
The price of Crash Reporting starts at $ 49 / month for 25,000 errors and from a maximum of 5 applications. For $ 149 / month, it is allowed to process 250,000 errors from a maximum of 20 applications, and for $ 499 / month 3,000,000 errors from 50 applications.
Well, there is a superfood enterprise fare for both services, which starts at $ 999 / month for an unlimited number of sessions and events.
I found several articles about this thing on Habré, even Navalny’s headquarters used it for his Reaper . Sentry began as a small piece of code that has become a full-scale error monitoring tool, catching and debugging errors in the sale. You can install it or use the cloud version.
In the dashboard, you can see the trace of the call stack, determine the URL of each error, parameters and information about the session.
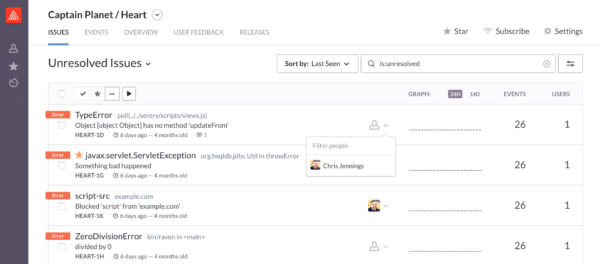
Sentry Dashboard
JavaScript, Node.js, Python, Go, PHP, Ruby, C #, Objective-C, and even Swift.
Raven is a Java client for Sentry, it uses popular logging libraries to collect and convert log files. The library takes this information and sends the data to Sentry.
Errors are captured in real time, each error includes information about the runtime environment and user data. If the user experience is the key source of data for diagnosing errors, Sentry can request feedback from users every time they encounter errors.
Integration:
For use on their facilities - free then. For commercial use in the cloud, the price hovers around $ 26– $ 449 / month for a limit of 1 million events per day. To assess the number of events there is a 14-day trial.
OverOps helps developers understand when, where, and why code breaks. It fixes exceptions and errors, and this is also the only solution (I have not met another one like this), showing the state of the variable that caused it, through methods and machines. If you want to learn about the product a little more - on Habré, I once wrote about him . Of the installation options: on-premise, hybrid (database in analytics in the cloud), SaaS - there are plenty to choose from.
With OverOps, you get an idea of the actual code that was running when the exception or error occurred. An interesting tool for finding, analyzing and correcting errors.
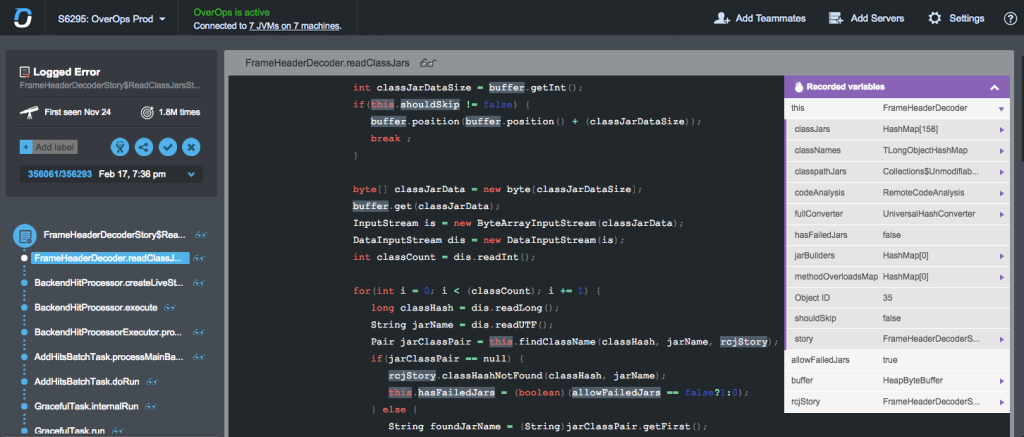
OverOps error analysis screen
OverOps supports all JVM languages: Java, Scala, Clojure, Groovy.
The OverOps agent is installed in just a few commands in the console. It works as a Java agent, so there is no need for changes to the code or assembly, you need to attach this Java agent to your JVM.
For those who prefer to view the logs every time an error occurs, the tool inserts a direct link to the dashboards in OverOps with this particular error in the log. Directly from the log, after clicking on the link, you can see the source code with a trace of the call stack and the values of the variables that caused the error. In conjunction with Splunk or ELK it will be convenient to use it - see the minute vidos on YouTube .
From the dashboard, you can configure alerts based on the error rate, filter errors by application, code location, time, etc.
Integration:
The free version is only in the form of a trial. They did not post prices on the site, if anyone needs it - contact me, I can find out the price.
Airbrake is a tool for collecting and tracking exceptions and errors in an application. Each error includes the environment in which it occurred when it was first discovered, the type of error, and other details. Embedded in the application in the form of SDK. The service works from the cloud.

Dashboard Airbrake
Ruby, PHP, JavaScript, .NET, Python, Django, Node.js, iOS, Swift, Android, Go, Angular, Flask and others.
Airbrake shows the stack trace and metadata for each error, groups them by type, users, and environment variables.
There is a dashboard that shows when each error first occurred, in order to understand whether this error occurred after the release was rolled in or before it. Mistakes can be attached to team members so that it is clear who is responsible for correcting them.
Integration:
They give a 30-day trials, but they ask for data in return. IMHO, for the test fit.
The tool is rated by the number of events. The lowest tariff plan costs $ 59 / month and includes 10,000 errors per month in 5 applications. Over 300,000 errors per month and an unlimited number of applications will be asked for $ 129 / month, and finally, 1 million errors per month and an unlimited number of applications cost $ 299 / month.
Bugsnag keeps track of errors and exceptions within the application and try to determine the root cause and evaluate the impact on the user. Artificial intelligence in action.
Dashboard bugsnag
The toolbar provides an overview of all errors with the ability to filter unresolved. It groups errors that have a similar origin in the code, and helps to visualize and compare various error trends over time with graphs.
Dashboards with an index of performance for each release
Embedded in the application in the form of SDK, works as a service from the cloud. Bugsnag to a Java application can be added using Gradle, Maven or manually. It is also possible to add an SDK using the Spring and Spring boot.
Android, Go, iOS, .NET, Node.js, PHP, Python, Ruby, Unity.
On dashboards, you can hide errors as long as they do not meet the conditions you define or turn off the sound when errors occur, if they are not important. Each error contains data on the number of affected users and how many times this has happened.
The error status menu provides additional information: shows the progress of the errors, the activity feed shows the progress of changes of each error over time.
The free plan supports up to 7500 errors per month for one user. The tariff plan for the team starts at $ 29 / month and comes to $ 59 / month for 150,000 errors per day for 5 team members. To find out the conditions of an unlimited corporate tariff plan, you need to contact them.
Stackhunter can extract data from Log4J and Logback. Each error includes a stack trace, HTTP request, JVM properties, JMX attributes and when and where this happened for the first time. StackHunter keeps track of uncaught exceptions, as well as errors logged in Log4J and Logback. Installed on your server.

StackHunter Dashboard
This is a tool specifically designed to catch Java exceptions. It supports JDK 6 or higher and requires Servlet 2.5 or higher. Installation is simple: you need to deploy instackhunter.war on a web server.
StackHunter tracks exceptions by connecting to Log4J and Logback. The tool offers one web interface where you can view all exceptions.
On the dashboard, you can see all application exceptions, filter out unique exceptions, or see which ones affected users or their sessions. Similar exceptions are grouped together.
There is a 30-day trial period. Prices are asked to request them directly. If you need help with prices - please contact.
Although it is not productive applications, but for personal tasks in the field of macro debugging in MS Excel, it was impossible not to mention this useful piece. Works in conjunction with Azure Insights. Helps to catch macro execution errors and monitor their performance. VBAtelemetry can be used for free, because both Azure itself and Azure have corresponding free tariff plans. To work requires the installation of a small agent.

Insert key in macro code

Macro performance in Azure Insights
Oddly enough, but only VBA.
The capabilities of the tool can be listed in three functions:
TrackPageView. Control over the forms and tables that the user opens.
TrackEvent. The function that determines the data on which events need to be sent to Azure Insights.
TrackError. Function to send code execution errors to Insights.
TrackMetric. Function to monitor performance. Measures the execution time of the code.
Integration:
You can use it for free, but a pop-up window will pop up. You can pay $ 39 for the key and forget about it. If you buy from 20 keys, they give a discount of 50%. The required number of keys depends on how many instances of Azure Application Insights you will use. If one - you need only one key.
Open-source and free. The tool tracks the executable code. Work requires the introduction of a lightweight SDK. The application server itself comes in the form of an OVA image.
Interface appenlight
Python, JavaScript, NodeJS, PHP, Ruby and others. Java is not supported.
The tool tracks the errors in the application, collects the patterns, groups the errors, shows slow calls, identifies the users who have been mapped. Multi-user mode is supported, errors can be assigned to specific users.
Integration:
Totally free.
Each tool has its pros and cons. Fortunately, vendors give a trial and nothing prevents to try this or that tool. Tell us what you use to catch errors: paid / free, your / industrial.
No, logs, of course, a powerful tool. But looking only in them you will not see uncatchable errors or the values of variables assigned at the moment of the occurrence of the error. Read in this issue:
1. Rollbar
2. Raygun
3. Sentry
4. OverOps
5. Airbrake
6. BugSnag
7. StackHunter
8. VBATelemetry
9. Appenlight
')
1. Rollbar
Dashboard Rollbar
They write on their site "Catch mistakes
Rollbar code implantation
On dashboard groups errors, shows the total amount. Not supercosmic techology, but allows you to see errors from the entire stack of the application. For some reason on the site, they compare themselves with New Relic . I understand that the appointment is similar, but why comparisons for Appdynamics or Dynatrace are not made are a mystery.
What programming languages and platforms are supported
Not a lot, but not a little: JavaScript, Angular, Node.js, Python, Ruby, Django, PHP, Clojure, .NET, Android, iOS, Haskell, Drupal, Rails and others.
Opportunities
Standard type set:
- disable or hide certain monitoring objects that you know about;
- determine the degree of severity of each error and receive a notification if the error persists;
- send any event to a team member that needs to be resolved in order to keep the dashboards pristine.
And there is also an interesting feature - the delivery of ready-made parameters for the repetition of a transaction through curl.
Query parameters through curl
Integration:
- Datadog
- Flowdock
- Github
- Help Scout
- Logentries
- Logstash
- Mailgun
- Pagerduty
- Slack
- Trello
- Webhooks
Prices
Free up to 5,000 events per month, up to 100,000 events $ 41, up to 500,000 events $ 124. A complete list of prices can be found on the vendor's website .
2. Raygun
Dashboard Pulse
Raygun offers 2 cloud services: Real User Monitoring (aka Pulse) and Crash Reporting. Pulse monitors user sessions and detects performance problems, for each of which you can configure an alert. It has a separate dashboard that informs you about the load time of pages from specific countries, browsers and devices.
Crash Reporting monitors the operation of the application itself and displays diagnostic reports and other related data on the dashboard.
Dashboard Crash Reporting
What programming languages and platforms are supported
.NET, Android, Drupal, Go, iOS, JavaScript, Node.js, PHP, Python, Ruby, Unity and others.
Just in case, if you suddenly did not notice the absence of Java in this list (which does not support any bad tone today): in order to trace Java, add the Raygun4Java library to the application. This allows you to send exceptions directly to Raygun dashboards. If anything, the Raygun documentation has a description of how this is done.
Opportunities
Raygun is able to group multiple errors. On the dashboard, you can tag the error groups or their instances for later reporting.
In each group of errors, team members can see status updates, comments, and other information, and the number of users affected by each error is shown on the dashboard.
There is a full-text search option that helps you quickly find the right error. Well, where to without the support of webhooks and sending notifications to third-party alert systems.
Integration:
- Asana
- Assembla
- Bitbucket
- Campfire
- HipChat
- Intercom
- Jira
- Pagerduty
- Slack
- Trello
- Webhooks
- Zendesk
Prices
Raygun sells Pulse and Crash Reporting as 2 different services, for which you have to pay separately. For unlimited version you can buy both at once.
The price for Pulse starts at $ 99 / month for 100,000 user sessions per month. The next tariff plan is $ 198 / month for 200,000 sessions, and for 500,000 sessions, they ask for $ 495 / month.
The price of Crash Reporting starts at $ 49 / month for 25,000 errors and from a maximum of 5 applications. For $ 149 / month, it is allowed to process 250,000 errors from a maximum of 20 applications, and for $ 499 / month 3,000,000 errors from 50 applications.
Well, there is a superfood enterprise fare for both services, which starts at $ 999 / month for an unlimited number of sessions and events.
3. Sentry
I found several articles about this thing on Habré, even Navalny’s headquarters used it for his Reaper . Sentry began as a small piece of code that has become a full-scale error monitoring tool, catching and debugging errors in the sale. You can install it or use the cloud version.
In the dashboard, you can see the trace of the call stack, determine the URL of each error, parameters and information about the session.
Sentry Dashboard
What programming languages and platforms are supported
JavaScript, Node.js, Python, Go, PHP, Ruby, C #, Objective-C, and even Swift.
Raven is a Java client for Sentry, it uses popular logging libraries to collect and convert log files. The library takes this information and sends the data to Sentry.
Opportunities
Errors are captured in real time, each error includes information about the runtime environment and user data. If the user experience is the key source of data for diagnosing errors, Sentry can request feedback from users every time they encounter errors.
Integration:
- HipChat
- Github
- Slack
- Trello
- Heroku
- Campfire
- Jira
- Pagerduty
- Gitlab
Prices
For use on their facilities - free then. For commercial use in the cloud, the price hovers around $ 26– $ 449 / month for a limit of 1 million events per day. To assess the number of events there is a 14-day trial.
4. OverOps
OverOps helps developers understand when, where, and why code breaks. It fixes exceptions and errors, and this is also the only solution (I have not met another one like this), showing the state of the variable that caused it, through methods and machines. If you want to learn about the product a little more - on Habré, I once wrote about him . Of the installation options: on-premise, hybrid (database in analytics in the cloud), SaaS - there are plenty to choose from.
With OverOps, you get an idea of the actual code that was running when the exception or error occurred. An interesting tool for finding, analyzing and correcting errors.
OverOps error analysis screen
What programming languages and platforms are supported
OverOps supports all JVM languages: Java, Scala, Clojure, Groovy.
The OverOps agent is installed in just a few commands in the console. It works as a Java agent, so there is no need for changes to the code or assembly, you need to attach this Java agent to your JVM.
Opportunities
For those who prefer to view the logs every time an error occurs, the tool inserts a direct link to the dashboards in OverOps with this particular error in the log. Directly from the log, after clicking on the link, you can see the source code with a trace of the call stack and the values of the variables that caused the error. In conjunction with Splunk or ELK it will be convenient to use it - see the minute vidos on YouTube .
From the dashboard, you can configure alerts based on the error rate, filter errors by application, code location, time, etc.
Integration:
- Jira
- Slack
- HipChat
- Pagerduty
- Graphite
- Grafana
- Nagios
- Zabbix
- New relic
- AppDynamics
- Datodog
Prices
The free version is only in the form of a trial. They did not post prices on the site, if anyone needs it - contact me, I can find out the price.
5. Airbrake
Airbrake is a tool for collecting and tracking exceptions and errors in an application. Each error includes the environment in which it occurred when it was first discovered, the type of error, and other details. Embedded in the application in the form of SDK. The service works from the cloud.
Dashboard Airbrake
What programming languages and platforms are supported
Ruby, PHP, JavaScript, .NET, Python, Django, Node.js, iOS, Swift, Android, Go, Angular, Flask and others.
Opportunities
Airbrake shows the stack trace and metadata for each error, groups them by type, users, and environment variables.
There is a dashboard that shows when each error first occurred, in order to understand whether this error occurred after the release was rolled in or before it. Mistakes can be attached to team members so that it is clear who is responsible for correcting them.
Integration:
- Assembla
- Bitbucket
- Campfire
- Flowdock
- Github
- Gitlab
- HipChat
- Jira
- Lighthouse
- Pivotal tracker
- Slack
- Trello
- Webhooks
- Zapier
Prices
They give a 30-day trials, but they ask for data in return. IMHO, for the test fit.
The tool is rated by the number of events. The lowest tariff plan costs $ 59 / month and includes 10,000 errors per month in 5 applications. Over 300,000 errors per month and an unlimited number of applications will be asked for $ 129 / month, and finally, 1 million errors per month and an unlimited number of applications cost $ 299 / month.
6. Bugsnag
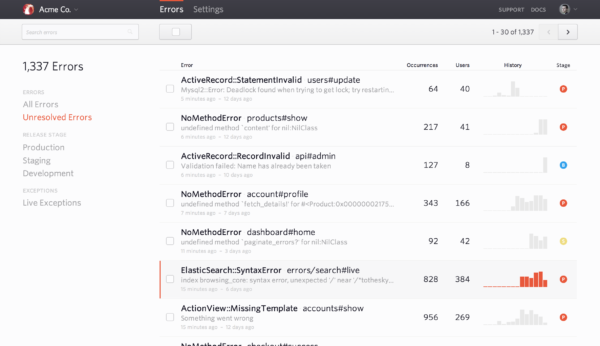
Bugsnag keeps track of errors and exceptions within the application and try to determine the root cause and evaluate the impact on the user. Artificial intelligence in action.
Dashboard bugsnag
The toolbar provides an overview of all errors with the ability to filter unresolved. It groups errors that have a similar origin in the code, and helps to visualize and compare various error trends over time with graphs.
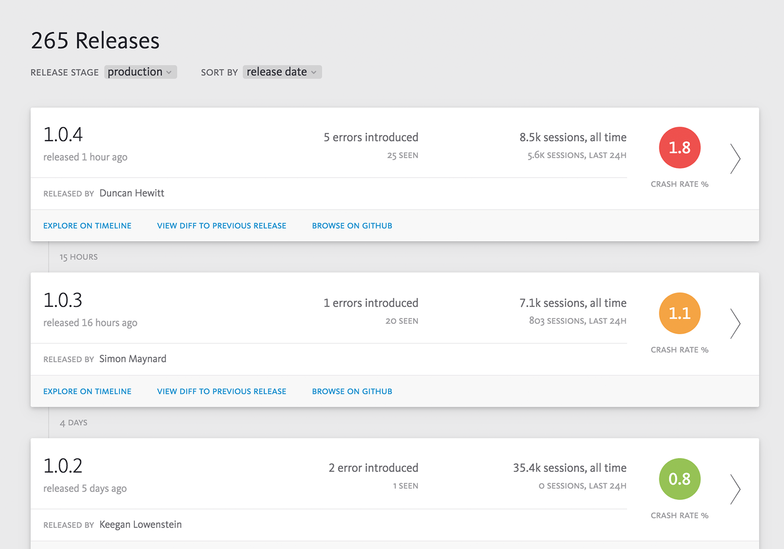
Dashboards with an index of performance for each release
Embedded in the application in the form of SDK, works as a service from the cloud. Bugsnag to a Java application can be added using Gradle, Maven or manually. It is also possible to add an SDK using the Spring and Spring boot.
What programming languages and platforms are supported
Android, Go, iOS, .NET, Node.js, PHP, Python, Ruby, Unity.
Opportunities
On dashboards, you can hide errors as long as they do not meet the conditions you define or turn off the sound when errors occur, if they are not important. Each error contains data on the number of affected users and how many times this has happened.
The error status menu provides additional information: shows the progress of the errors, the activity feed shows the progress of changes of each error over time.
Prices
The free plan supports up to 7500 errors per month for one user. The tariff plan for the team starts at $ 29 / month and comes to $ 59 / month for 150,000 errors per day for 5 team members. To find out the conditions of an unlimited corporate tariff plan, you need to contact them.
7. StackHunter
Stackhunter can extract data from Log4J and Logback. Each error includes a stack trace, HTTP request, JVM properties, JMX attributes and when and where this happened for the first time. StackHunter keeps track of uncaught exceptions, as well as errors logged in Log4J and Logback. Installed on your server.
StackHunter Dashboard
What programming languages and platforms are supported
This is a tool specifically designed to catch Java exceptions. It supports JDK 6 or higher and requires Servlet 2.5 or higher. Installation is simple: you need to deploy instackhunter.war on a web server.
Opportunities
StackHunter tracks exceptions by connecting to Log4J and Logback. The tool offers one web interface where you can view all exceptions.
On the dashboard, you can see all application exceptions, filter out unique exceptions, or see which ones affected users or their sessions. Similar exceptions are grouped together.
Prices
There is a 30-day trial period. Prices are asked to request them directly. If you need help with prices - please contact.
8. VBAtelemetry
Although it is not productive applications, but for personal tasks in the field of macro debugging in MS Excel, it was impossible not to mention this useful piece. Works in conjunction with Azure Insights. Helps to catch macro execution errors and monitor their performance. VBAtelemetry can be used for free, because both Azure itself and Azure have corresponding free tariff plans. To work requires the installation of a small agent.
Insert key in macro code
Macro performance in Azure Insights
What programming languages and platforms are supported
Oddly enough, but only VBA.
Opportunities
The capabilities of the tool can be listed in three functions:
TrackPageView. Control over the forms and tables that the user opens.
TrackEvent. The function that determines the data on which events need to be sent to Azure Insights.
TrackError. Function to send code execution errors to Insights.
TrackMetric. Function to monitor performance. Measures the execution time of the code.
Integration:
- Azure insights
Prices
You can use it for free, but a pop-up window will pop up. You can pay $ 39 for the key and forget about it. If you buy from 20 keys, they give a discount of 50%. The required number of keys depends on how many instances of Azure Application Insights you will use. If one - you need only one key.
9. Appenlight
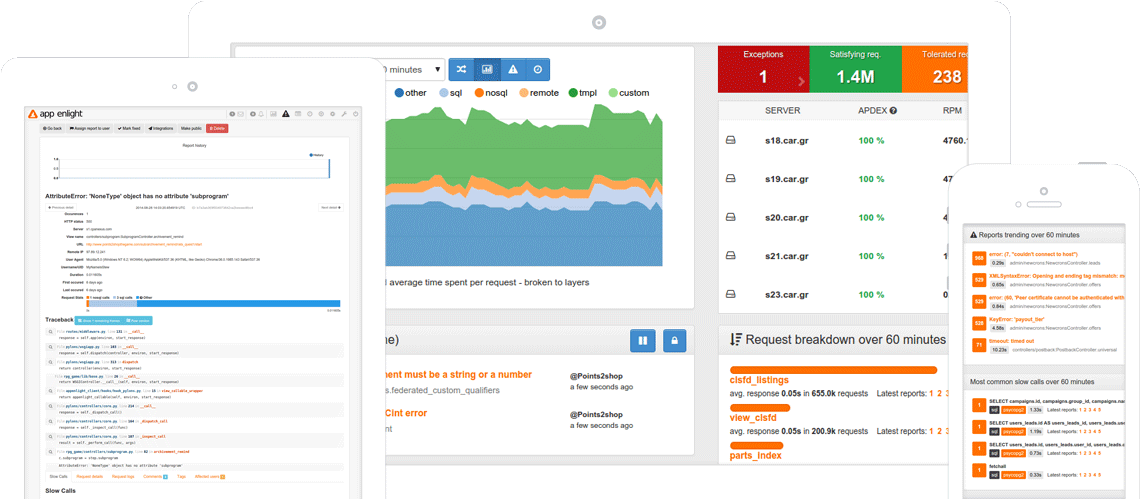
Open-source and free. The tool tracks the executable code. Work requires the introduction of a lightweight SDK. The application server itself comes in the form of an OVA image.
Interface appenlight
What programming languages and platforms are supported
Python, JavaScript, NodeJS, PHP, Ruby and others. Java is not supported.
Opportunities
The tool tracks the errors in the application, collects the patterns, groups the errors, shows slow calls, identifies the users who have been mapped. Multi-user mode is supported, errors can be assigned to specific users.
Integration:
- Bitbucket
- Github
- Jira
- Slack
- HipChat
- Campfire
- Flowdock
- Webhooks
Prices
Totally free.
Each tool has its pros and cons. Fortunately, vendors give a trial and nothing prevents to try this or that tool. Tell us what you use to catch errors: paid / free, your / industrial.
Source: https://habr.com/ru/post/352680/
All Articles