The Metrix has you ...
For many developers, the process of releasing their product is like throwing a blind kitten into the mouth of wild dogs. After this, the main task of the authors is to fight off the bugs that have accidentally reached them. In fact, the application does not end its life journey in the teeth of users, but only starts it. And he needs the help of developers no less than during the formation and testing.
In this article, we will look at how to observe the work of the product and its combat environment, learn how to collect vital metrics and present them in a digestible form. We learn what Time Series is and how they can help our and third-party applications in the diagnostic process. We will get acquainted in detail with the market leaders for monitoring tools, the specialized InfluxDB repository and the Grafana data visualization system.
The prototype of the article is the report of Anatoly Kulakov on DotNext 2017 Moscow. Anatoly was educated as an information security specialist, then earned as a harsh C ++ developer for Linux. When I got tired of coding and wanted to create, I switched to C #. Writes to .NET from its first versions. Engaged in the design and construction of business applications, distributed and fault-tolerant systems. Resting with ES, CQRS and DDD.
Before viewing, you can download slides in PDF format.
Caution traffic! In this post there is a huge number of pictures - slides and screenshots from a video in 720p format. On the slides there is an important code for understanding the article.
Let's talk about metrics. Why precisely about them? The fact is that in my practice I came across a lot of projects, and I was always outraged by the situation that most of the teams do not even think about what is happening in their production now. They just released a product, and, in their opinion, it flies. In reality, this is not at all the case; the server can be choked by the influx of users, disks can fail, anything can happen. And, in most cases, nobody suspects and does not know about it.
Unfortunately, this is how our culture of developers has developed, which for us the main point is the process of writing code. But this is just a small part of the living product, so this trend is changing with time, and I am very pleased. We already know such terrible abusive words like CI and DI; they no longer cause a shiver in the knees. We are used to the fact that version control systems, task management, the planning and testing process are an integral part of a modern project.
The next big step in this direction is going beyond the perimeter of your cozy team and applying good on the territory of the direct user. And this is a very interesting process, because almost always users do not behave with our programs as we had planned, and usually our programs are not prepared for the insanity of ideas that these geniuses of thought are capable of. Therefore, after we began to observe the real use of our products, we definitely discovered a large, interesting and fascinating world full of madness and unpredictability. It turned out that all our optimizations were not used due to random nonsense, the main load falls on the service we were counting on, malicious administrators artificially limit resources for our application, load balancer distributes requests unevenly, etc. A huge number of unpredictable situations gives us life.
Most of them are deposited in the hot psyche of tired users. The rest are recorded in vague bugs describing the result, which makes it completely impossible to understand the reasons for what happened. It is much better from all sides to have constant monitoring of important services in real time and understand what they are doing now.
Monitoring can not only tell you about the problems and pressures, it is also an excellent platform for analytics and predictions. This is what we are going to do. We will understand how and by what means you can realize absolutely any of your voyeuristic fantasies.
I am sure that when I described the essence of the problem, many thought about logging. Indeed, you can remotely collect logs, analyze them and draw conclusions, but what is there going on in this production of yours? And it is not far from the truth. In fact, these are related tools that solve similar problems. If you are interested in listening to the introduction on the correct modern logging, I recommend paying attention to the " Structured logging " report.
But in this article we will focus on metrics. What is the difference between metrics and logging? So, the main content of the logs is any information about the world, business process, expectations and errors. If you know how to prepare them correctly, then you can easily make analytics on their content. But there is a huge reservoir of tasks in which the flexibility and power of logging are redundant, and even more - they are harmful.

For example, you want to constantly monitor the CPU usage. Of course, you can write this information every second to the logs, and then analyze it. But here we are faced with a number of problems, the main of which is the amount of data and the speed of their processing. The number of counters for which we want to observe easily begins with dozens (processor, memory, GC, requests, responses). And in large projects effortlessly reaches hundreds.
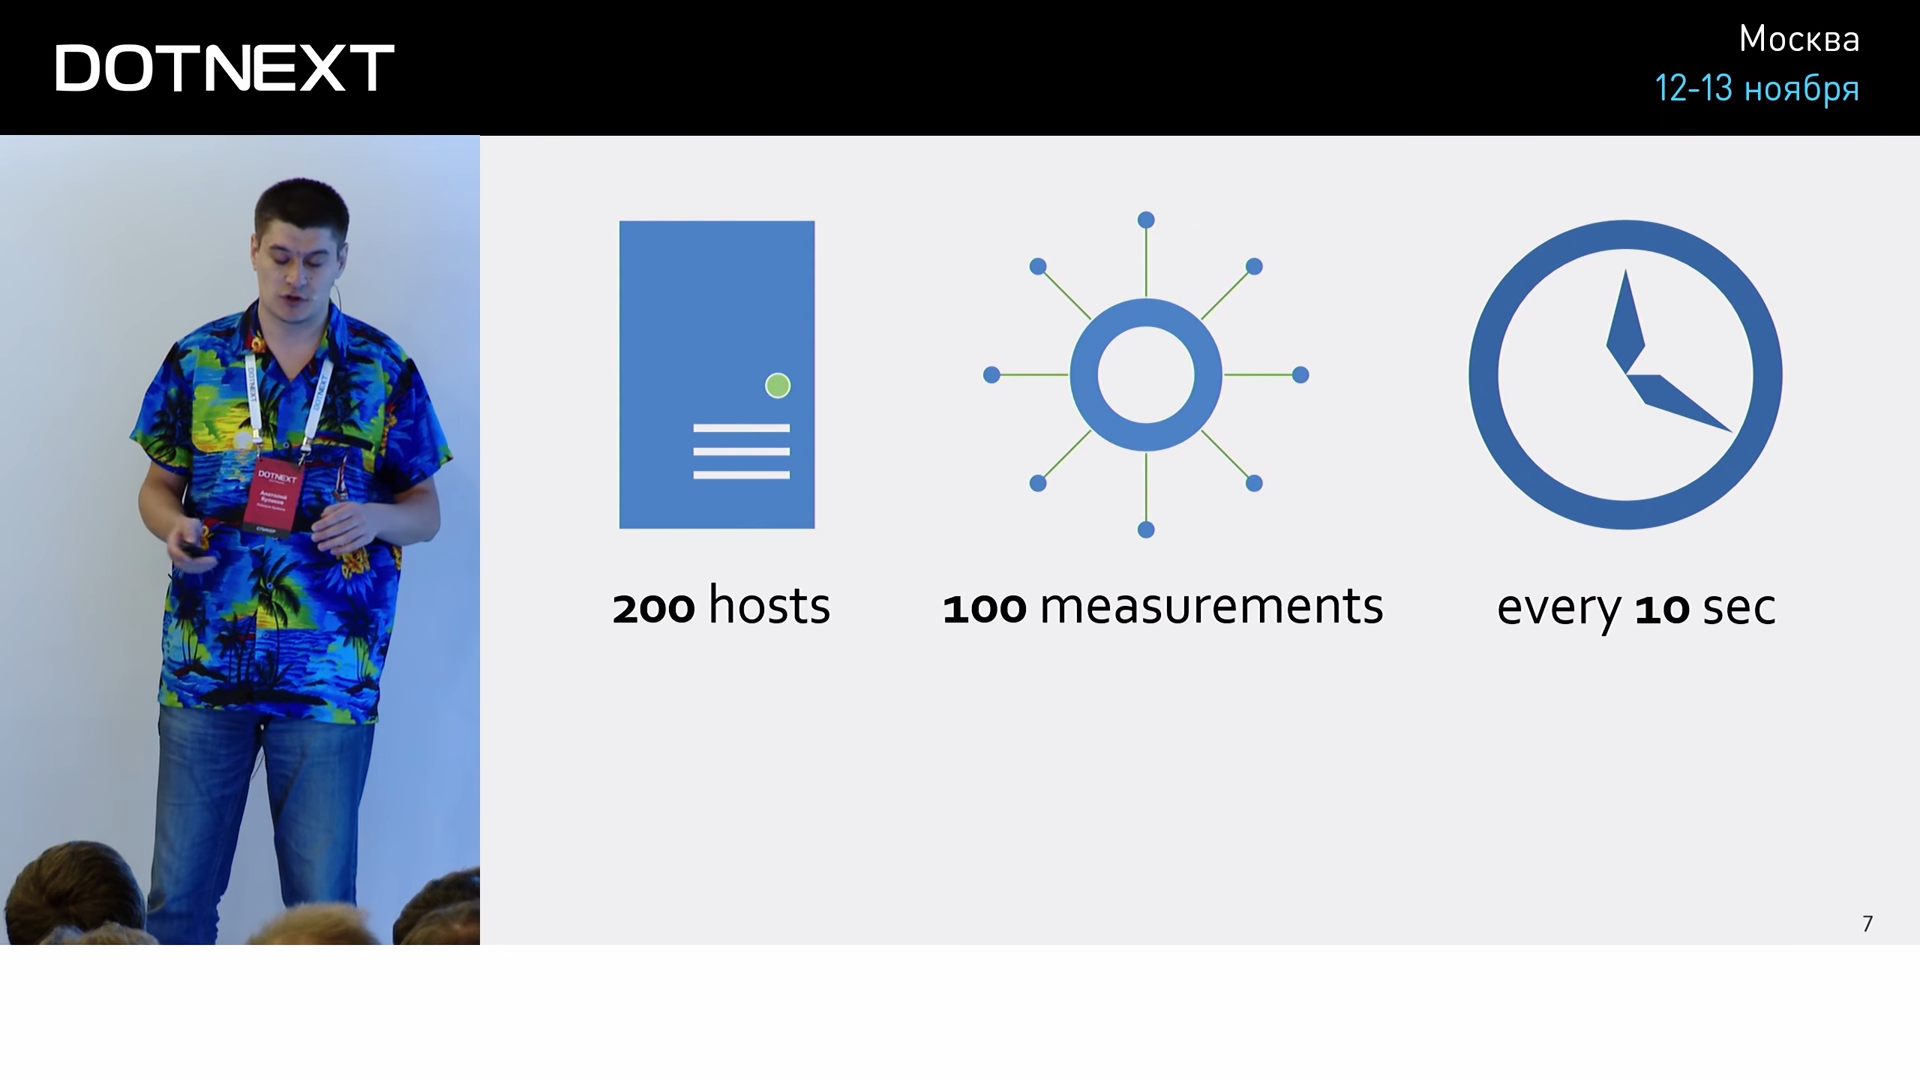
Imagine that you have two hundred hosts, and they take a hundred metrics every ten seconds. Provided that we have 86,400 seconds per day, we will receive 172,800,000 values in our logs daily.
Just imagine what your logs will turn into if every second you merge thousands of metrics into them with low-level, faceless, uninteresting information. Firstly, human readability and consistency of narration, rather than a mountain of infrastructural noise, are expected from the logs. But this problem is easily solved with the help of semantic filters. But the amount of information that is now obliged to process tools created for other purposes is already a problem. Performance problems will be at all levels: in processing, transfer, storage, analytics. And this is pure ordinariness, there are a lot of other areas with disproportionately large appetites, such as nuclear power plants, factories, or, for example, the Internet of things, where, according to bearded analysts, by 2020 there will be six devices for each person, which will need to be constantly monitored.

And if we are talking about absolute volume, then the size of the data necessary for working with metrics is much higher than the size of regular logs. All this suggests that it is impossible to use the same solutions for logs and metrics. Therefore, humanity has isolated from the logs such a thing as metrics. And it divided the work with this data into two independent parts, with its own tools, algorithms and approaches. And, as the trend of the last 2 years shows, the decision was absolutely correct.
If you have ever heard of the growing popularity of graph or document-oriented databases, all this is childish babbling compared to the hyip that occurs around databases for metrics. Metrics are described by time series (Time Series). A time series is a sequence of some values taken from one source at a certain time interval. Those. these are the results of periodic measurements of something in time. For example, this graph represents the results of periodic measurements of the popularity of databases, grouped by storage model:
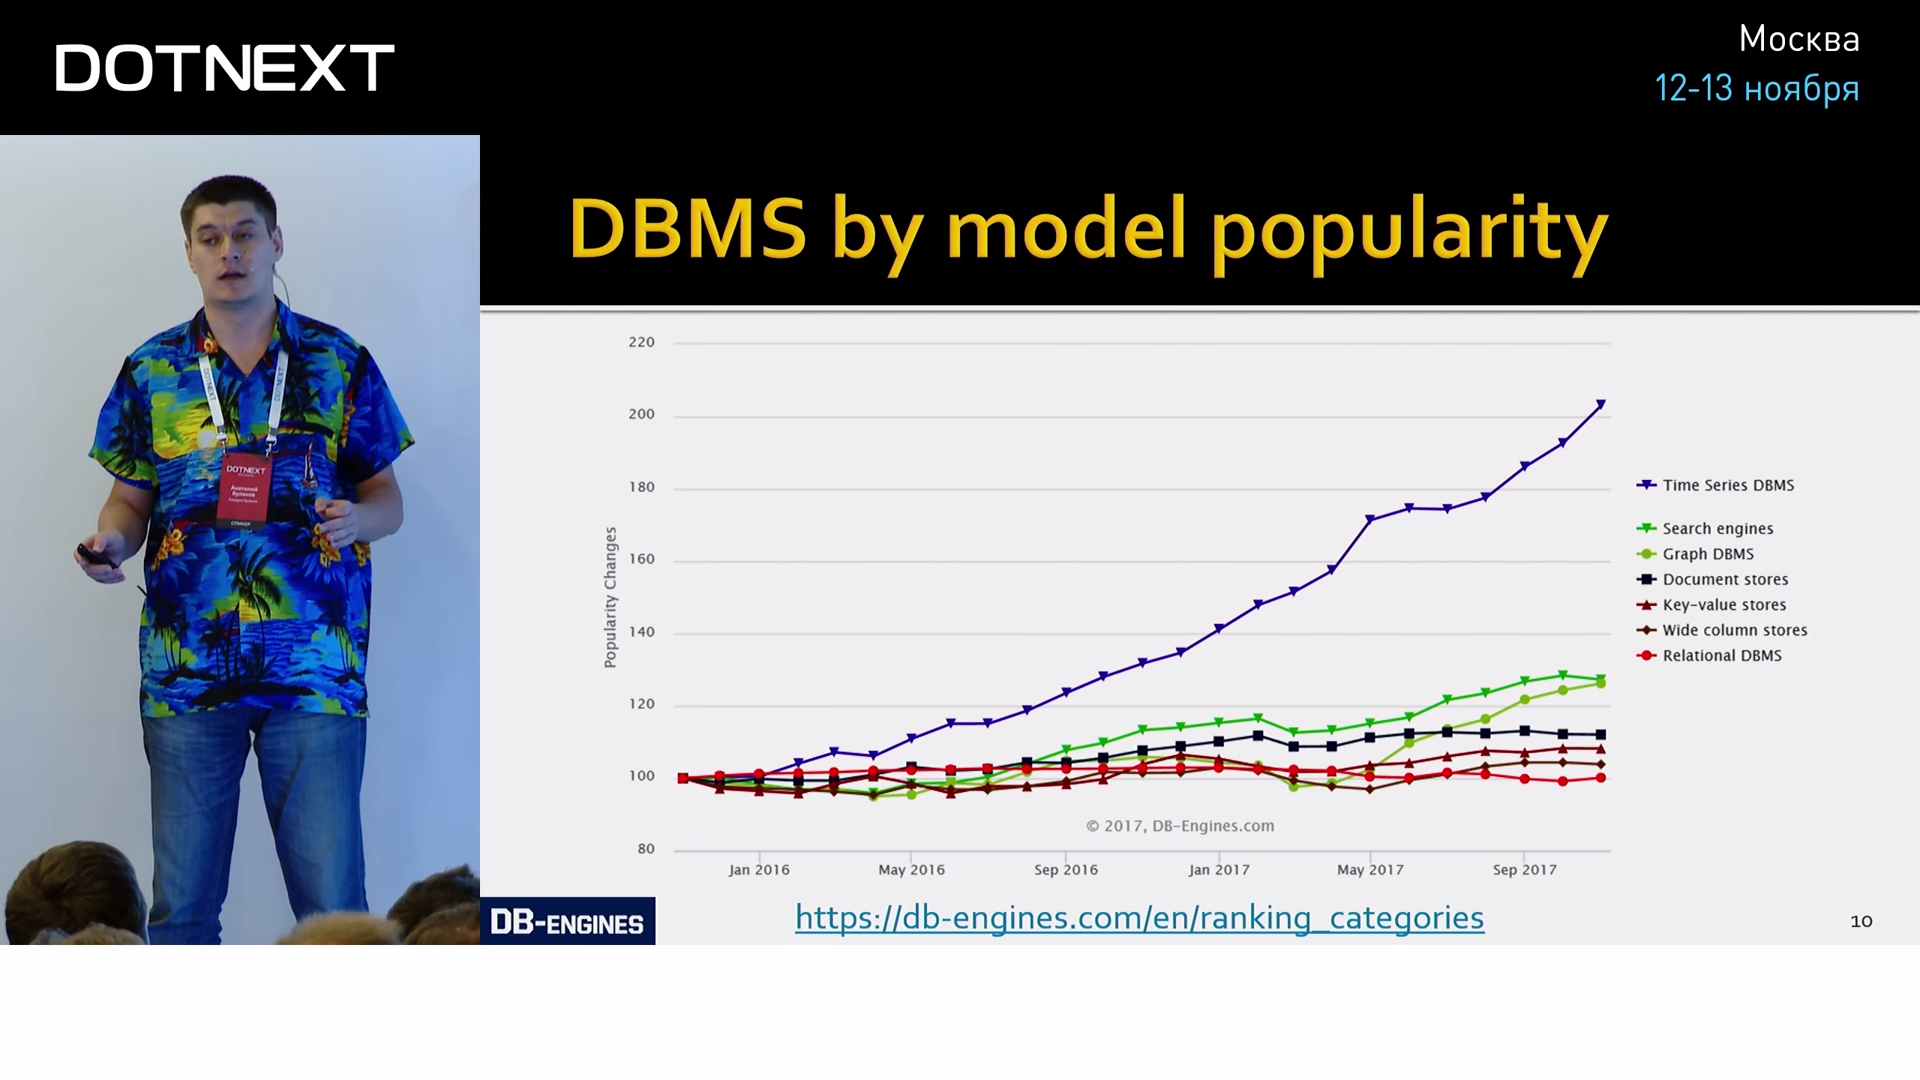
A typical indicator that this graph relates to the Time Series is the presence of a time axis. If it is, then almost always the schedule is TS. To confirm, let's look at other examples:
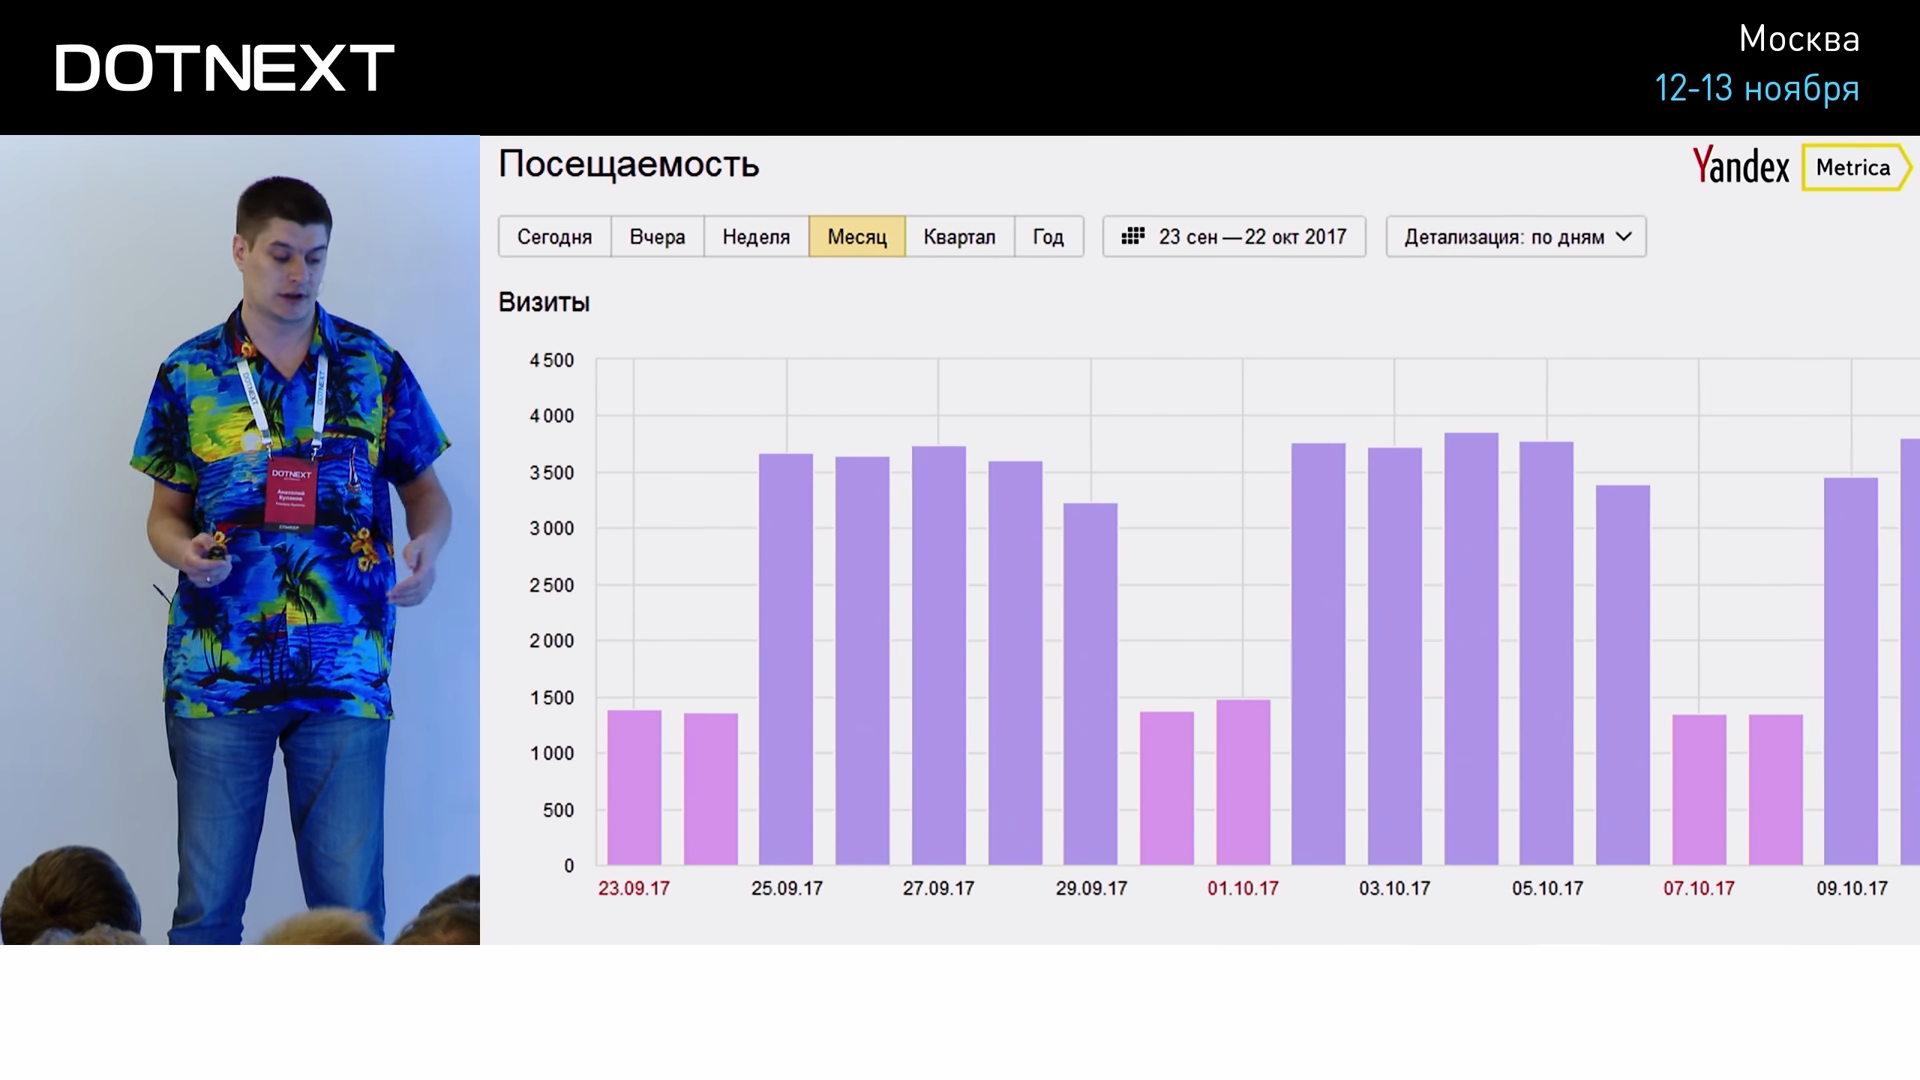
Another typical example is Yandex.Metrica, which shows your site traffic.
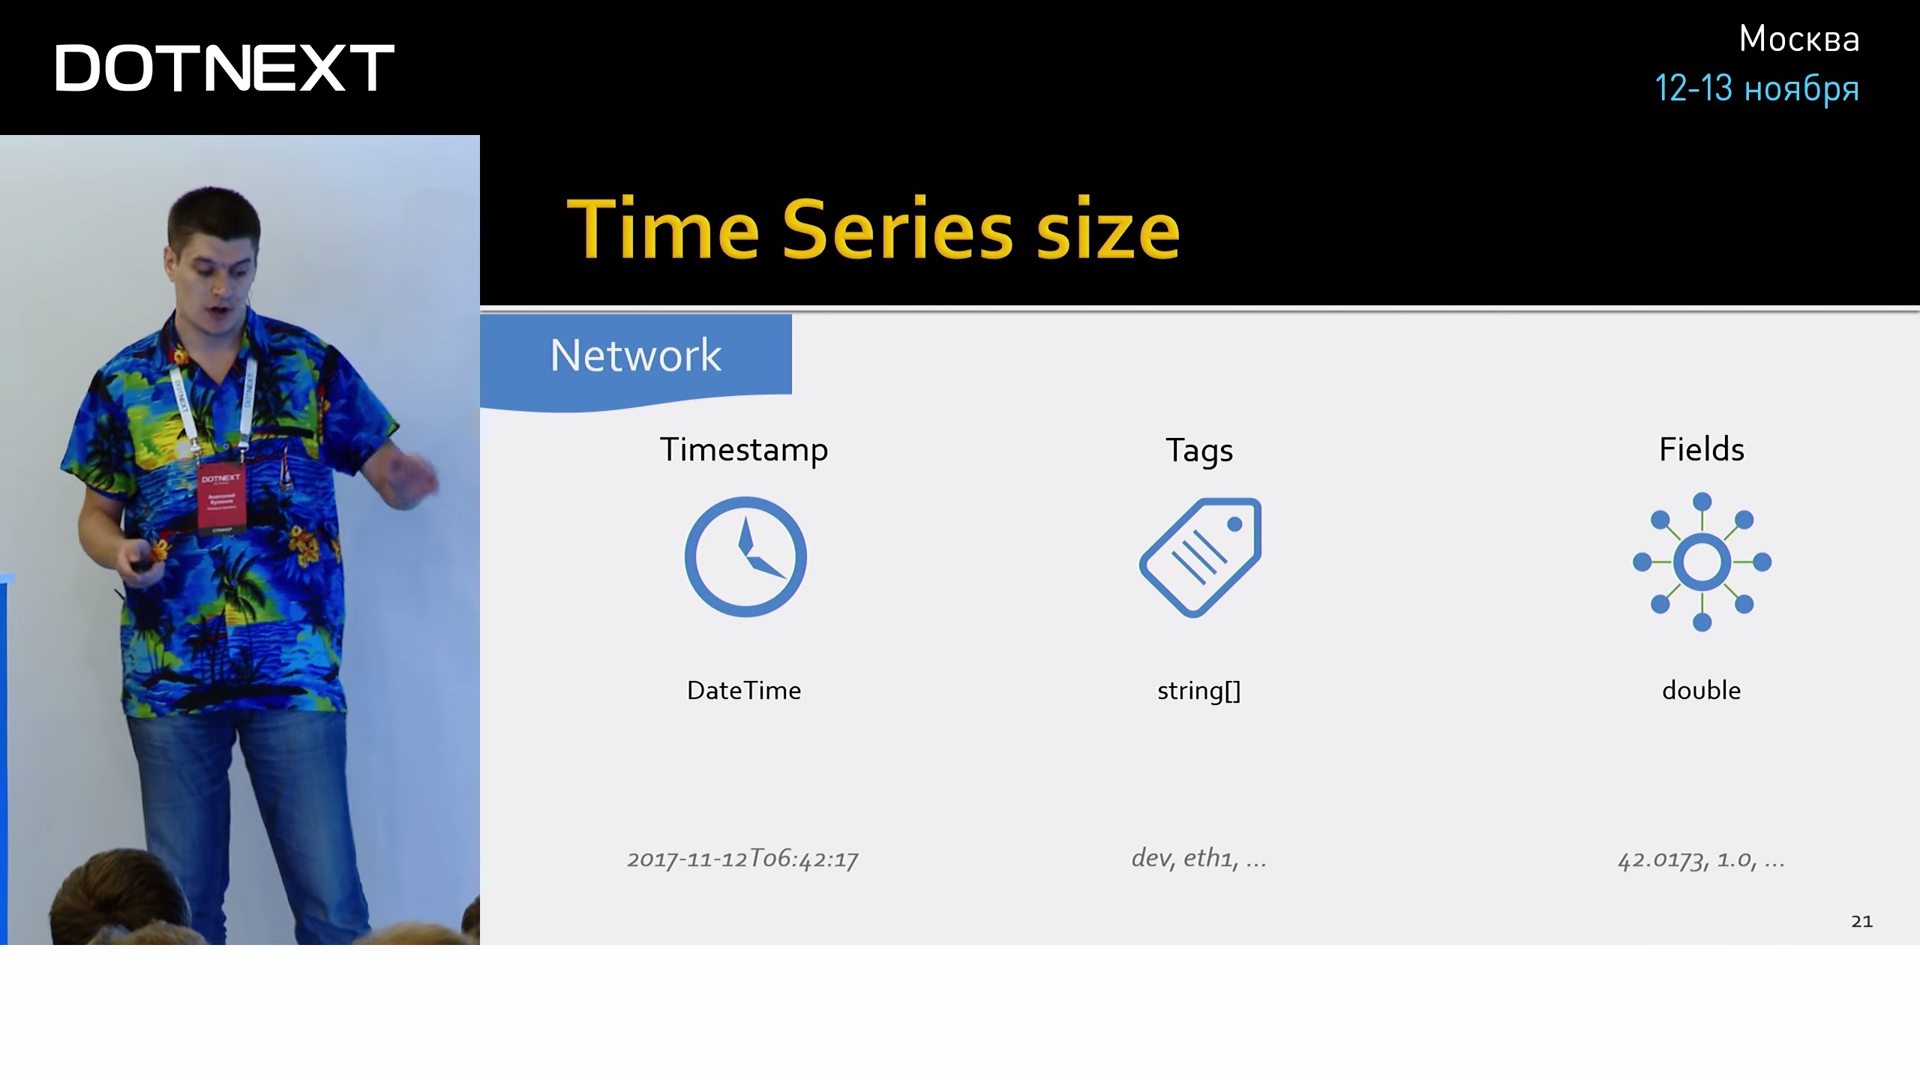
Let's take a closer look at what time series consist of using the example of a network interface:

- First of all, it is, of course, the time at which values are read.
- The values themselves. There may be several values, in this case, the number of incoming / outgoing packets.
- It is also very useful to add meta-information to your meaning, describing the context in which the action took place. For this there are tags. You can assign anything to them, for example, the name of the host or the network interface on which we did the measurement.
If we draw an analogy with relational databases, then the totality of all these three parameters can be represented in the form of the “Network” table.

In this case, time will always be its main key, clustered index. Tags will be indexed columns, aggregates are very well built on them and filters are made. The values themselves are non-indexed columns.
But, unlike public databases, TSDBs have unique information — they know about the nature of this data, which allows them to do incredible optimizations. That is why public databases will always be far, far behind. For example, between the authors of Time Series bases there is an interesting metric, with the help of which they are measured against each other in the size of their own superiority: the average size necessary to store one record. Let's estimate right away:
Date and time are usually stored in nanoseconds, occupy eight bytes. Tags can easily pass over 20 bytes, and a data field, say double (the most common type for values that are stored in TSDB), takes eight bytes. Well, if you store it so ingenuously, then one record will occupy about 40 bytes. What do you think, what figures do the leaders brag about? Two bytes.

Only two bytes to pack all our values. And this is not the limit, the best fight in the region of one byte. How is this even possible? How, knowing the specifics of the origin of the data, can you put all this in two bytes?
The first thing that comes to mind is the use of standard compression algorithms. This is usually a bad idea, because they were created for completely different amounts of information, and they require much more context for their work than we can afford. Well, they work 30-40 times slower.
We will go another way. Let's start with the tags. Their size in a constant data stream can be reduced to zero. How is this done? We simply multiply the name of the metric with all the keys and values of the tags and get several storage slots (in example two):

Thus, we transfer tags from the data area to the schema area. That is why tag values should not be represented by random numbers, but should fit into the final dictionary. This part of the time series is called the “Series”. The series itself does not store any data, it is constant in time, which allows you to simply neglect its size. In this way, our tags collapse to zero.
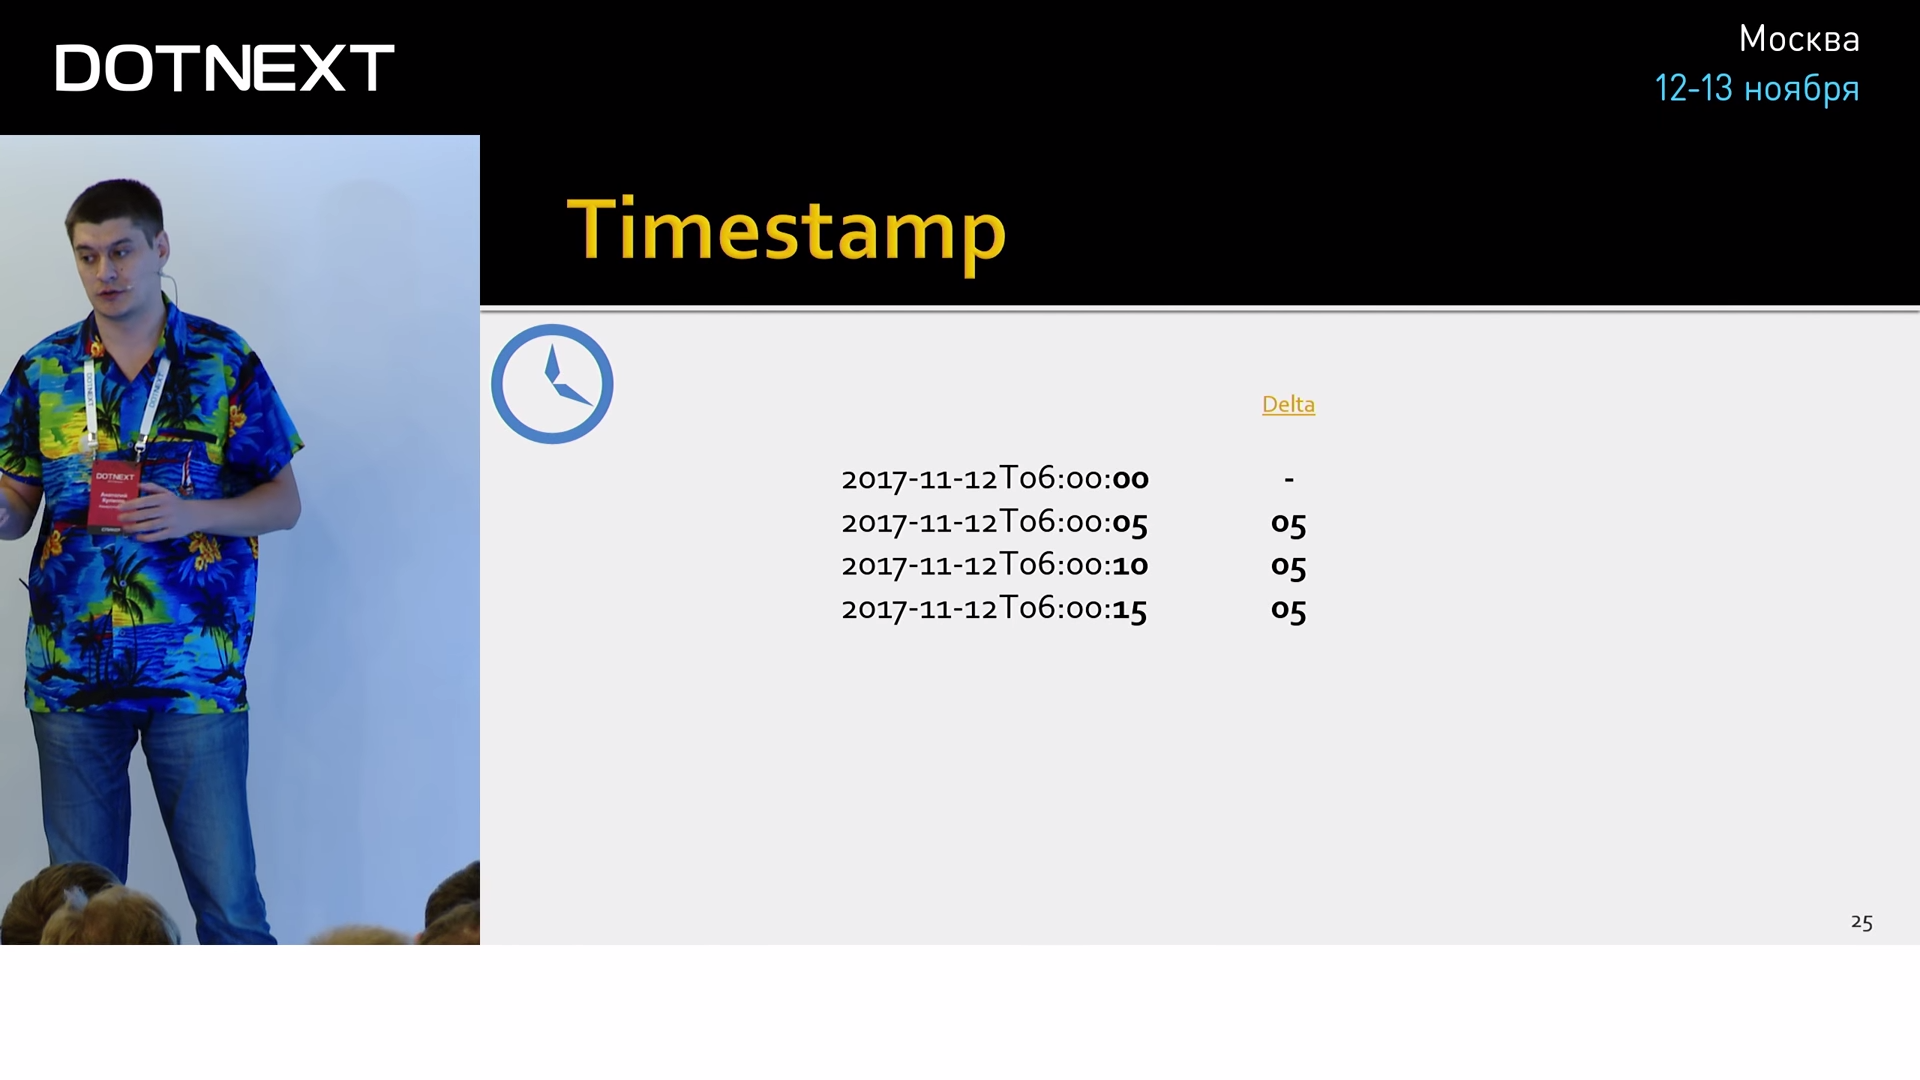
If the series does not take place, then it is occupied by a timestamp and value. Let's start with the time. All compression algorithms that work on Time Series are based on the same principle as column databases. They work with one column, with a continuous stream of the same type data. Time is usually stored with nanoseconds accuracy. In 8 bytes. Delta-of-delta compression can be used to compress a column over time. This is an algorithm that relies on the fact that the data from the counters are usually removed periodically at regular intervals. For example, every 5 seconds. We can calculate the delta between these times and find the interval. Having a start time and interval, we can predict the next value in the column.
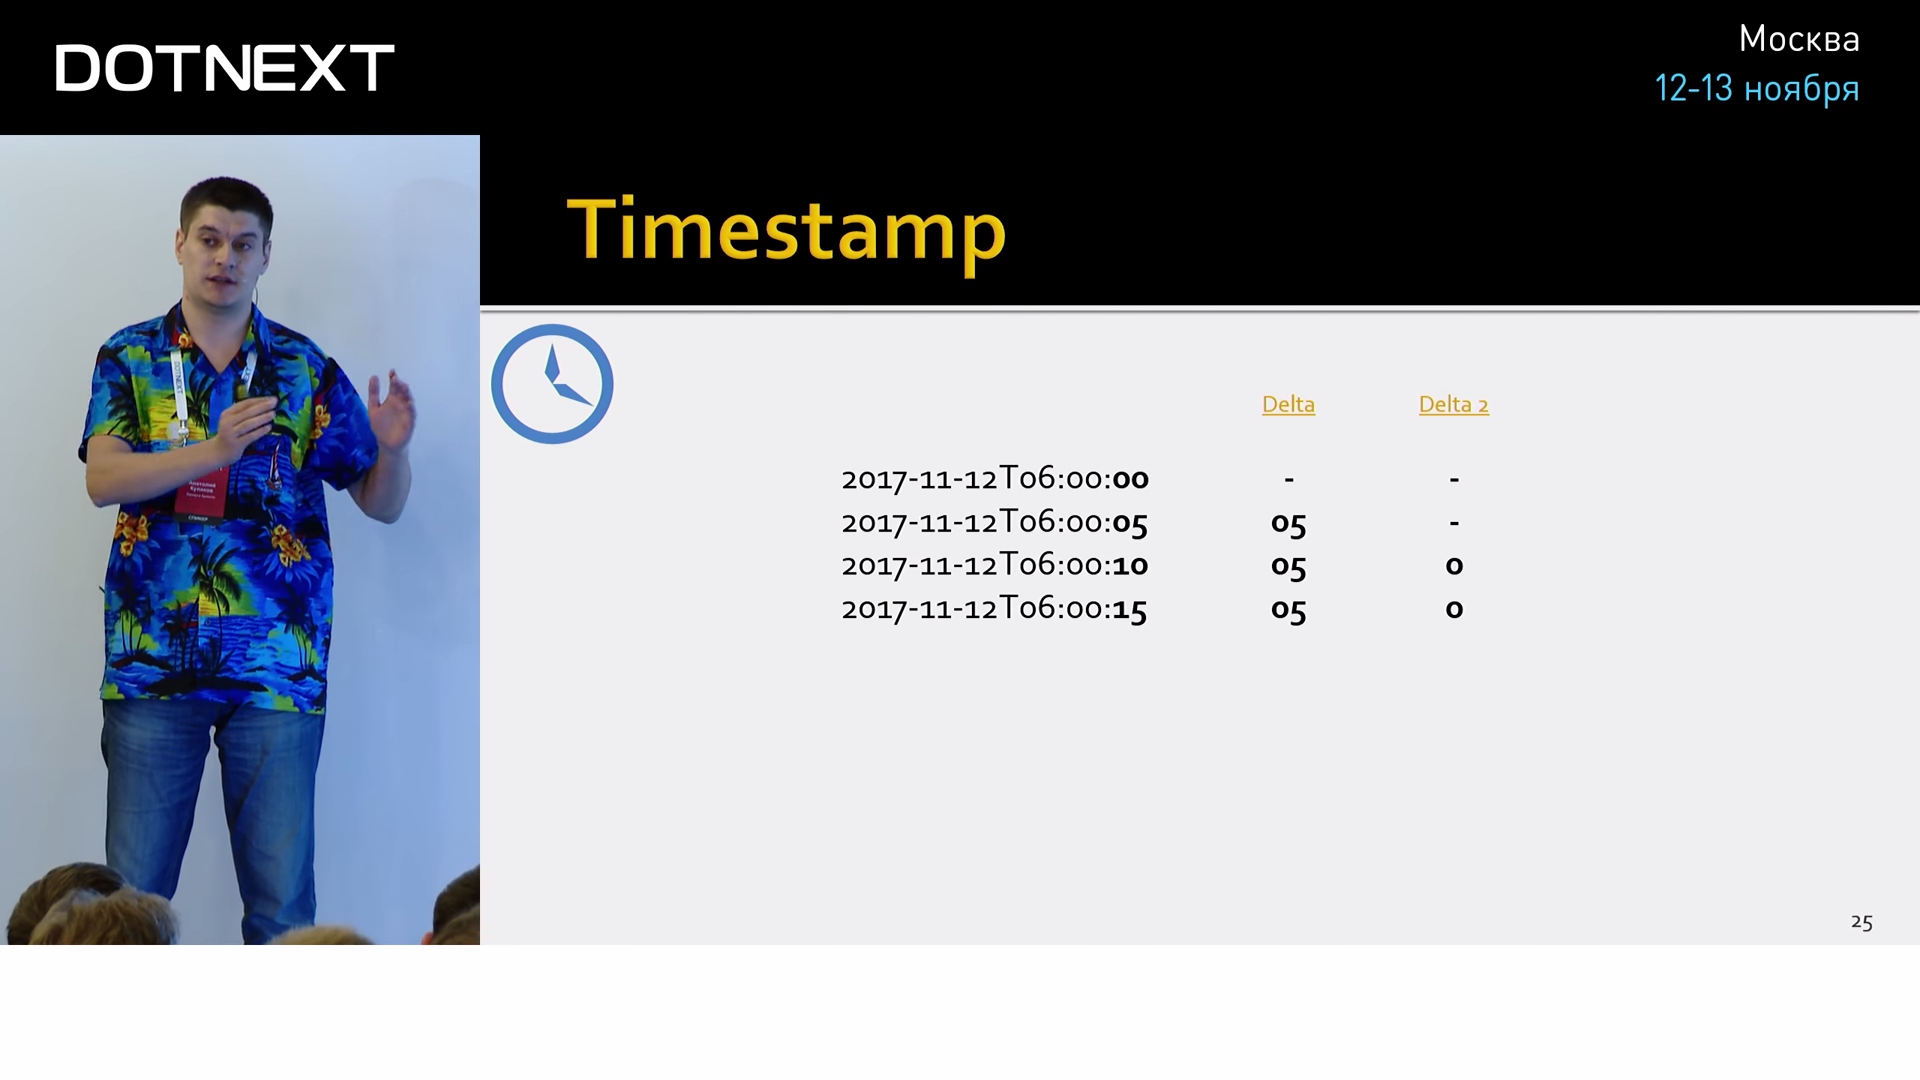
Usually the interval does not change, so we can calculate once again the delta above the value of the first delta. And usually it turns out zero. For storing such a special, frequently occurring value, one bit is enough (we have zero in the second delta or not zero).
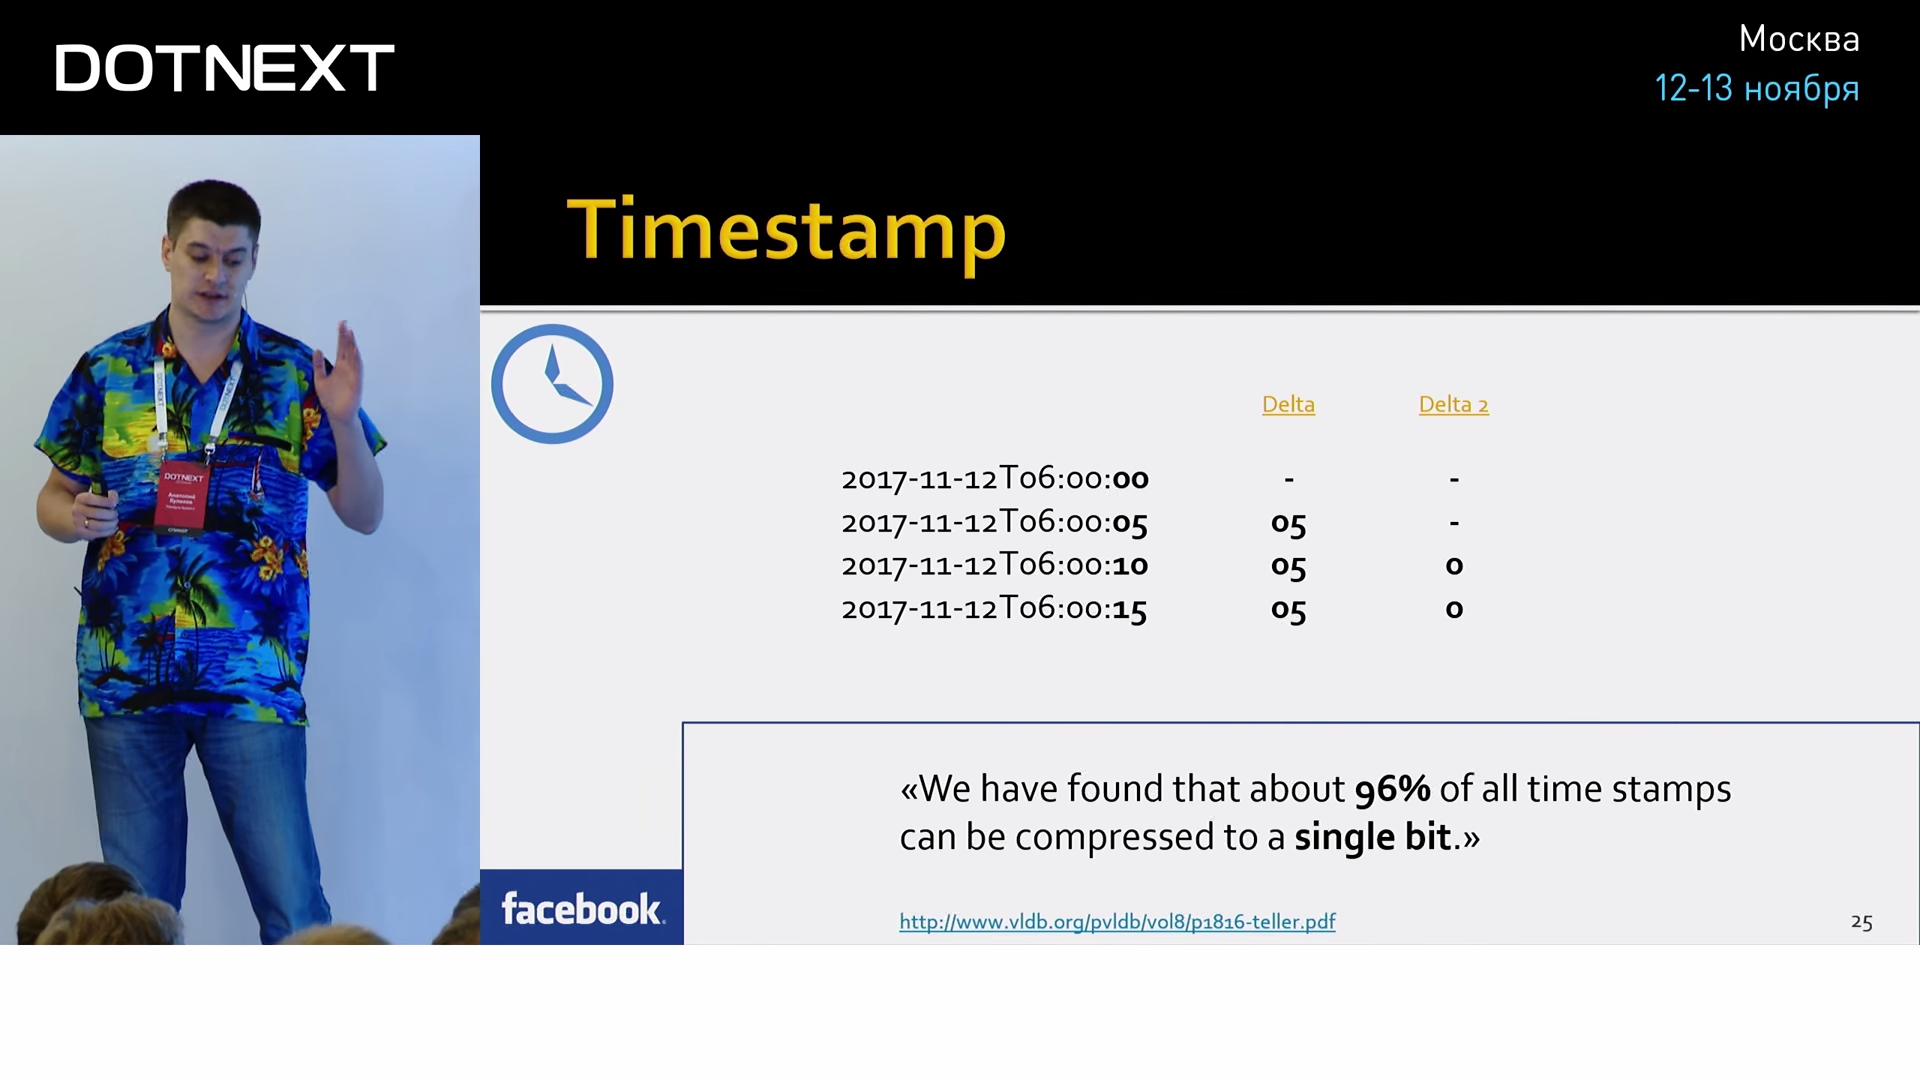
Do not think that these are too big assumptions and in the real world there is no such thing. According to Facebook, they were able to pack 96% of their time in this one zero bit. Naturally, there are algorithms for eliminating small rattling of time, passes, etc.
The values of the counters can be of any type. But in practice, these are almost always floating point numbers. It is on them that the main magic is aimed at reducing the size of the fields.
Values can be scattered unpredictably, so the previous trick with a double delta will not work here. Another technique is based on the knowledge that all values come from the same source, and therefore have the same accuracy and similar dimension. In practice, this means that their binary representation will be very similar. Those. if we trivialize the neighboring values, we get a very small number of significant characters:
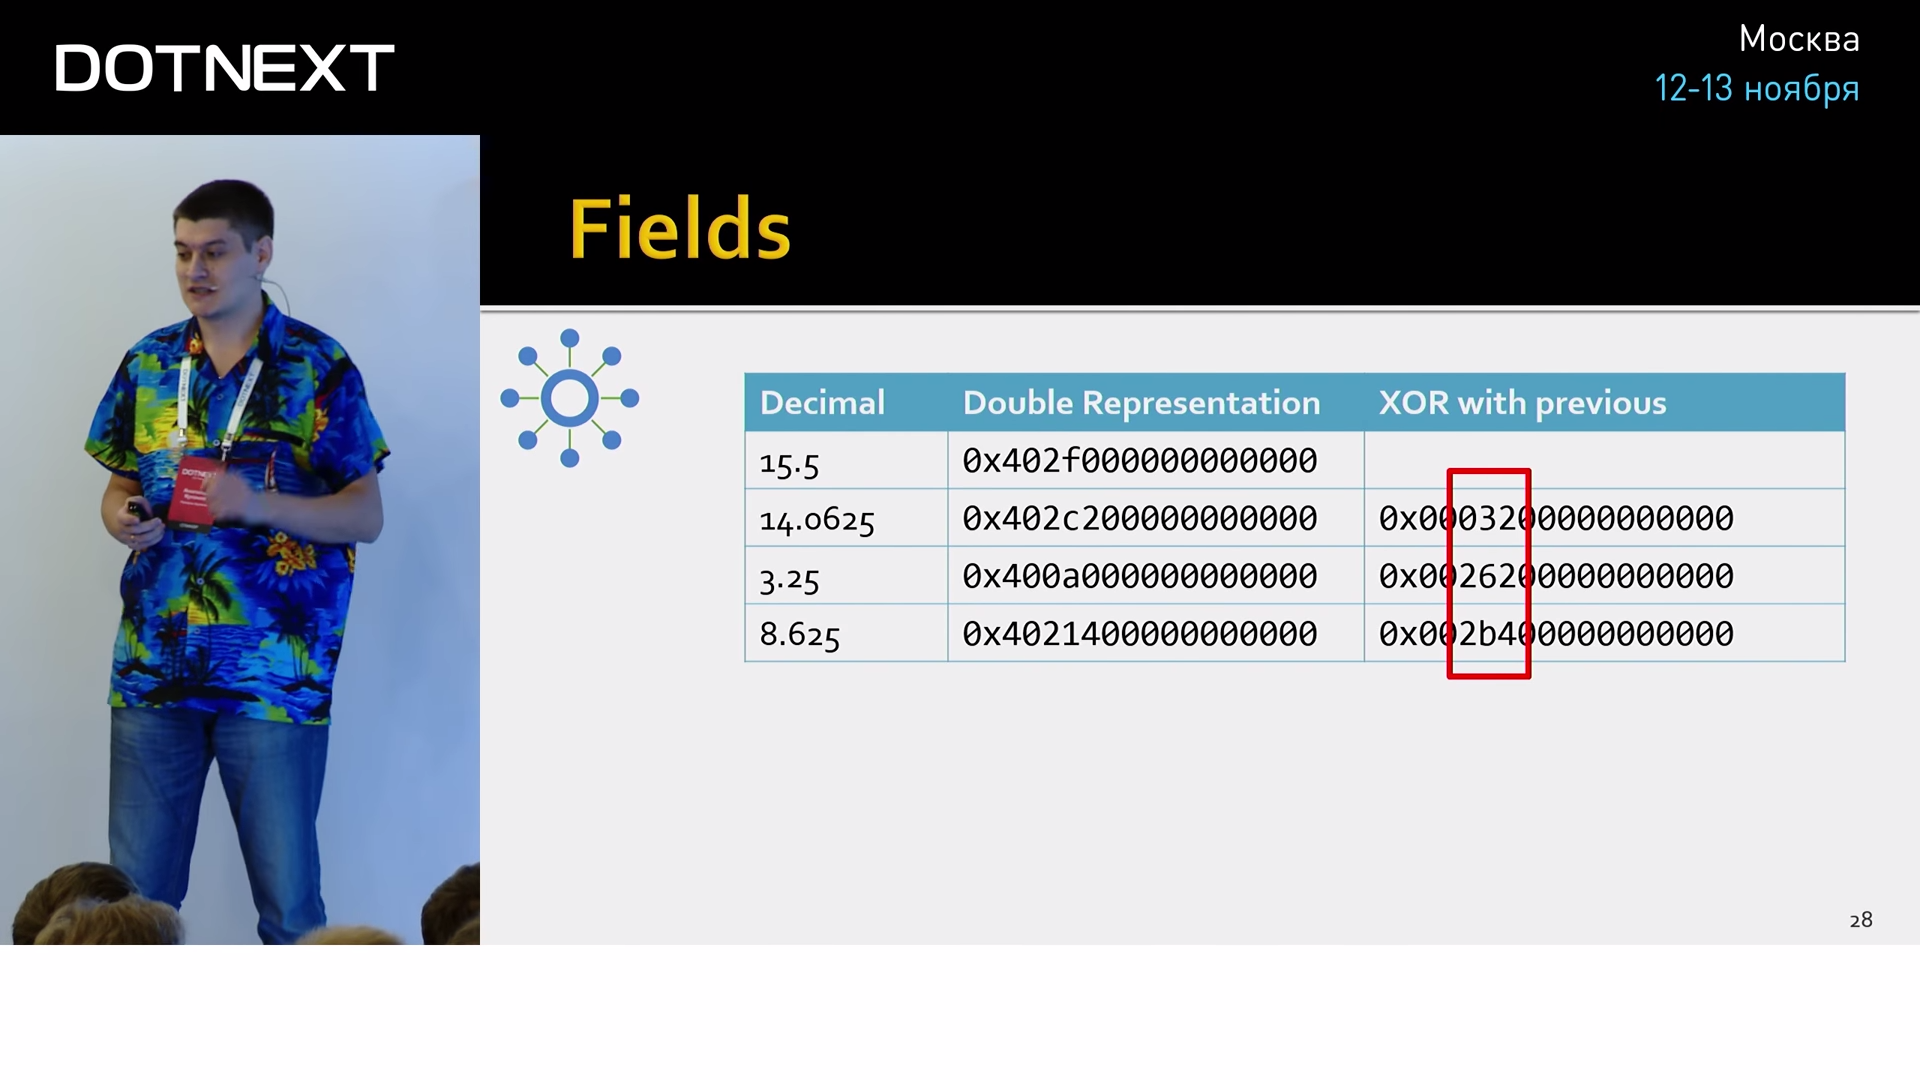
It can be saved using far fewer bits than the original value. And next to him keep the number of zeros from the smallest side. But in practice it is still more fun. According to Facebook statistics, 51% of all values are the same as the previous one, i.e. their XOR will give zero.

And as you probably guessed, one bit is enough to store this special case. And that's not all, XOR in this example is only the most trivial predictor. There are other predictors that dynamically adjust to your current data and thus are able to predict values with a very high probability, which as a result allows even very nontrivial vibrations to be packed into 1 bit.
Accordingly, if the data will arrive at the same interval and never change, we can pack it in two bits. Of course, this does not happen in the real world, and in practice the data changes, which causes Facebook to spend 1.37 bytes per value. And this is only with the help of those primitive algorithms that we have just considered.
These are quite interesting algorithms, you can talk about them for hours, but let's go back from heaven to earth and look at our application and its environment.

- For our application, first of all, the metrics that make it work are important. That is, hardware, operating system. The source of these metrics are Performance Counters. In them you will find a lot of useful information, ranging from CPU, disk space, memory, and ending with higher-level platforms such as: .NET, Garbage Collector, JIT, IIS, SignalR, and so on.

- There are usually third-party components with which we interact. And all normal third-party players must have a statistics API that we can subtract: Seq, MongoDB, MS SQL - all these products have an API with which you can come, query their status and see, for example, how they feel now .
')
- Also, let's not forget about our beloved ETWs, there are also many interesting things there, if suddenly you didn’t find what you were looking for in the first paragraphs, contact them.
- And the most important, highest-level metrics that we have are, of course, the metrics of our own application, your business domain. What size the document opens the user, how many users logged in, the average time of a business transaction - that's all.
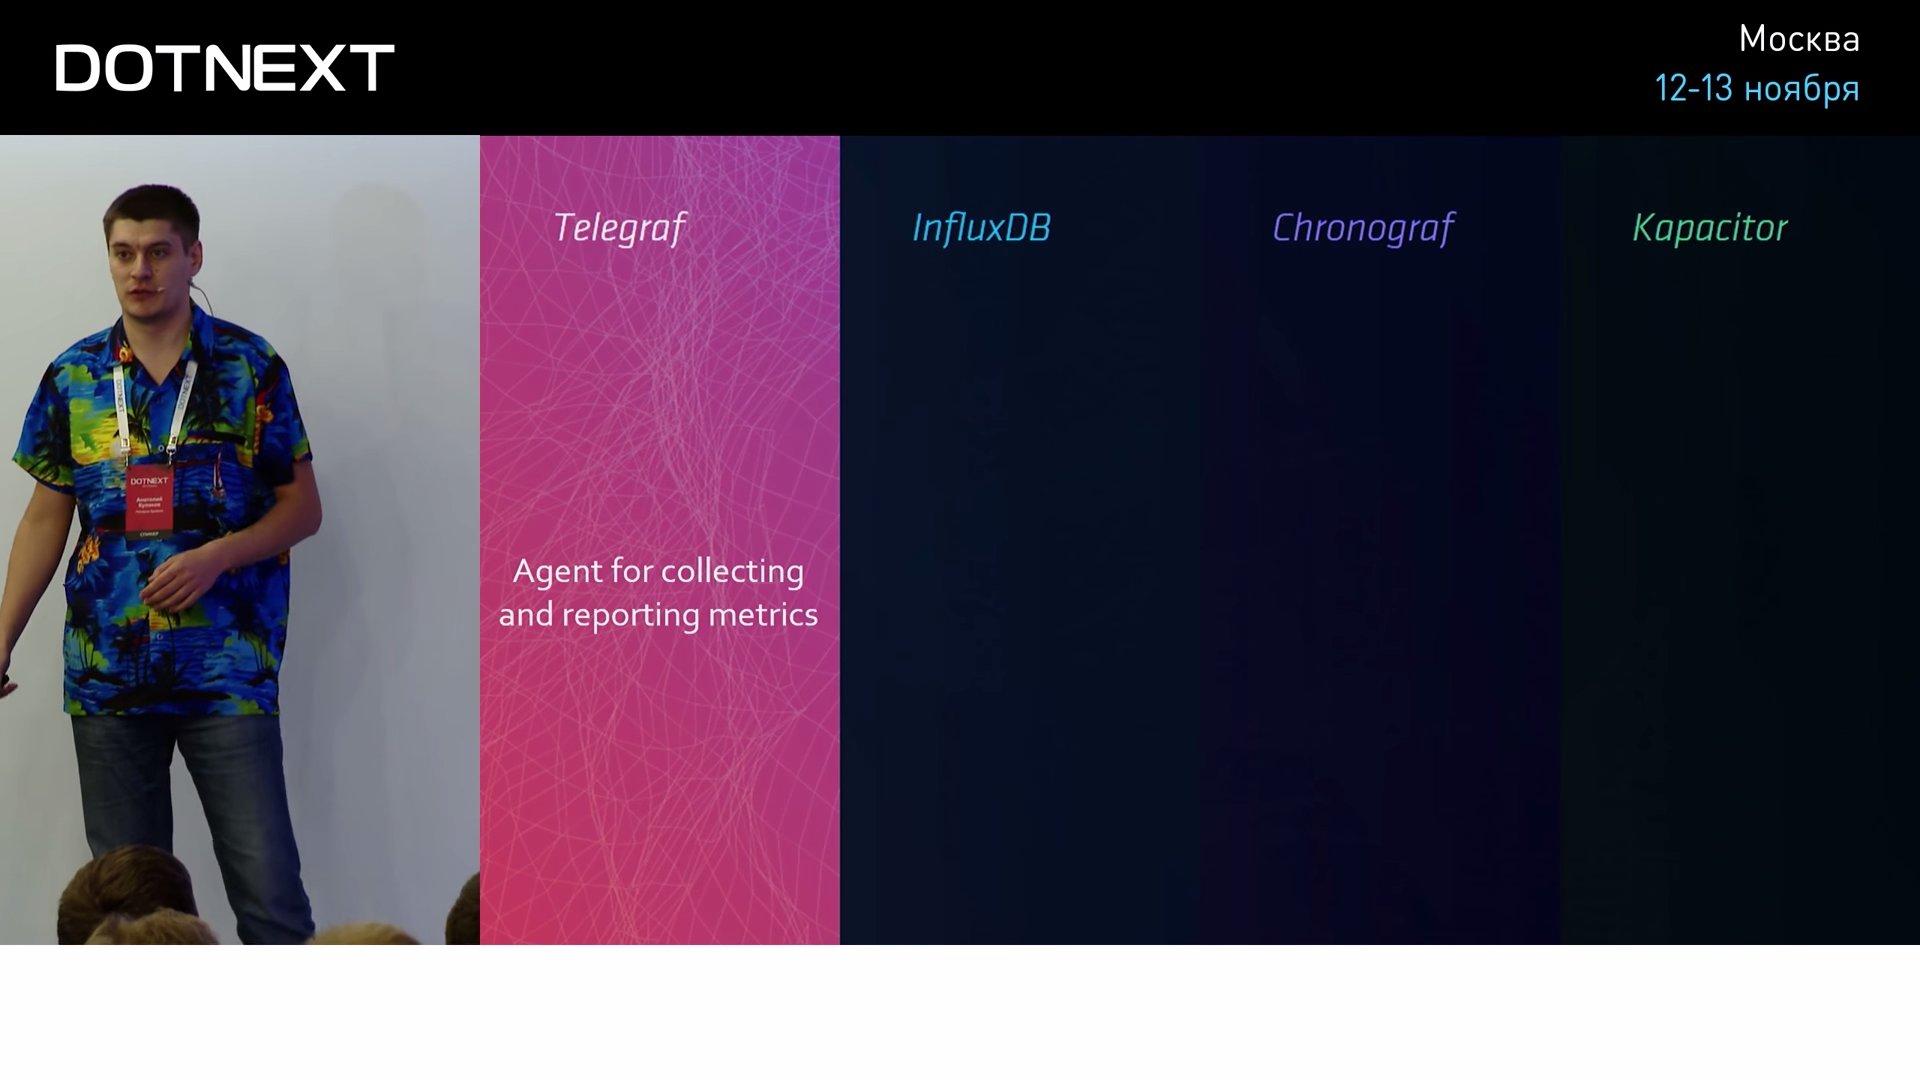
As you can see, there are quite a lot of sources of information, and it is not surprising that there are special software tools that allow you to conveniently collect this information, aggregate it and save it. One such tool is the Telegraf agent. Its standard delivery includes more than a hundred plug-ins for monitoring a wide range of popular programs. System counters, popular databases, web servers, queues and a whole lot more.
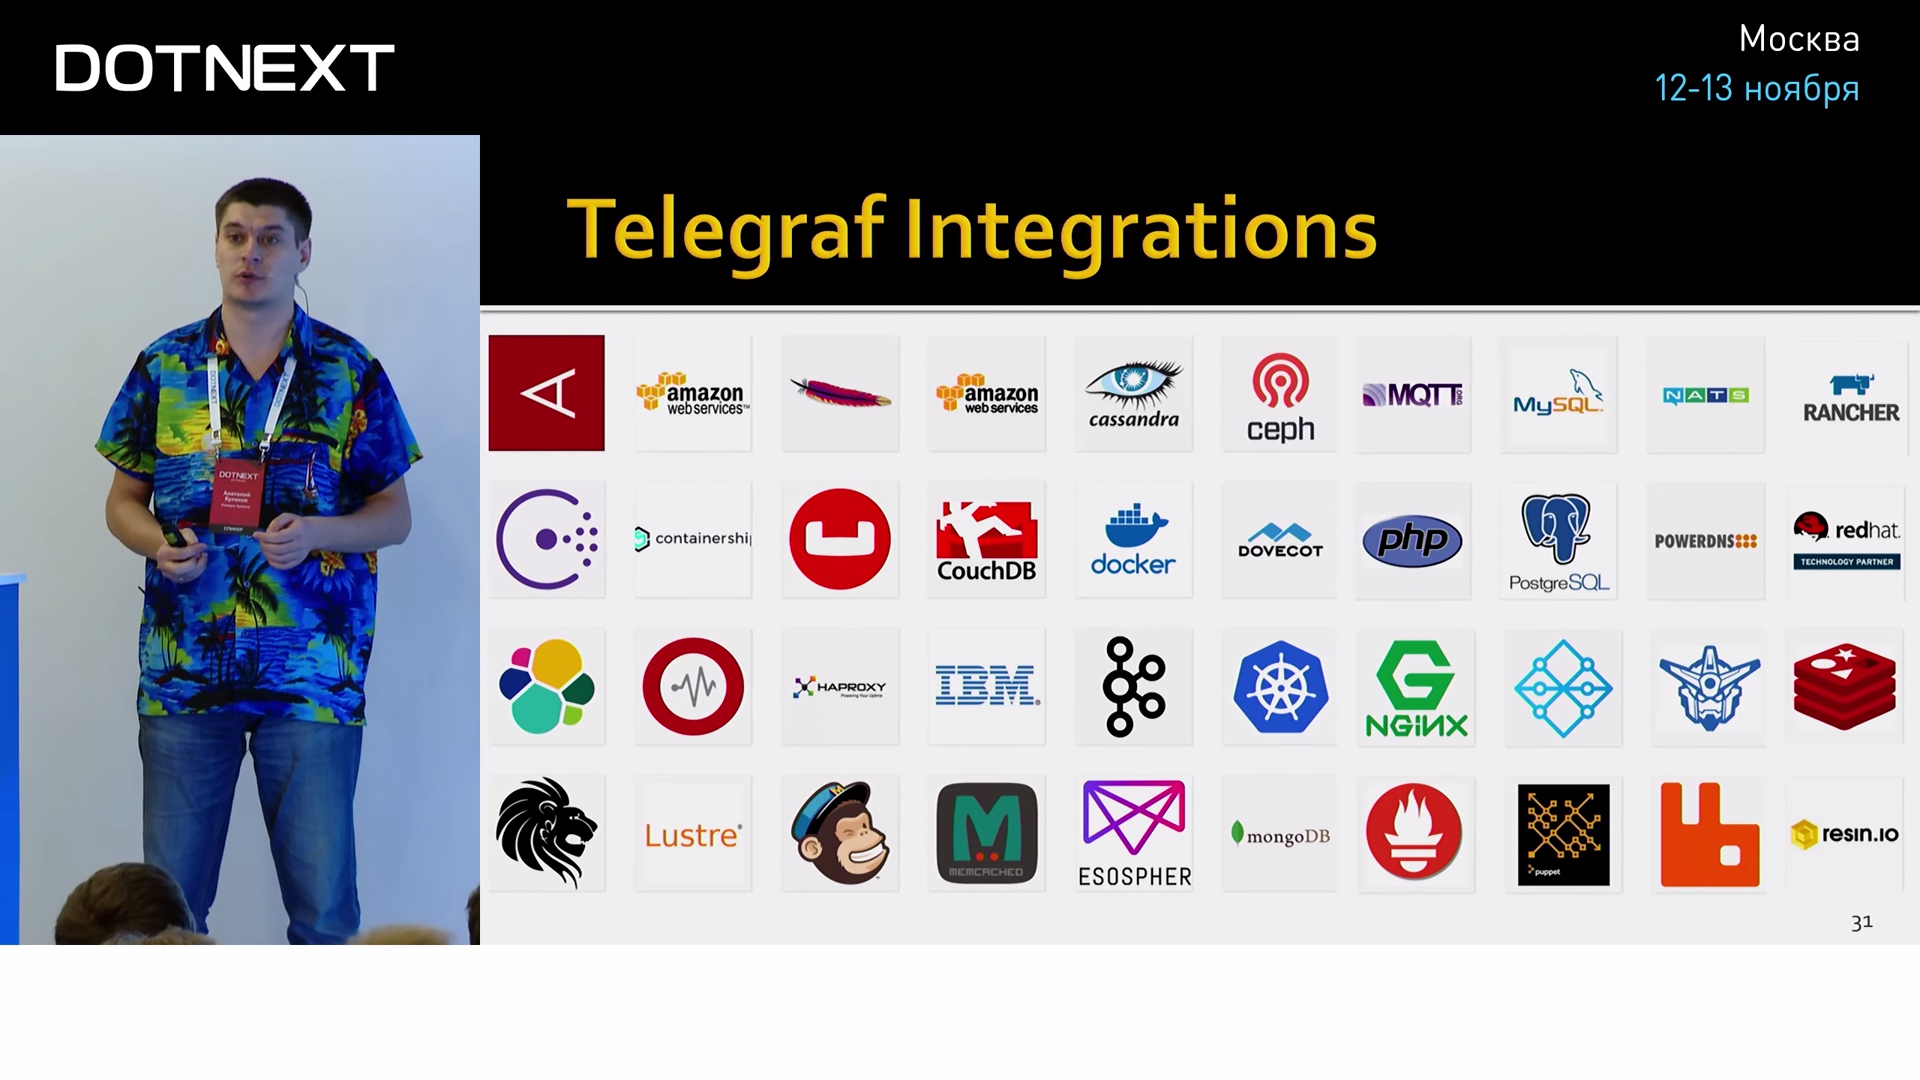
A large community, flexible settings, an excellent system of plug-ins make this tool an indispensable tool in monitoring. Telegraf can not only collect information from different sources and formats, but also can process and aggregate it on the client, which can greatly reduce the volume and load on the central server.
Let's take a practical look at how Telegraf works. Let's start, oddly enough, with Grafana.
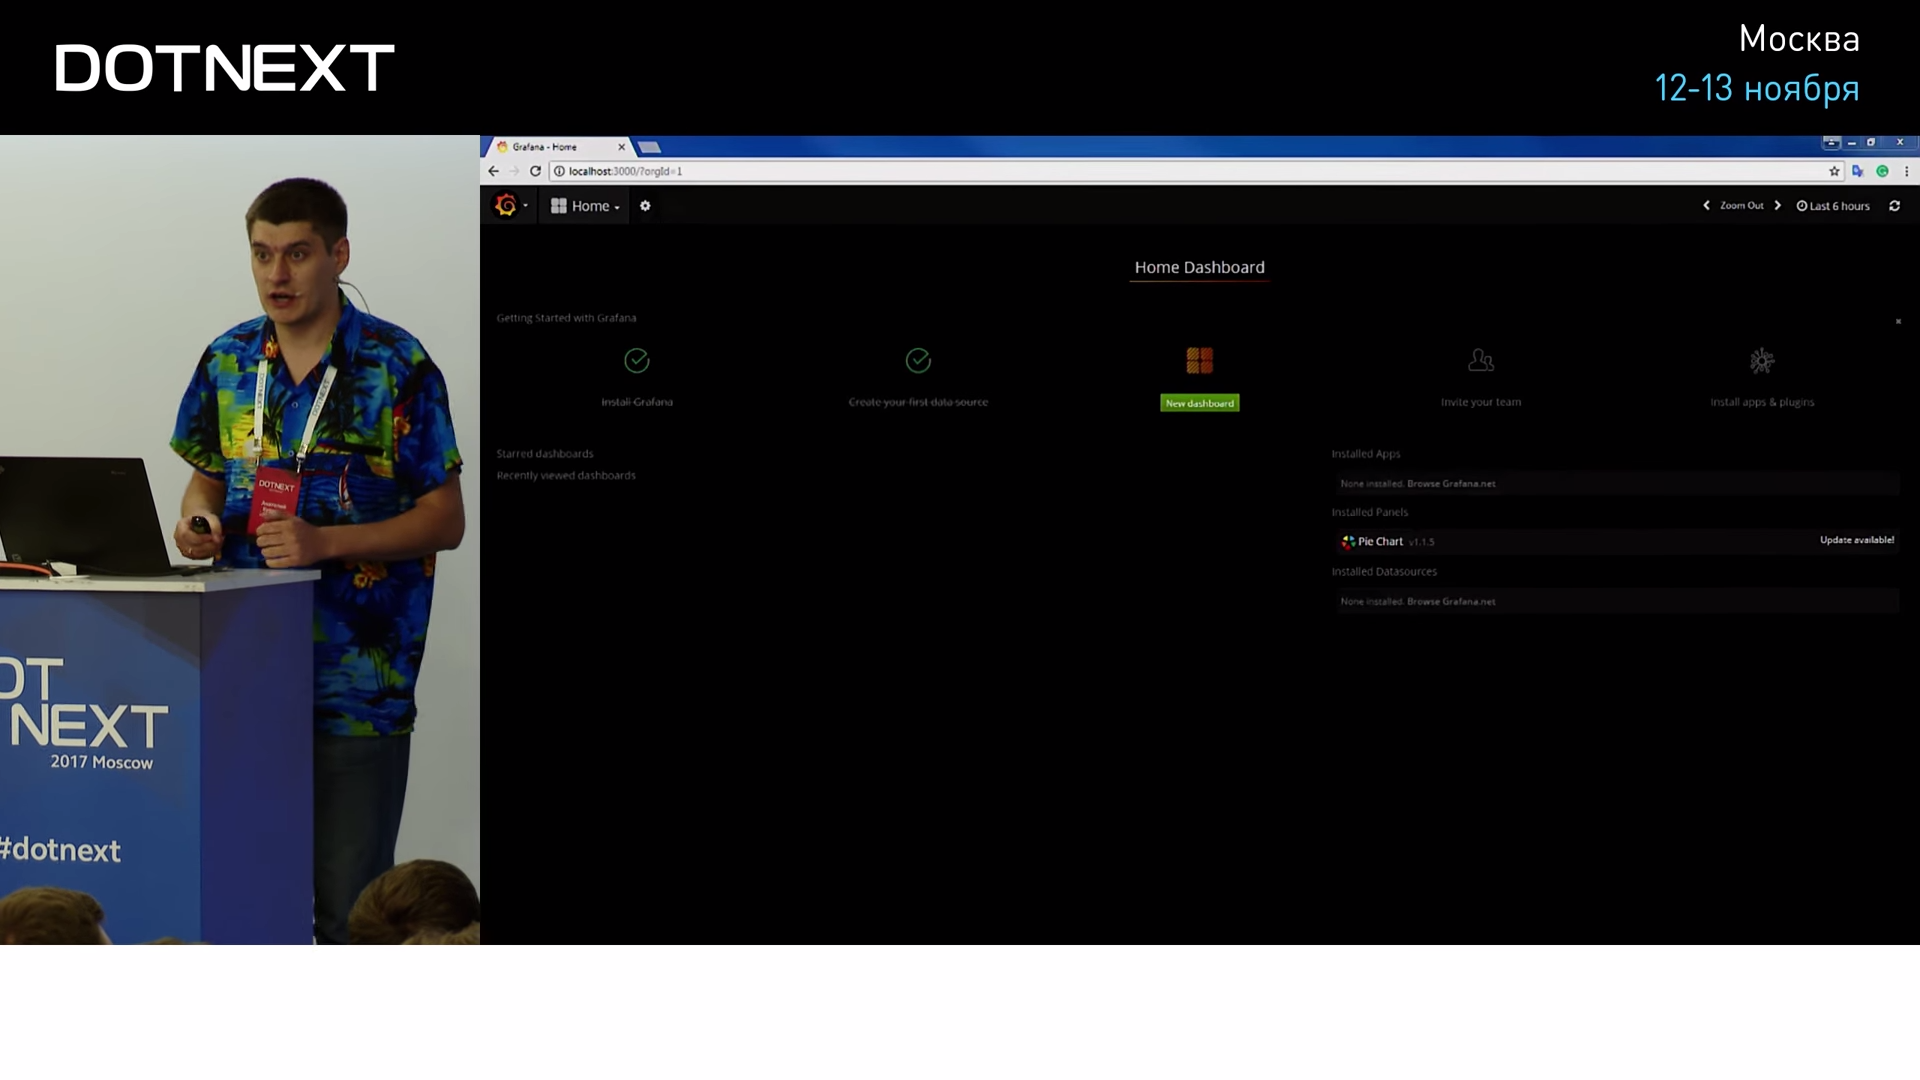
I did not specifically mention Grafana up to this point, so that you understand how low the threshold of entry is. All you need to know: Grafana is a graphical web-based interface that can visualize time series from TSDB. Grafana has a repository that contains many different plug-ins, ready-made dashboards for existing popular systems, different data sources, and so on, we will use one of them now.
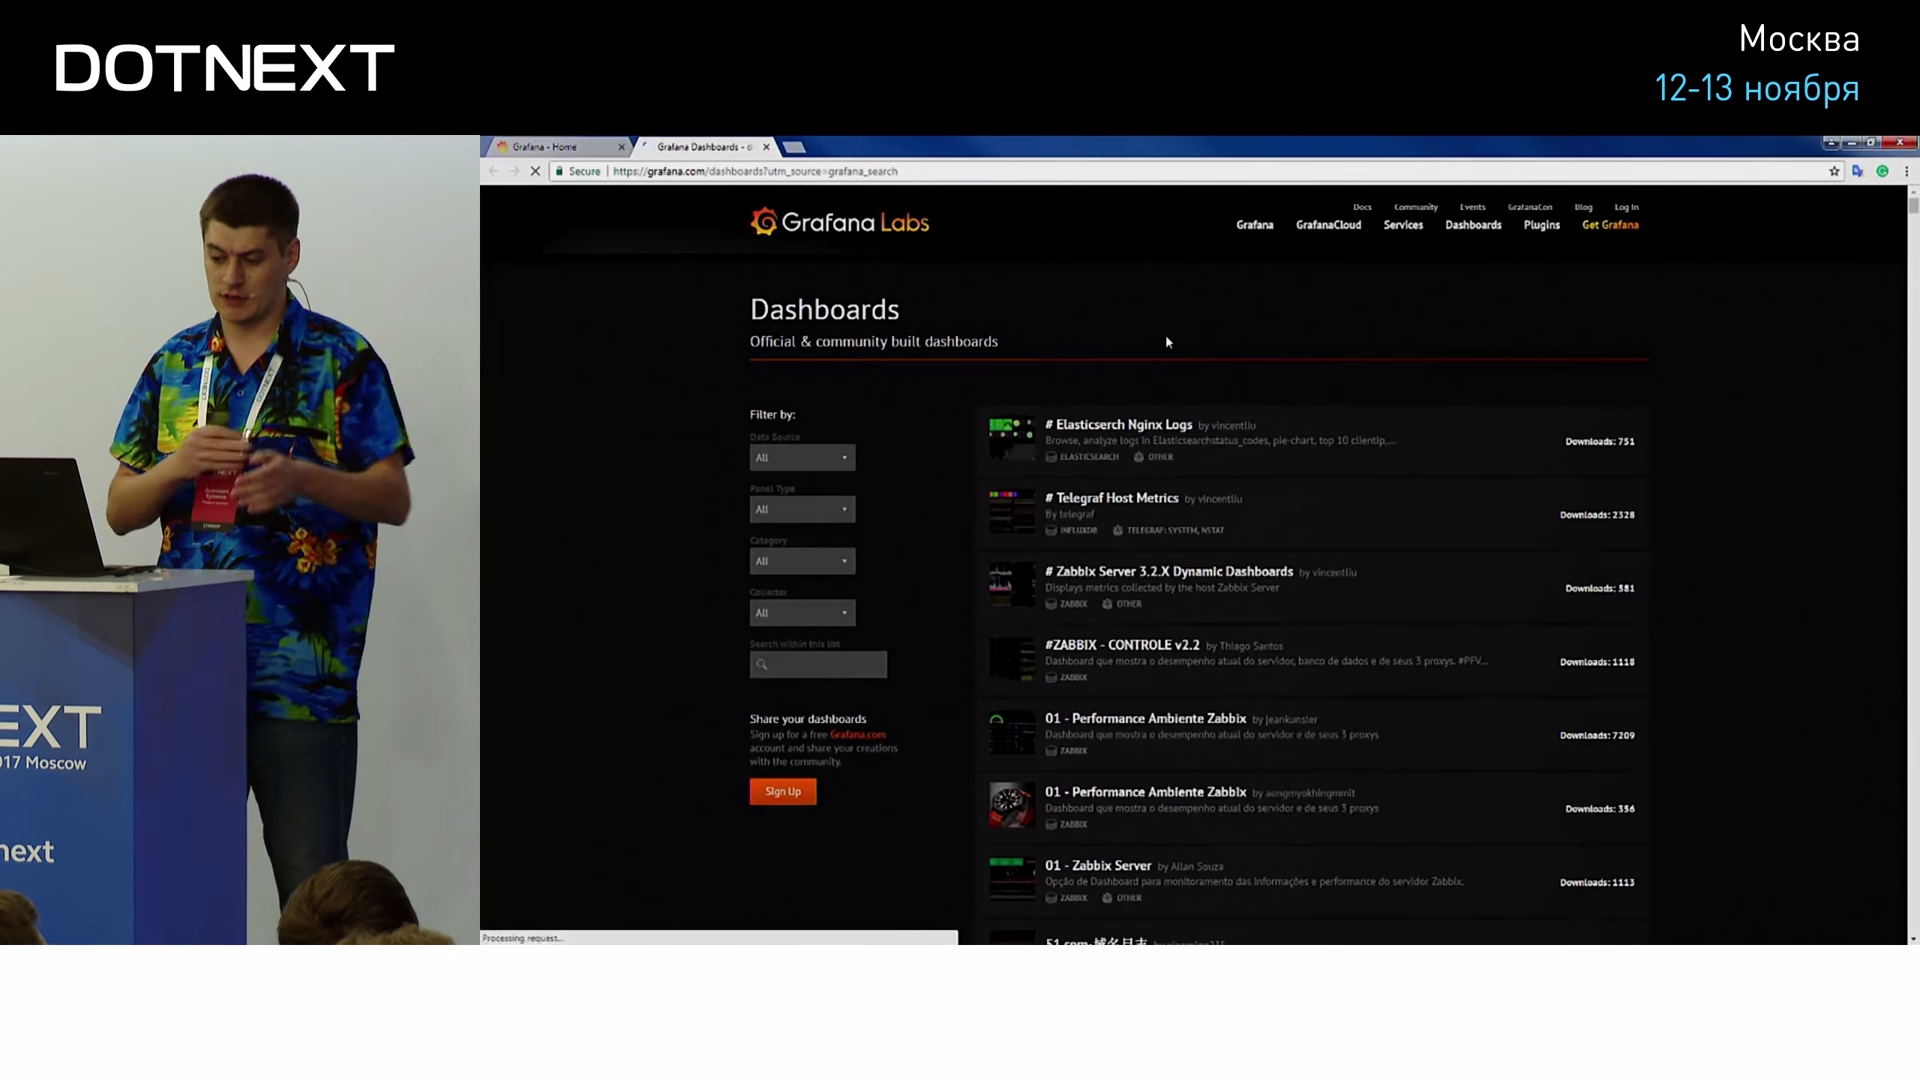
Let's find a dashboard, which is called Influx Windows Host Overview, it is needed just to make a dashboard for Telegraf under Windows.

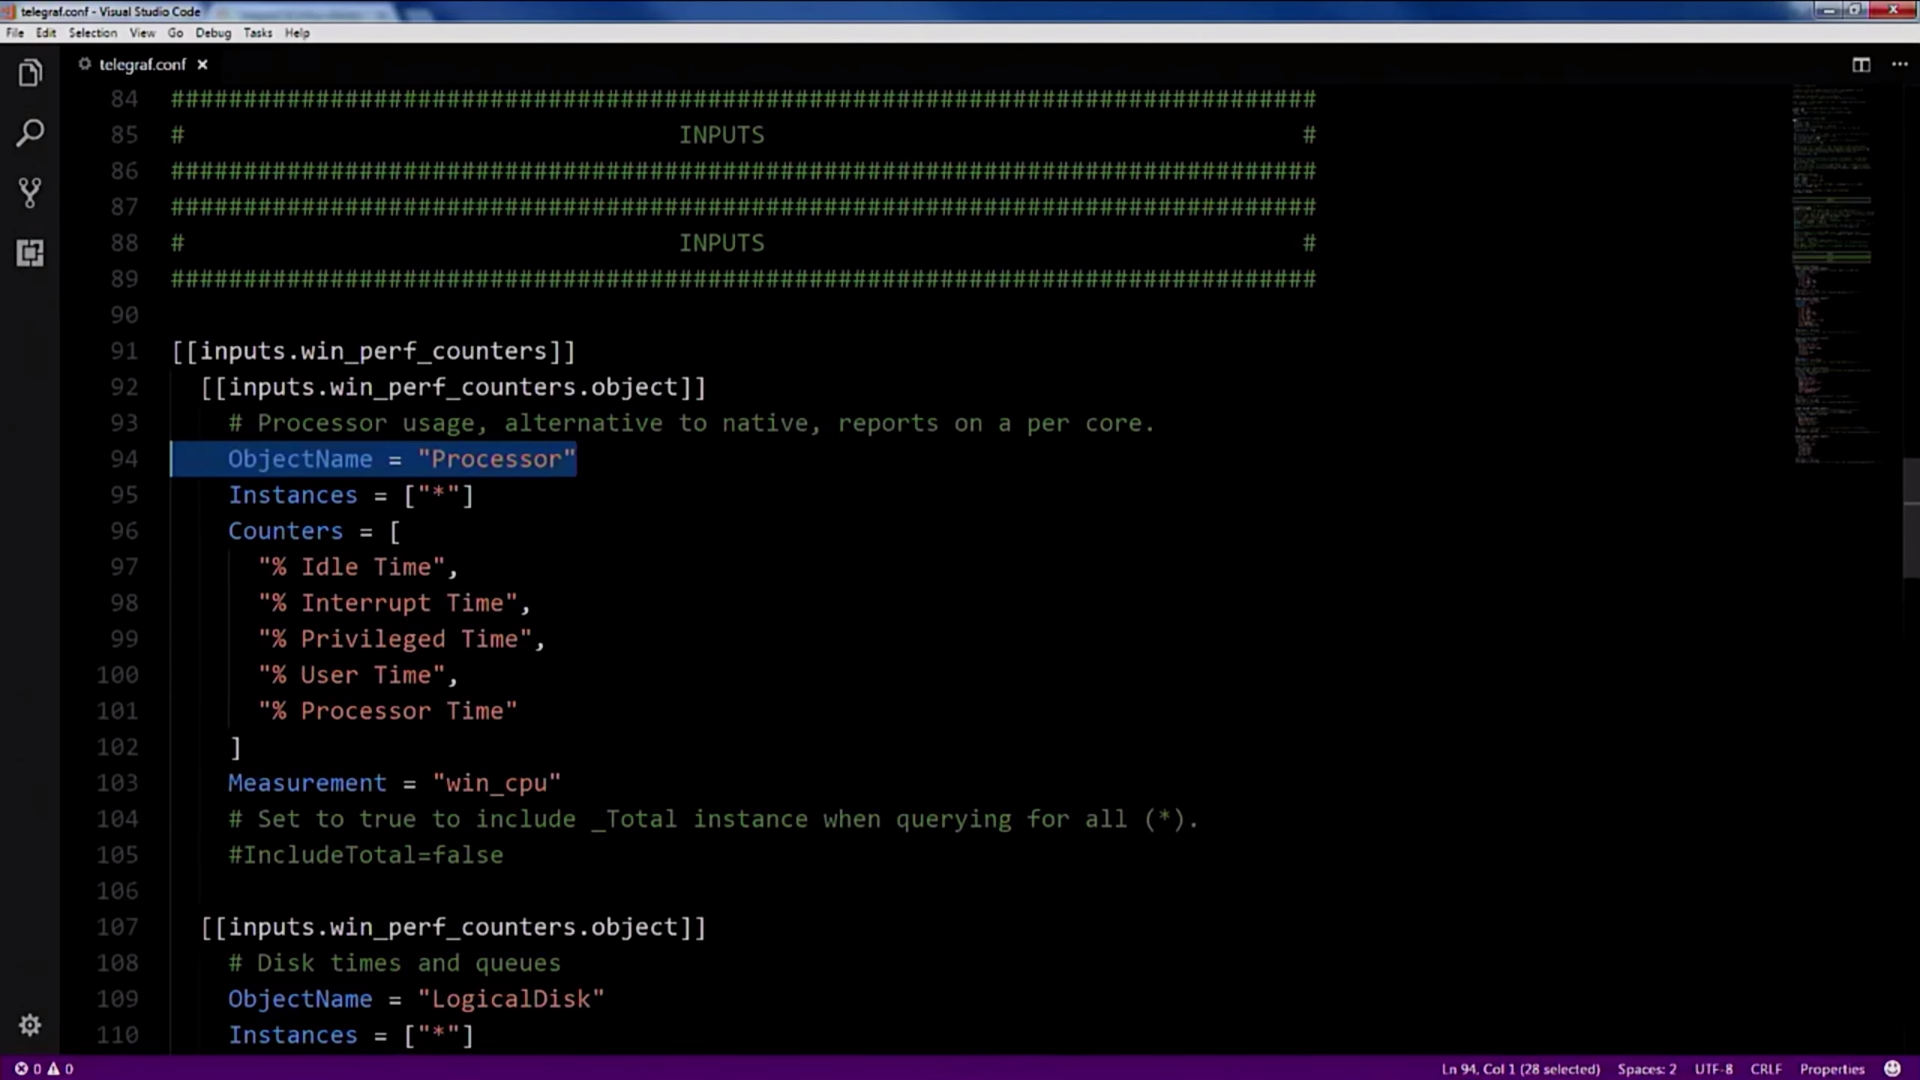
This dashboard consists of two parts: the first is the settings of Telegraf itself, it describes what Performance Counters and in what formats it should report in order for it to be picked up by Grafana.
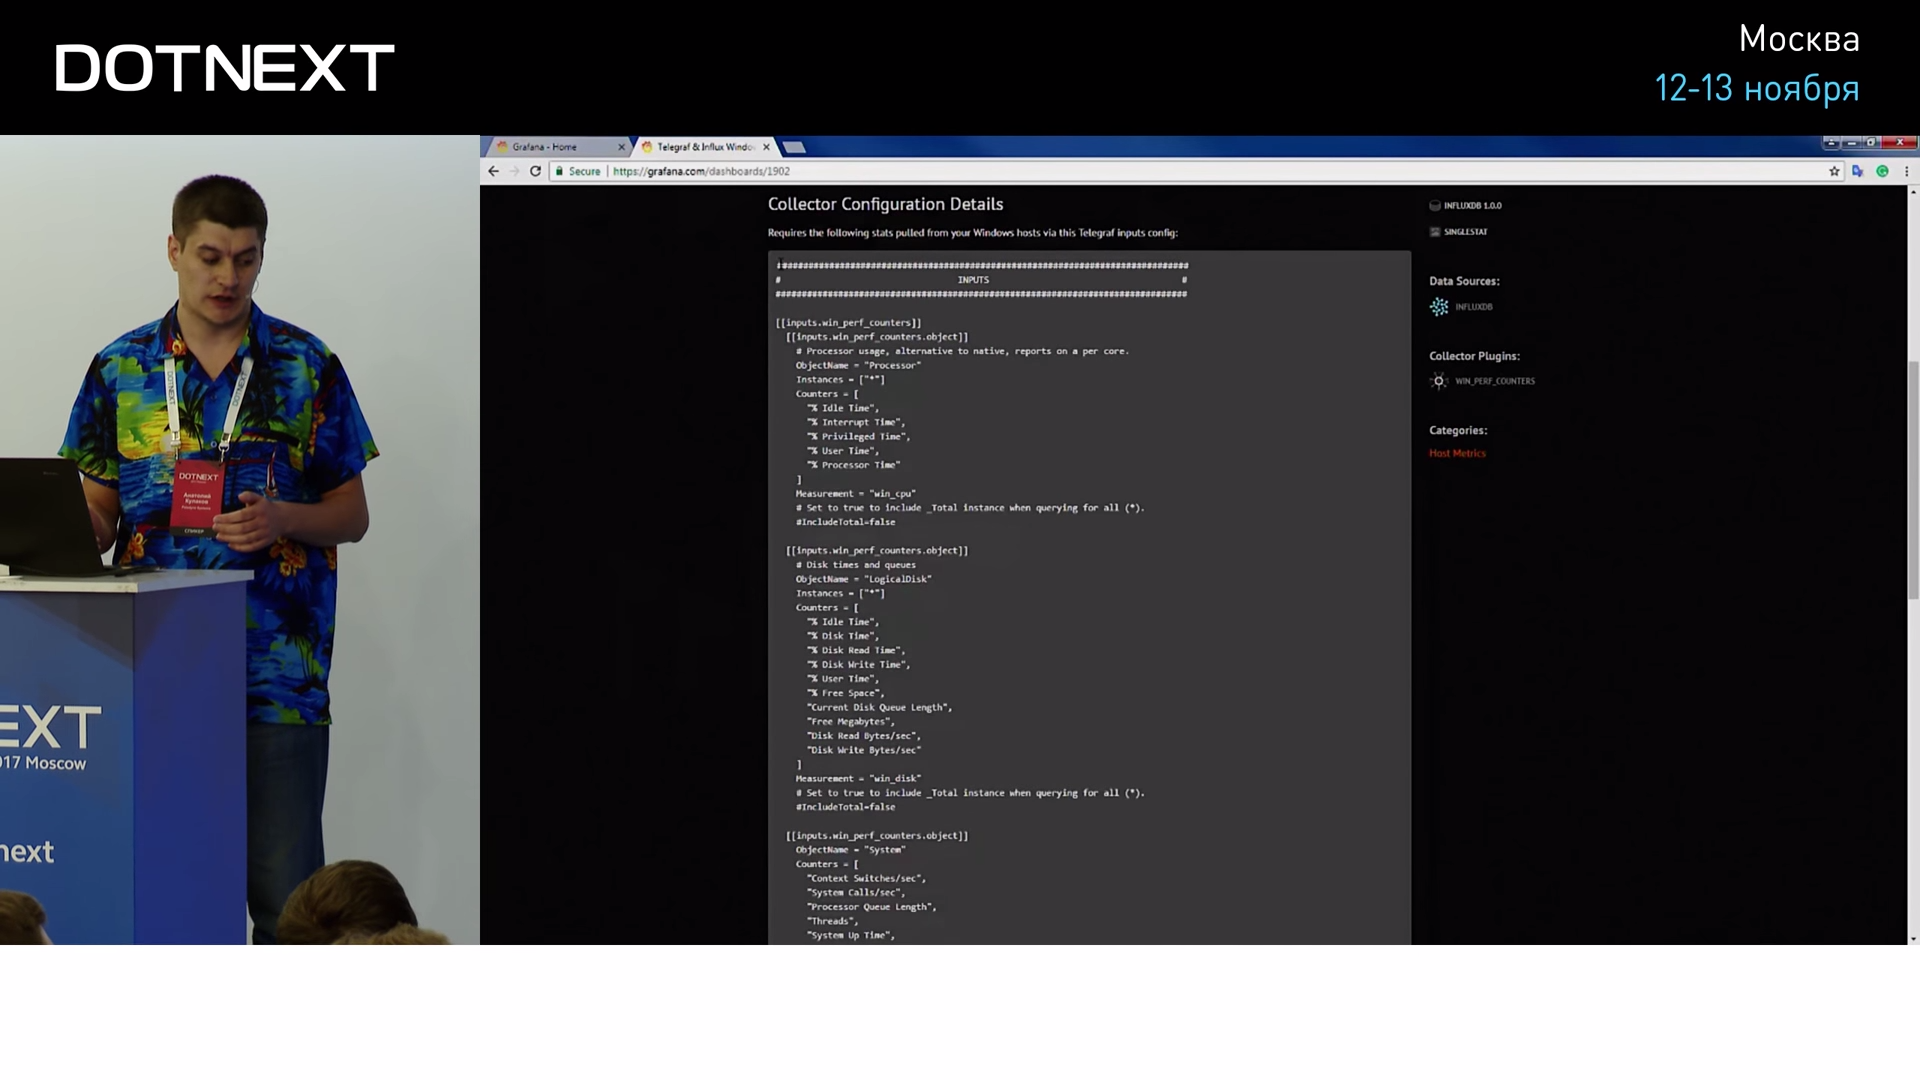
We copy these settings, paste them into the settings of Telegraf itself:
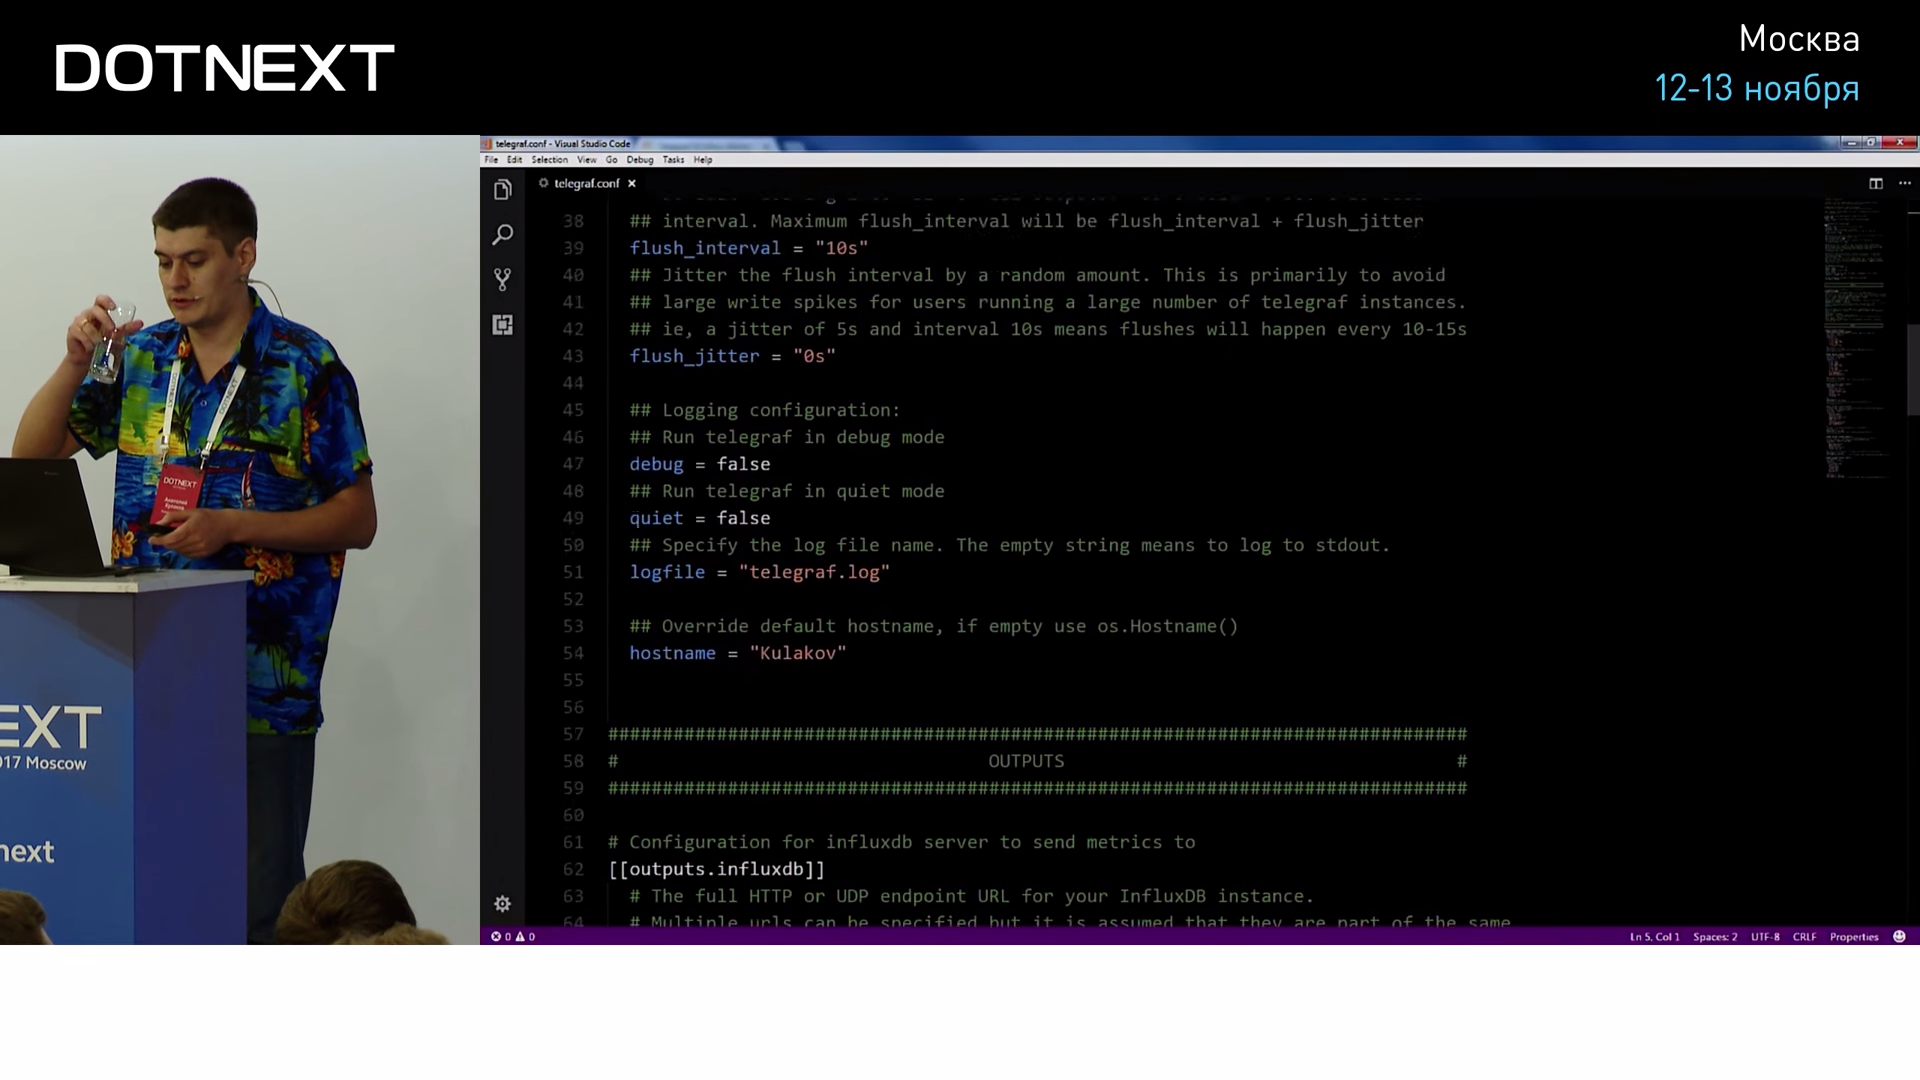
As you can see, the settings are quite intuitive and clear, you specify the name of the performance counter and configure the polling period:
All this Telegraf collects and sends to Influx.
Let's return to our dashboard. As I said, it consists of two parts, now let's talk about the second. The second part is a unique dashboard number, copy it, go to our local Grafana, import the dashboard 19:04 to this unique number, at this moment Grafana goes to the Internet, download the dashboard and the next second will show us a lot of interesting information about our system.
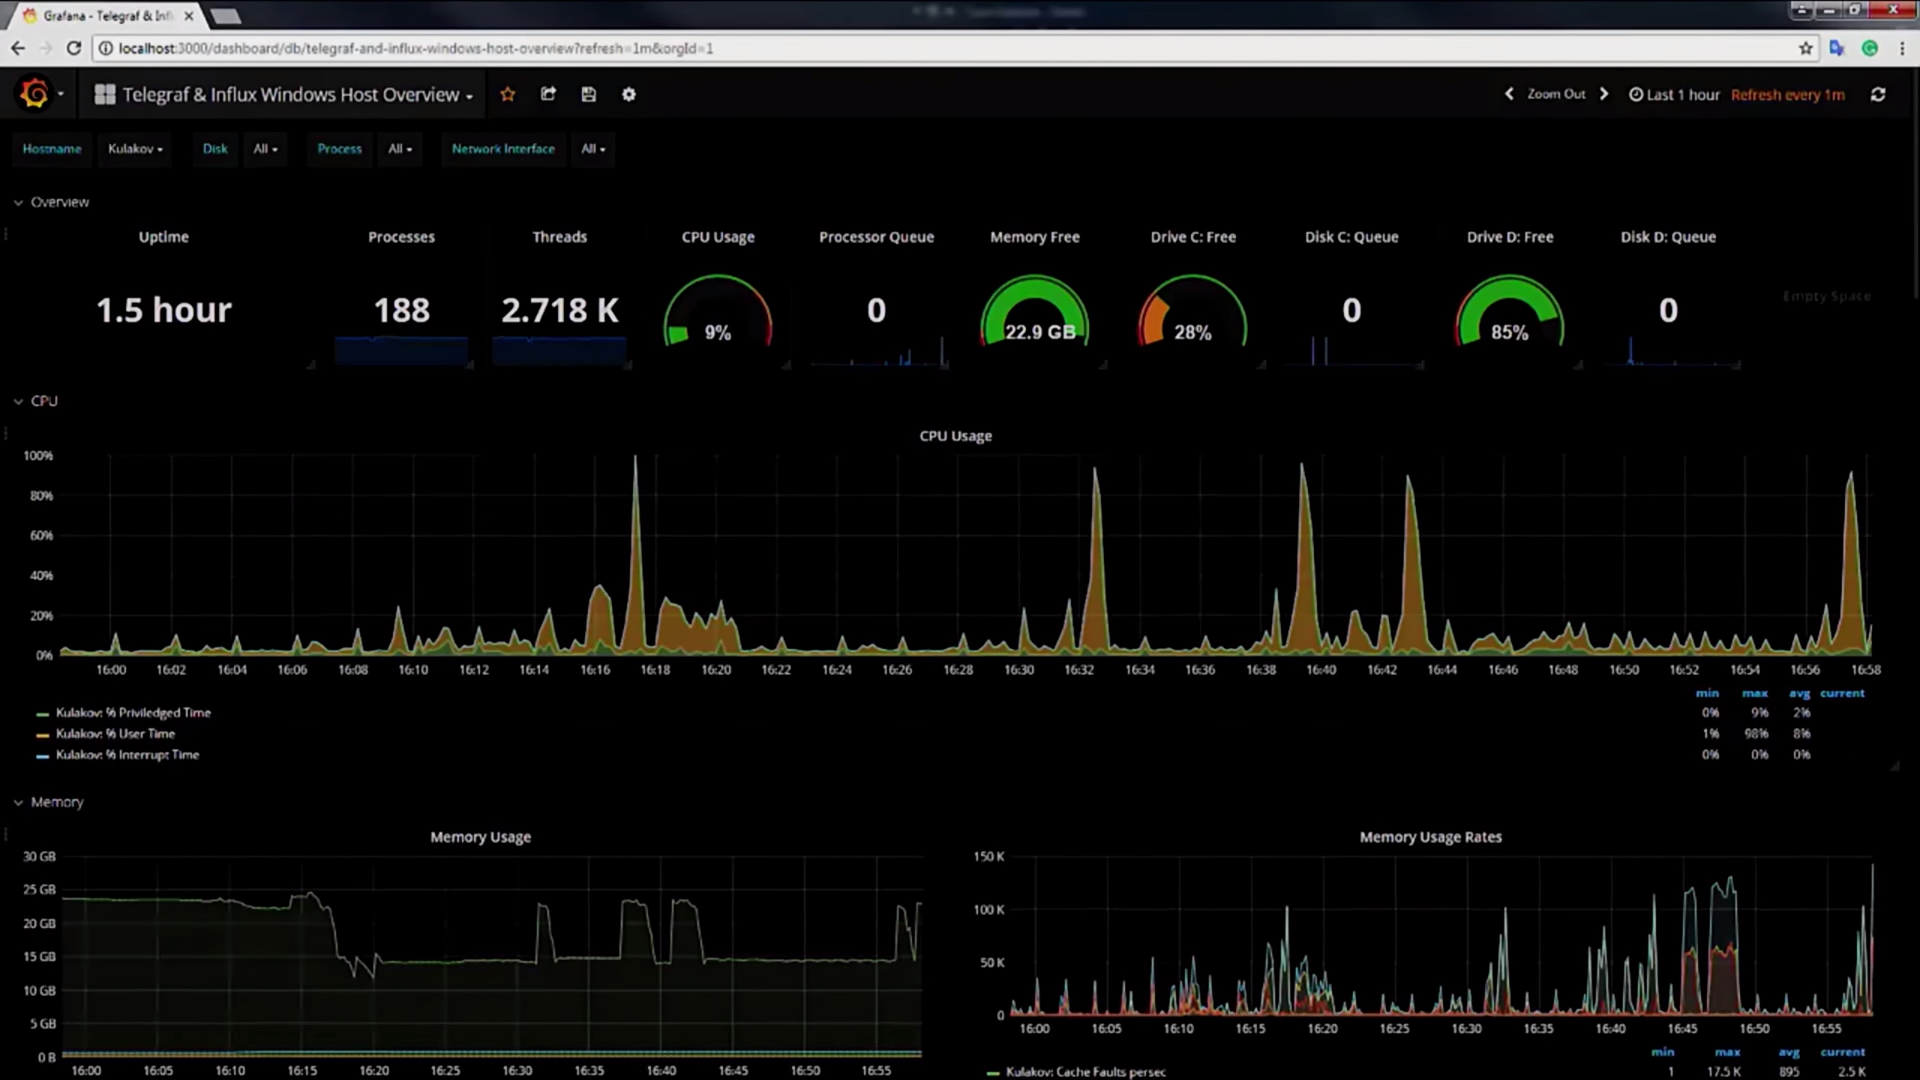
Here you can find complete information about threads, processes, CPU, memory, disks, your network interfaces, how many packets came to you, how many were spent, the number of handles, and so on. I specifically pledged all the processes in the system, but in your production code you need to limit yourself only to those processes that are necessary for your work.
As I said, Telegraf does not directly interact with Grafana, there is Influx between them. InfluxDB is the most popular time series database at the moment.
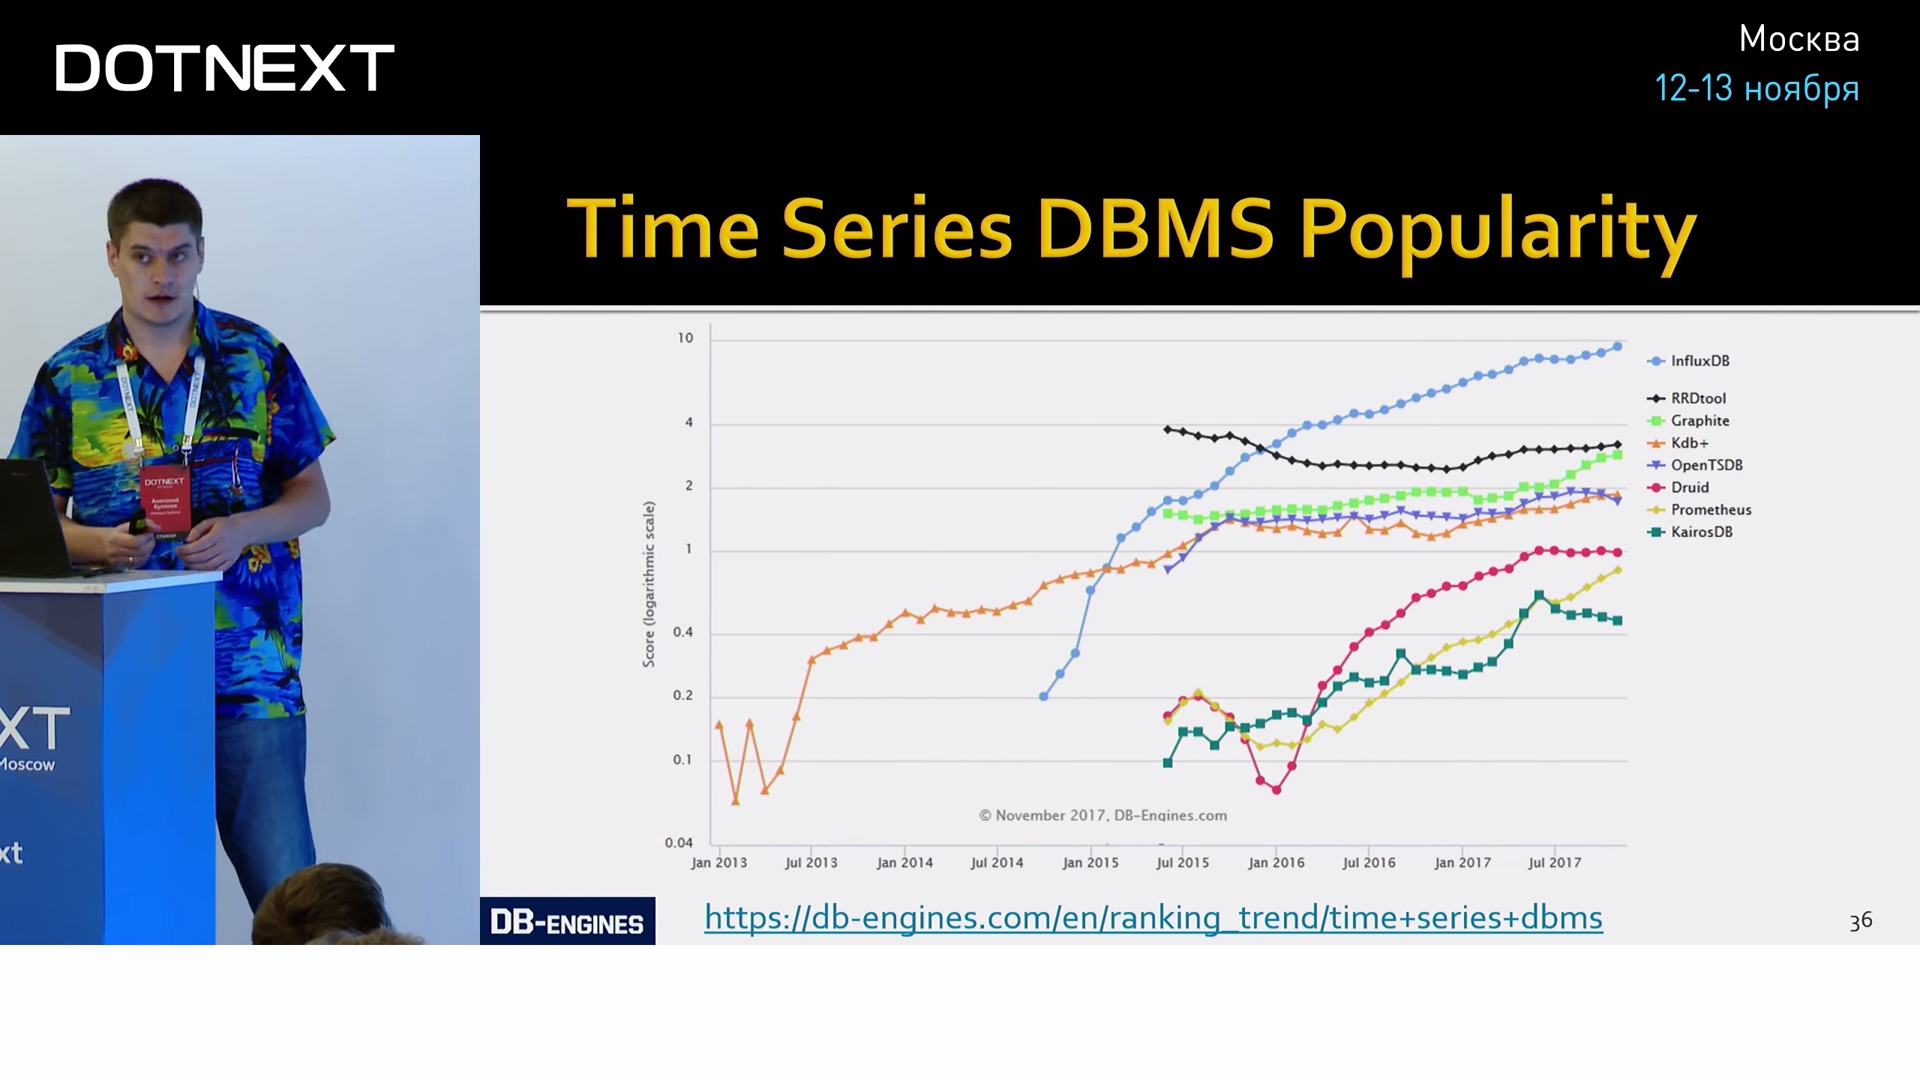
She very quickly overtook all her competitors and is not going to slow down now. And our tests have shown that this is well deserved.
Using the example of Influx, let's look at the specifics of the data TSDB usually works with and what distinguishes them from relational databases:
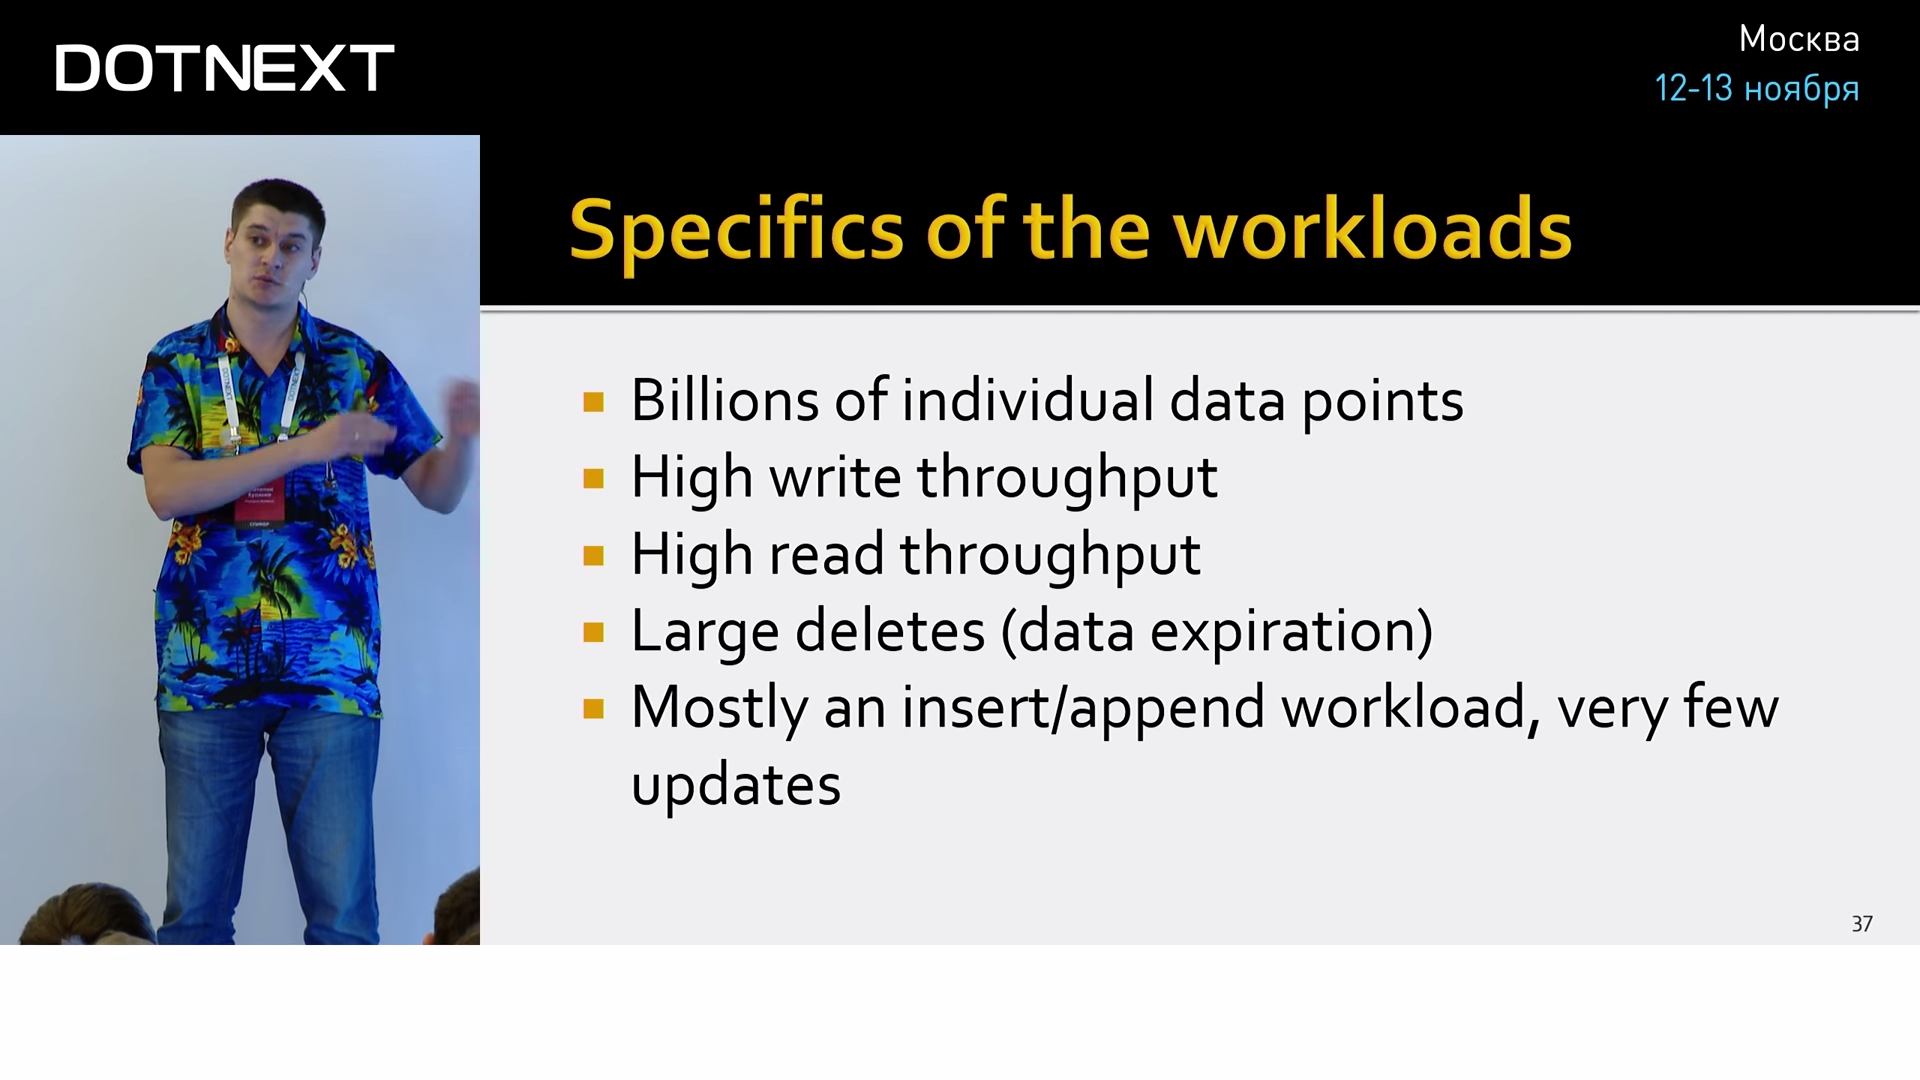
- First, there are millions of data points and millions of series. It’s as if you’ve started creating millions of tables and filling them with millions of values in your relational database, this is quite rare in practice. And for Influx this is the standard situation.
- Frequent entry. The fact is that the data in the metrics are written constantly, even if the user does nothing. Metrics are written that he does nothing, still does nothing and so on.
- The same situation with reading. Analytics, dashboards, alerts, all require constant reading, so there are also very large loads.
- Uninstall. It occurs in large batches, because the main reason for deletion is simply the “swelling” of the data.
- There are almost no updates, and they can be neglected.
In terms of CRUD, Influx is a CR-system; fast data creation and reading is very important to it. Updates and deletions happen very rarely and in quite specific and well-optimized situations.
Under the hood, it stores data in its own time-structured merge-tree format.
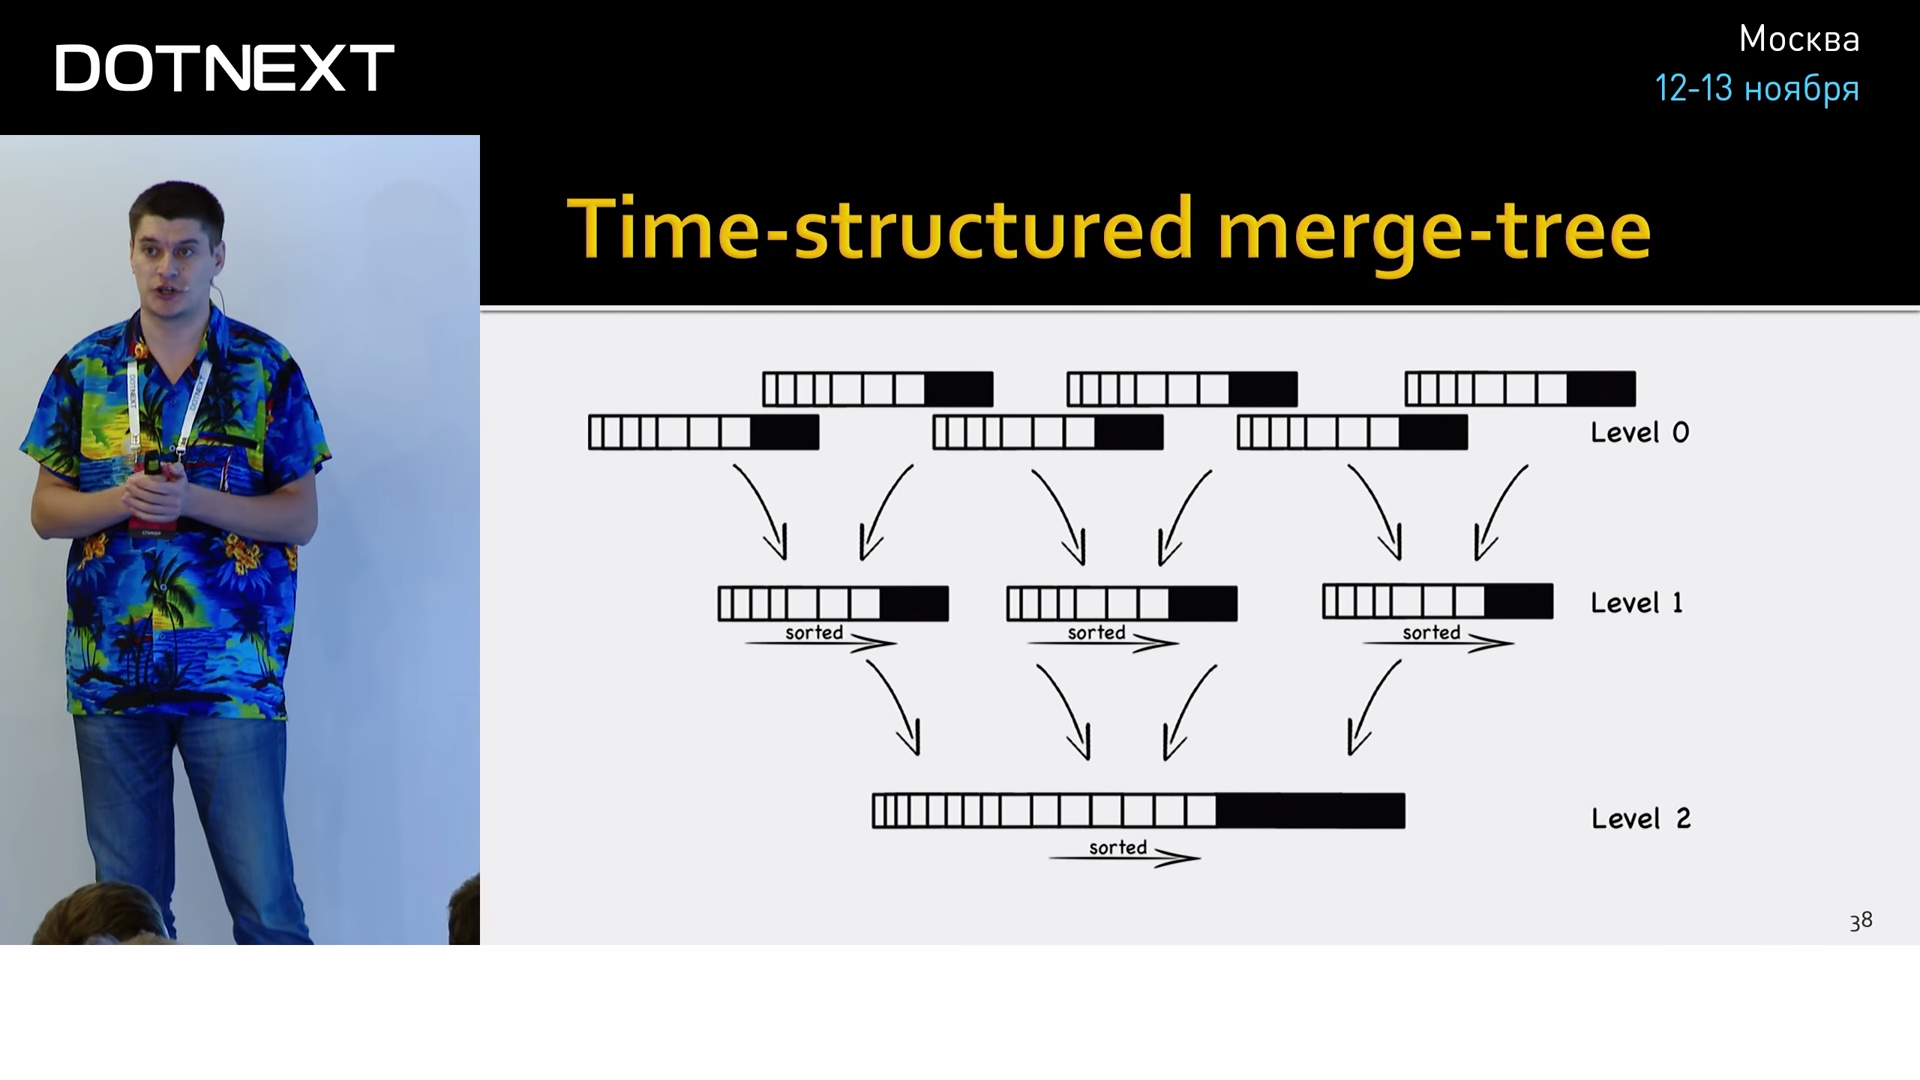
This is an optimization of the well-known log-structured merge-tree (LSM-tree) as applied to time series, which has worked well in practice. This is a data structure optimized for fast index access with frequent inserts. Used, for example, in the transaction logs of almost all modern databases.
Another big advantage of Influx is the SQL-like query syntax.
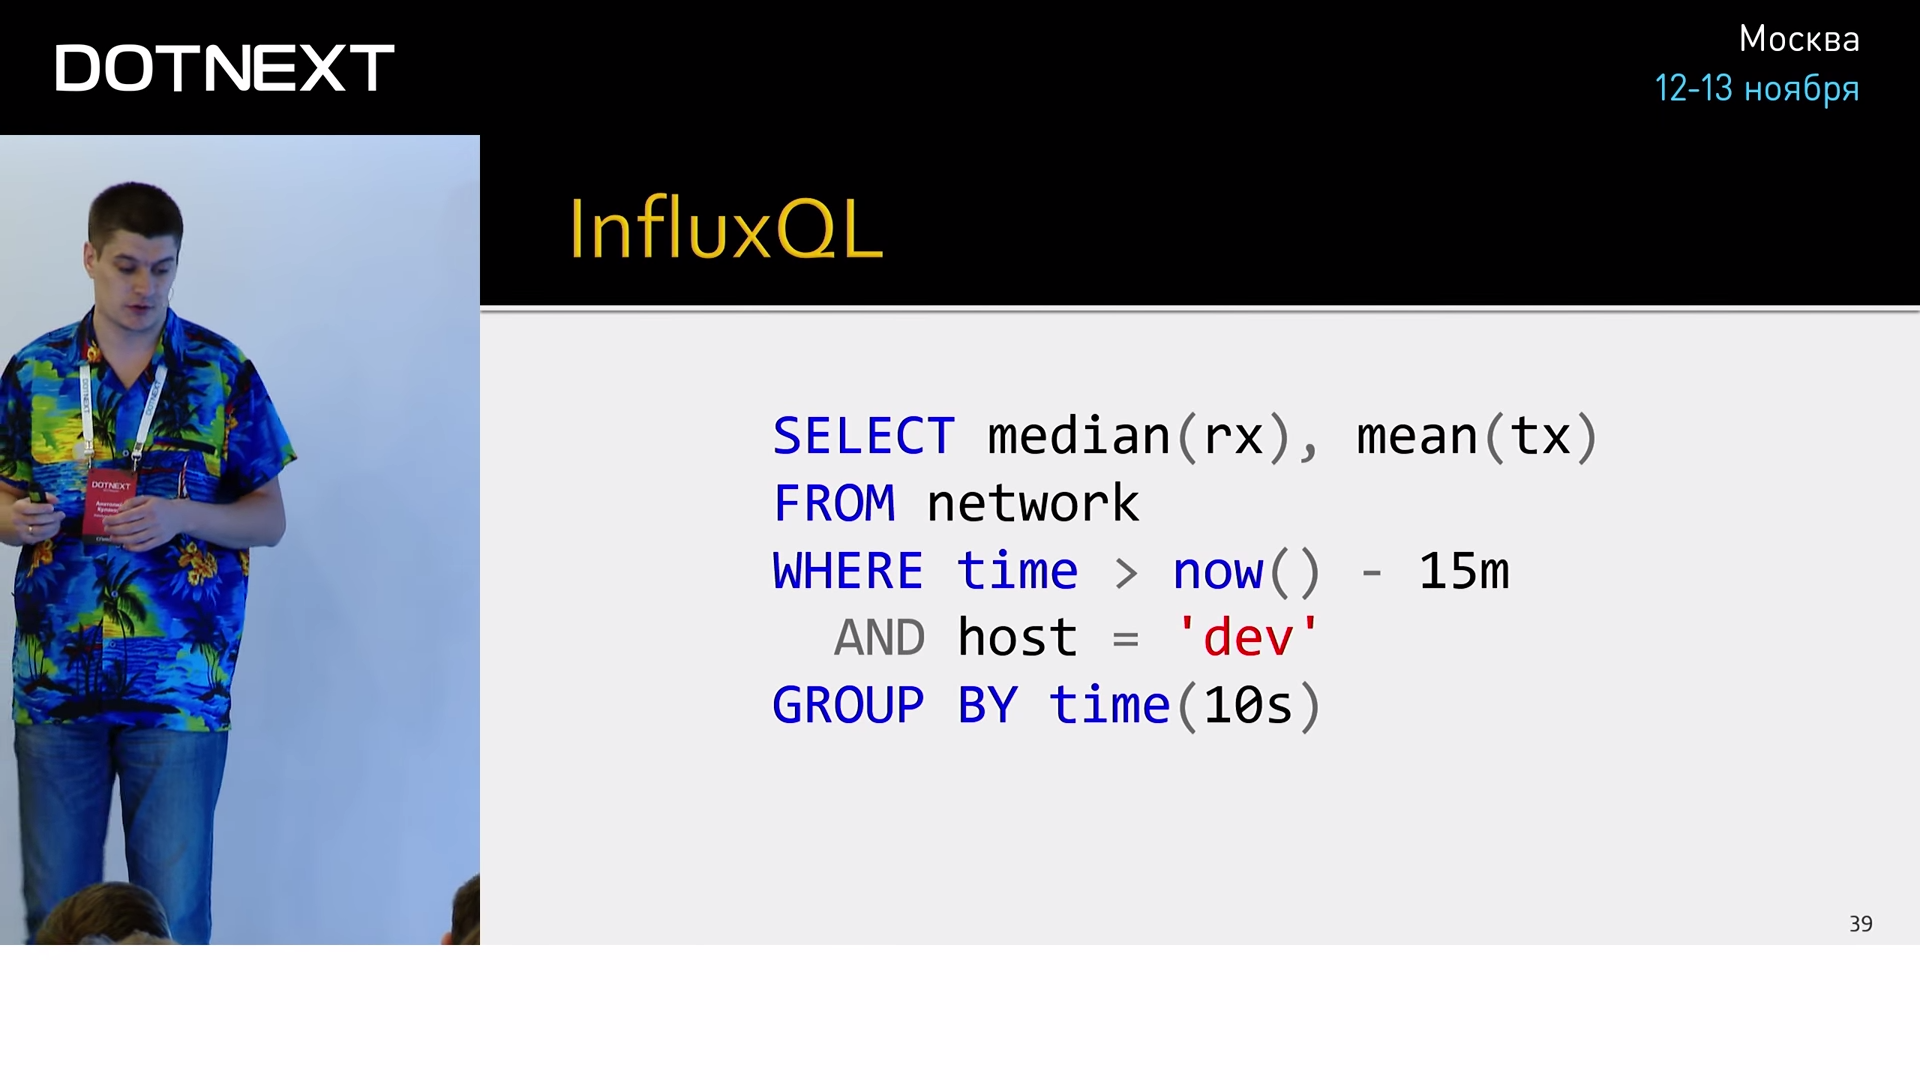
Why is it important? His previous opponents very much sinned with a poor elaboration of this aspect, they asked us to make inquiries from such a godless mixture, like regular expressions, JSON and a sick psyche of authors. It was generally impossible to maintain, somewhere in a week you come, look at your requests, and your eyes are leaking. And it was the normal query syntax that allowed Influx to shoot at the mass public.
If we are talking about the fact that we constantly accumulate data, it is necessary to understand what we are doing with them. For this there is the Retention policy (a special mechanism that involves deleting data after a certain period of time, if you do not need them). But this is too trite. If you cross it with a feature such as Continuous Queries (this is something like a materialized view, a precomputation of complex aggregates on the server), you get such an interesting mechanism as downsampling. Let's give an example.
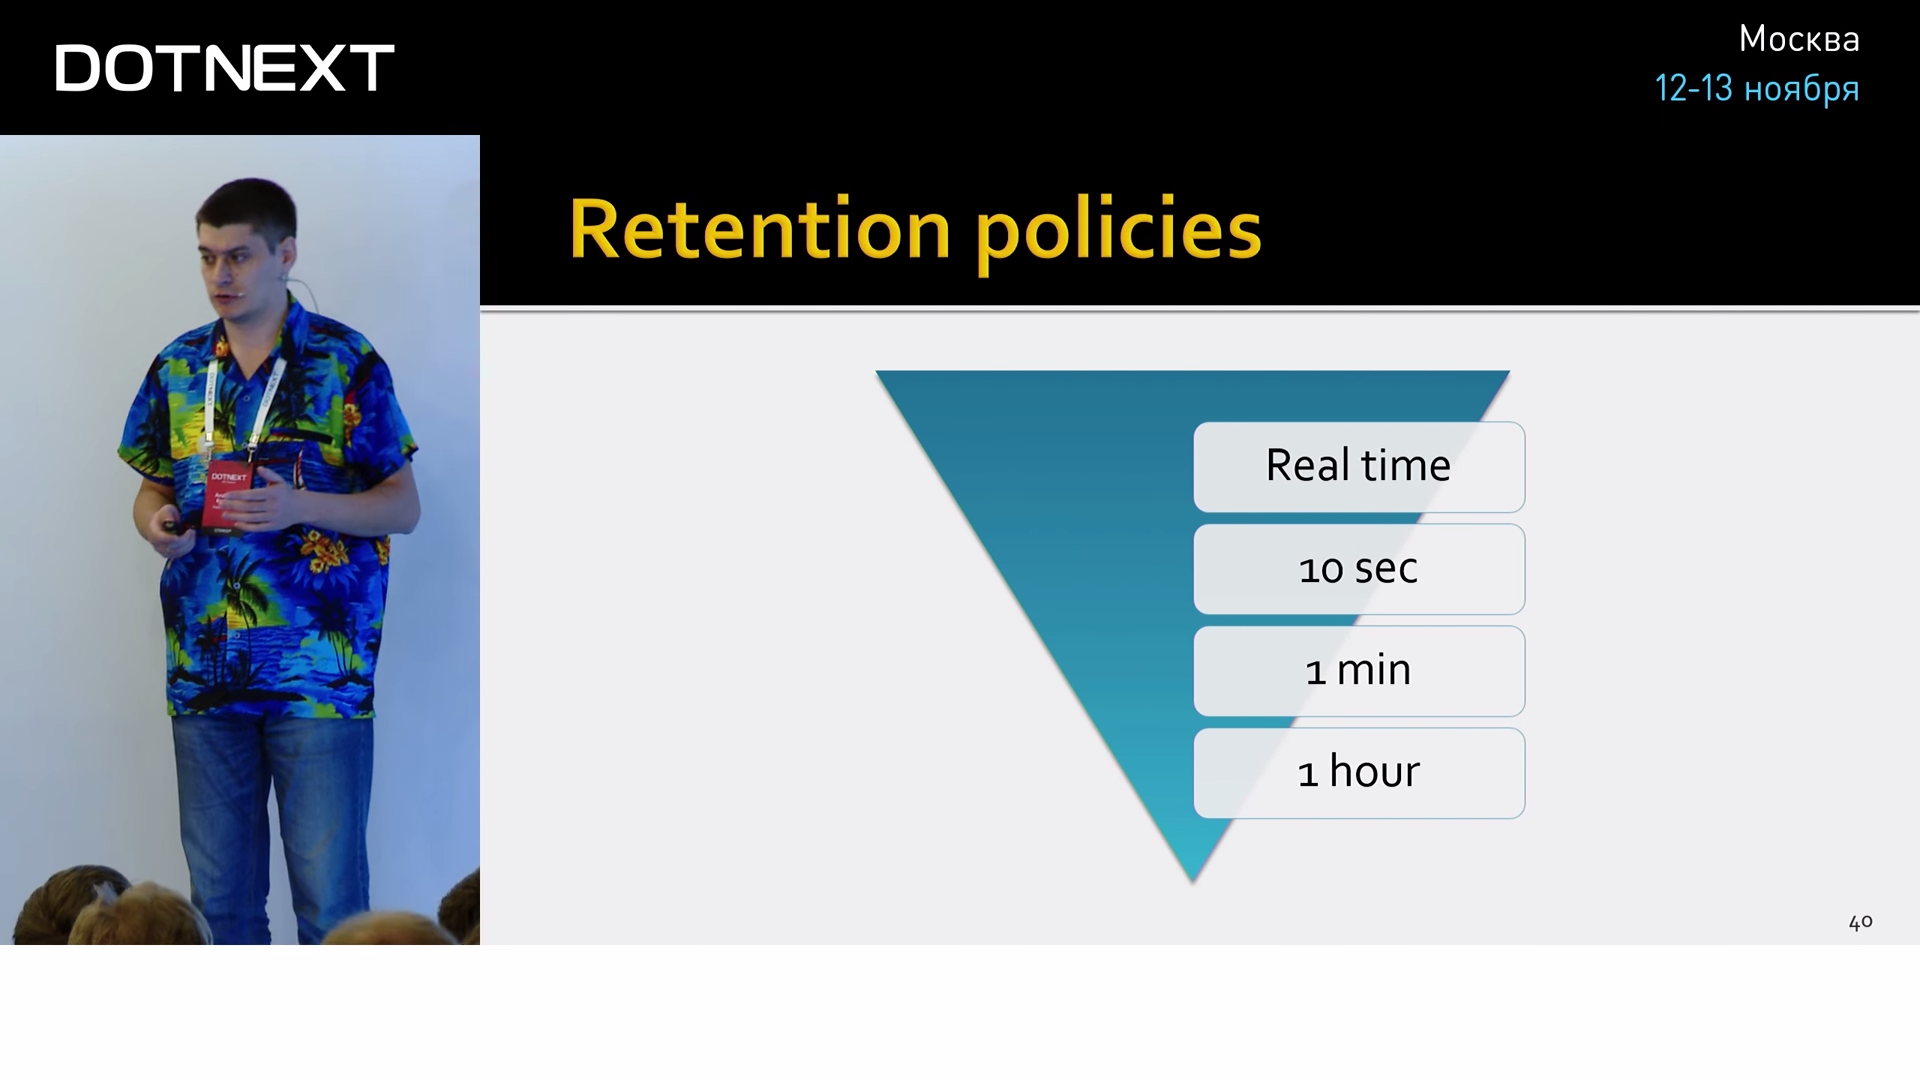
Suppose you want to measure the number of requests coming to your site. You can do it in real time, watch the download of all of this in the charts and react to it somehow. In a day, real-time values for you are redundant, and you can easily aggregate them to ten-second intervals, calculate the aggregates (min, max, count, which ones you are interested in) and save the same data set, only in a much smaller size, therefore, you will use much less space. After a week, you can increase the period to one minute, in a month - up to an hour, and leave this data in the archive, for example, to compare the performance of your application in a year.
: , , : , , , , Influx . — , , . - , , :
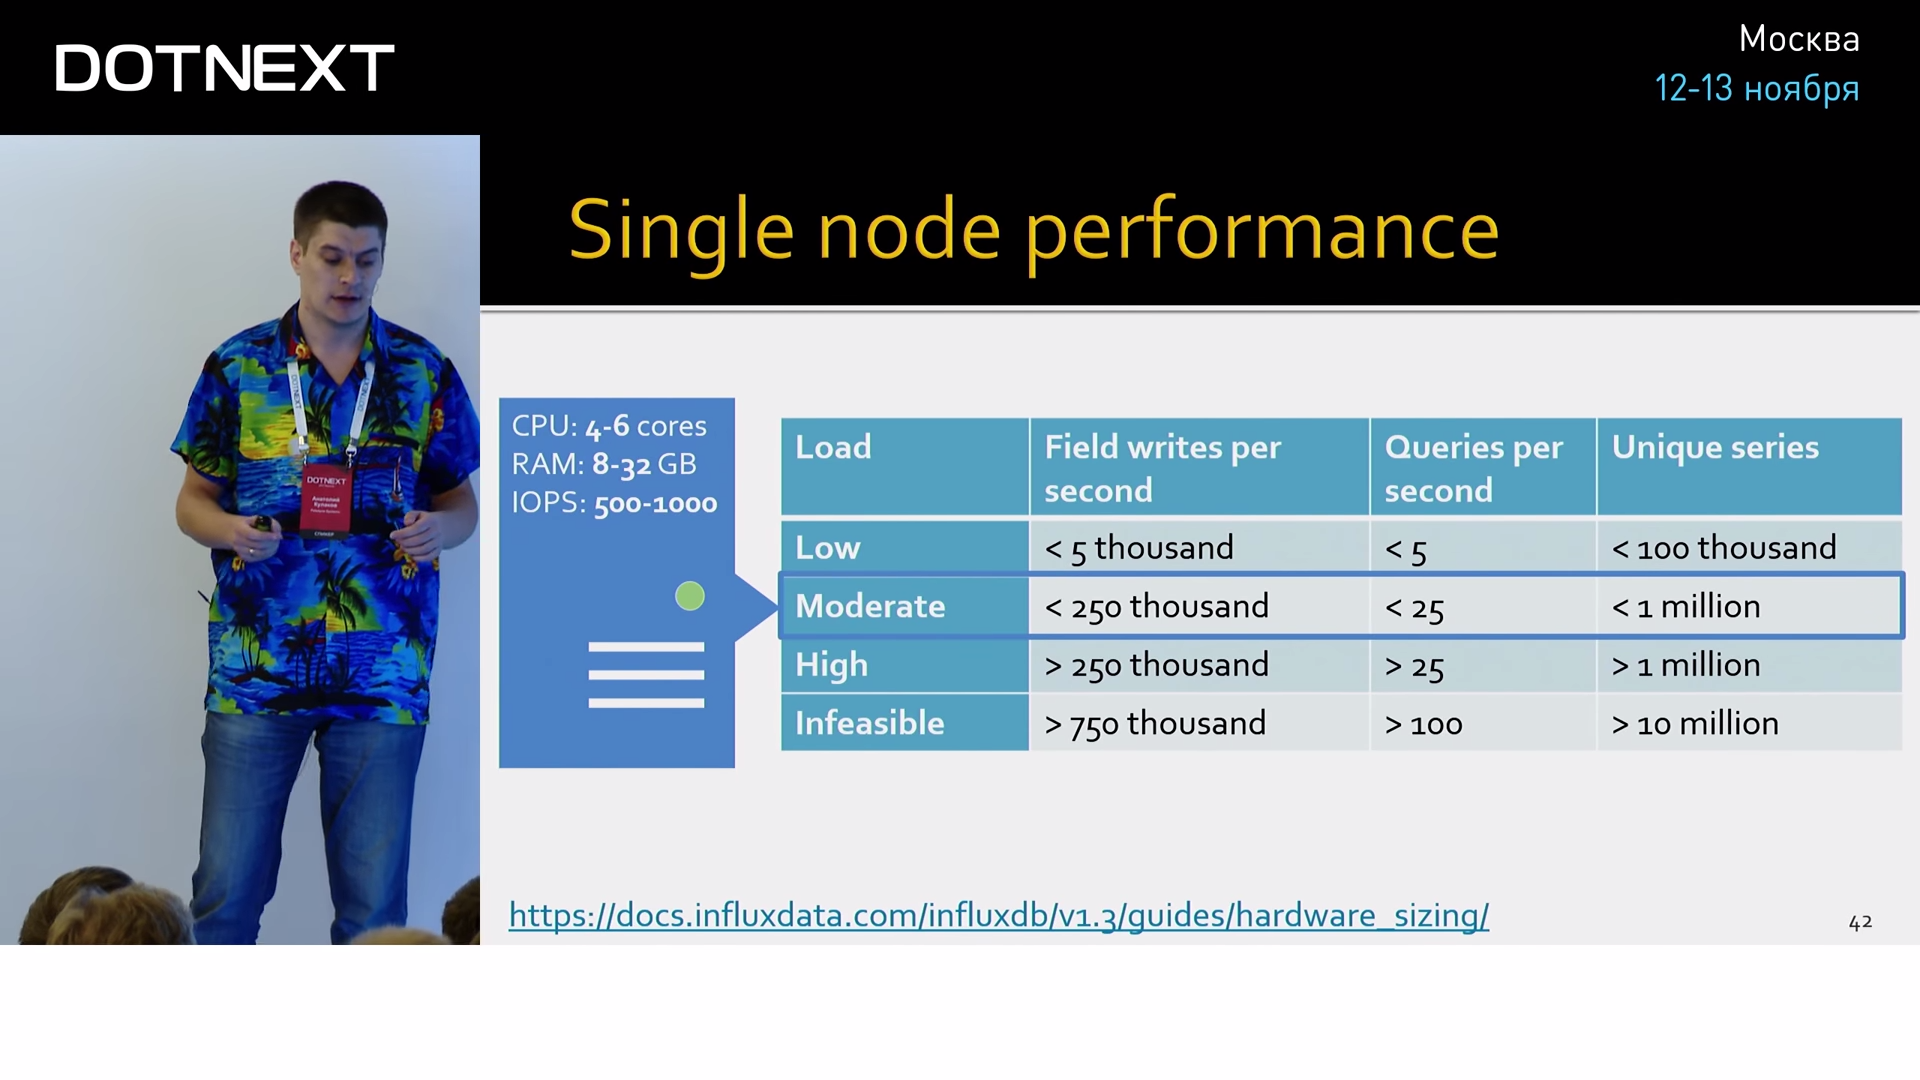
250 , 32 . . , . Influx- , , .
time series ? , :
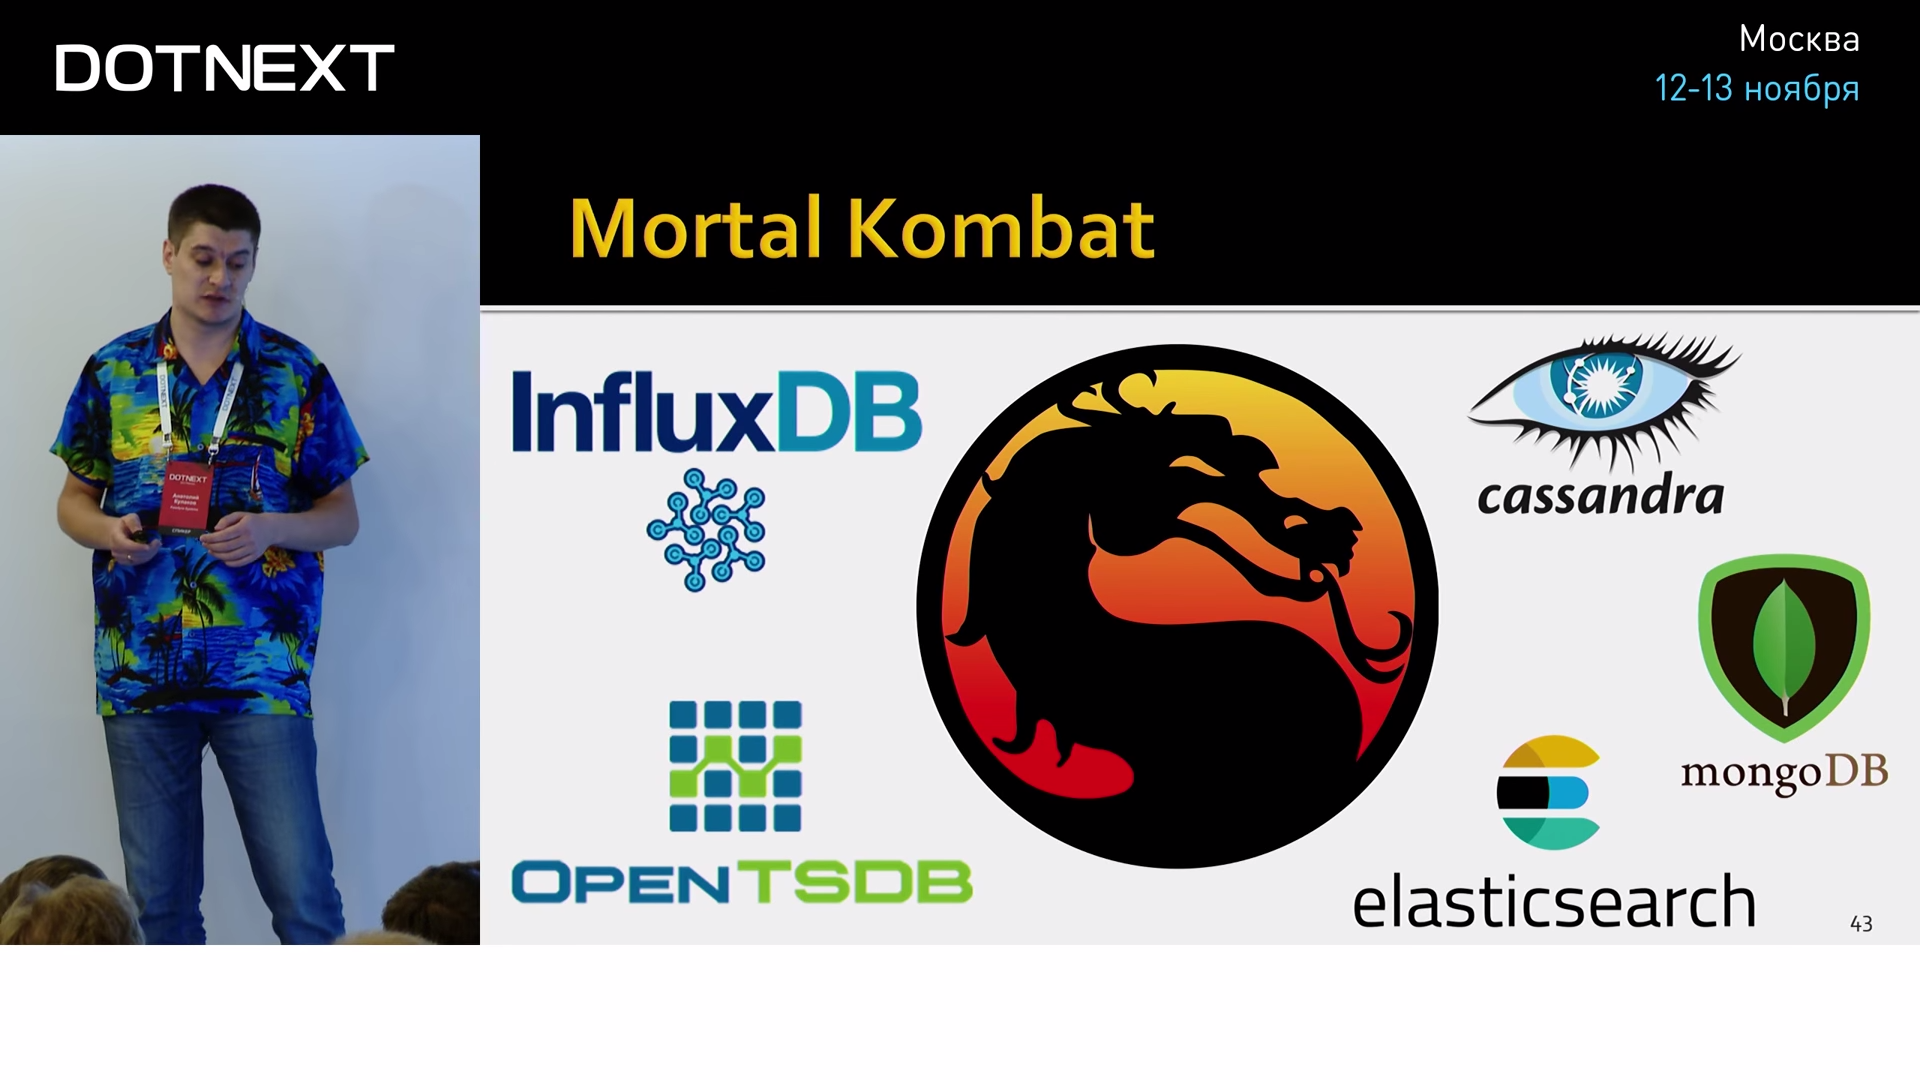
TSDB — InfluxDB OpenTSDB. OpenTSDB — TSDB, .
— .
, , , , , . , , . , , .
elastic (, ), .
, . Influx 5 27 :

9 84 , :

MongoDB, 168 Cassandra.

.
, Influx . , . , App Metrics, , WebAPI-, Grafana. , :

, Owin-, , , , , App Metrics:
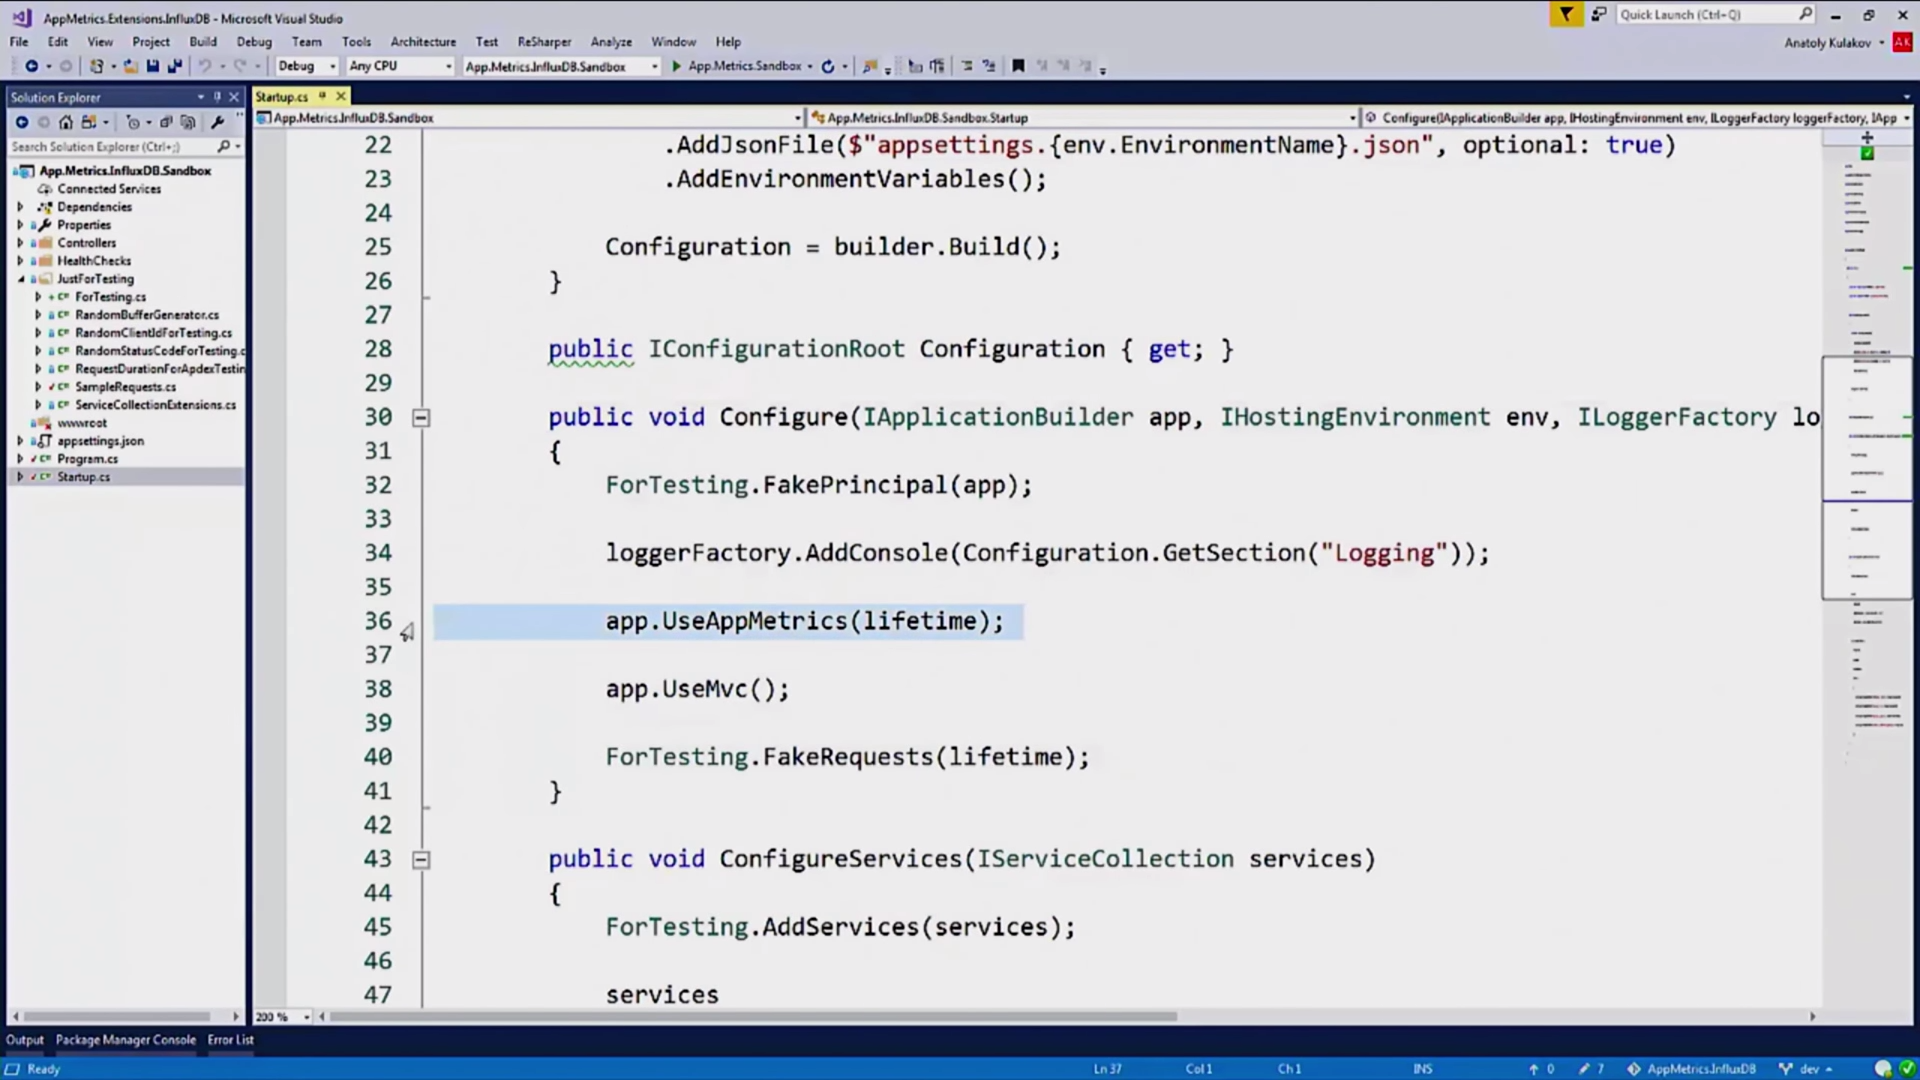
, , InfluxDB :
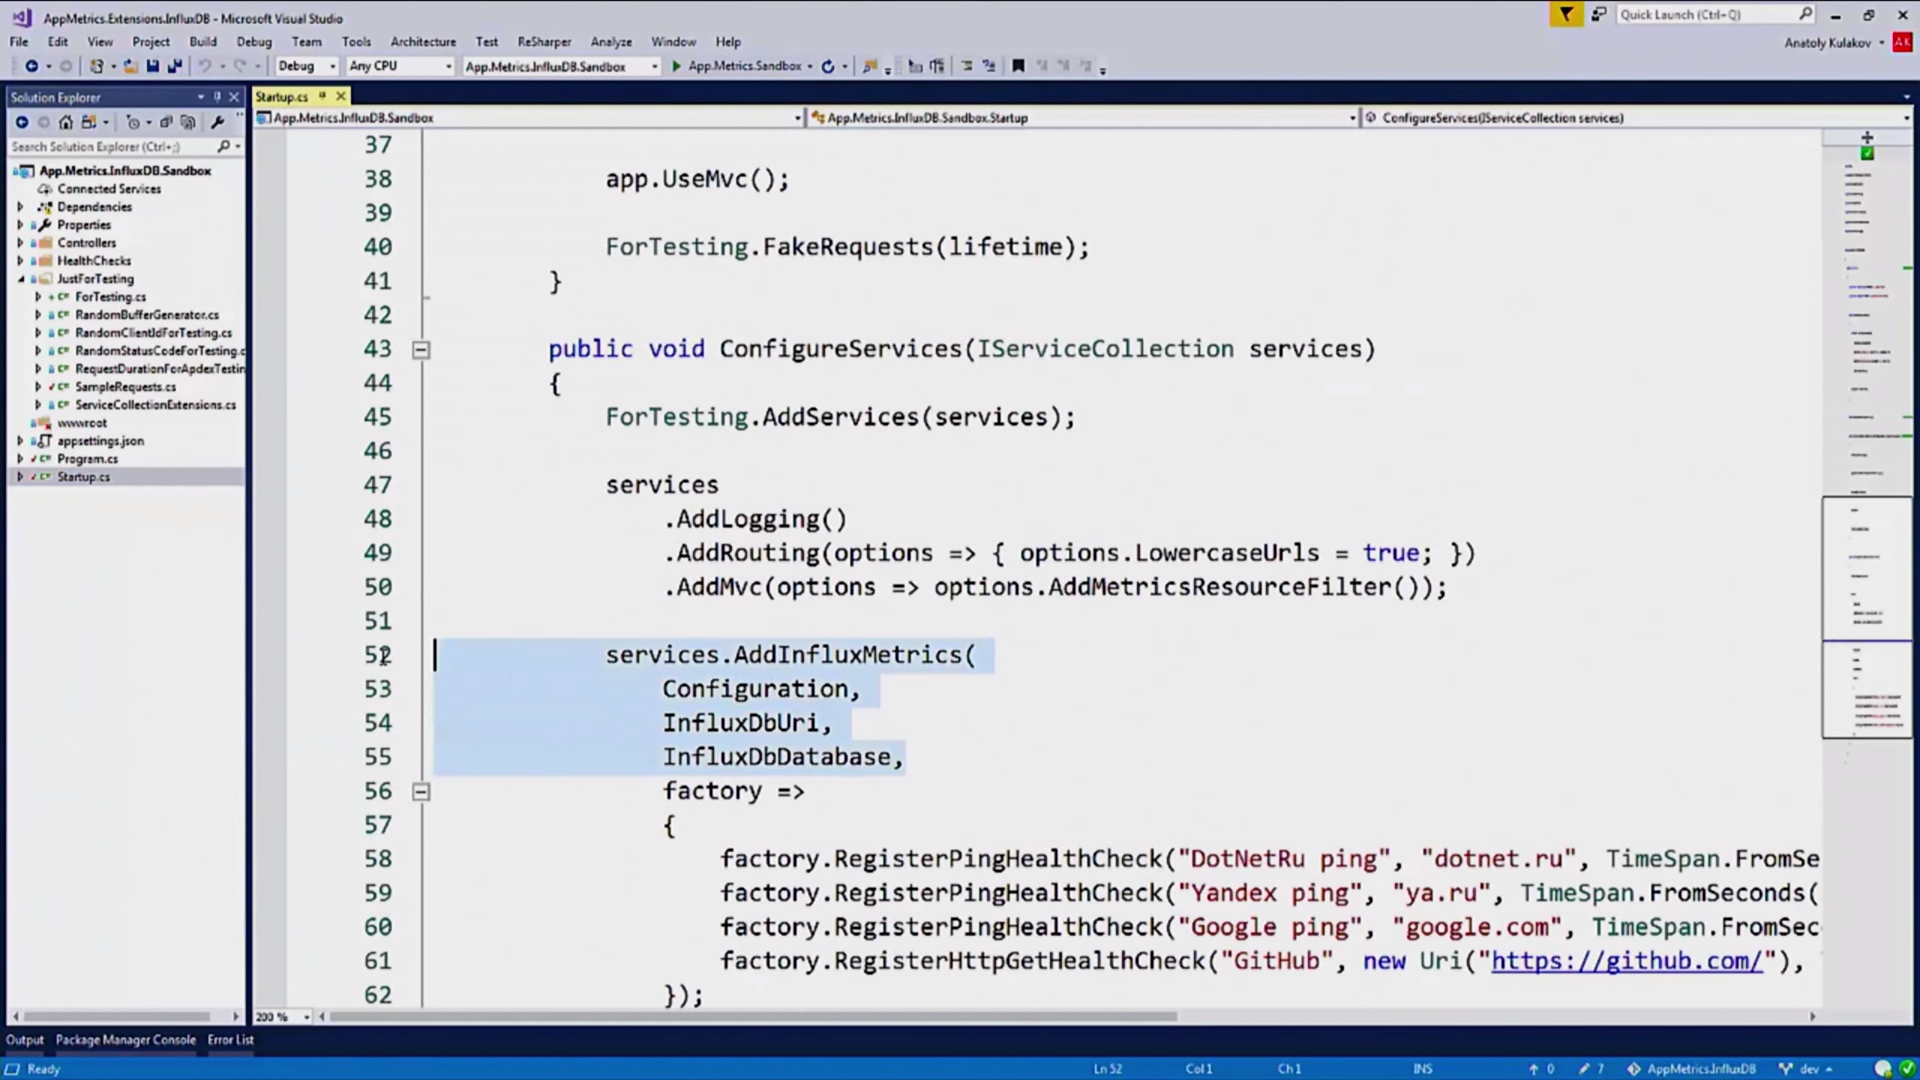
, HealthChecks:
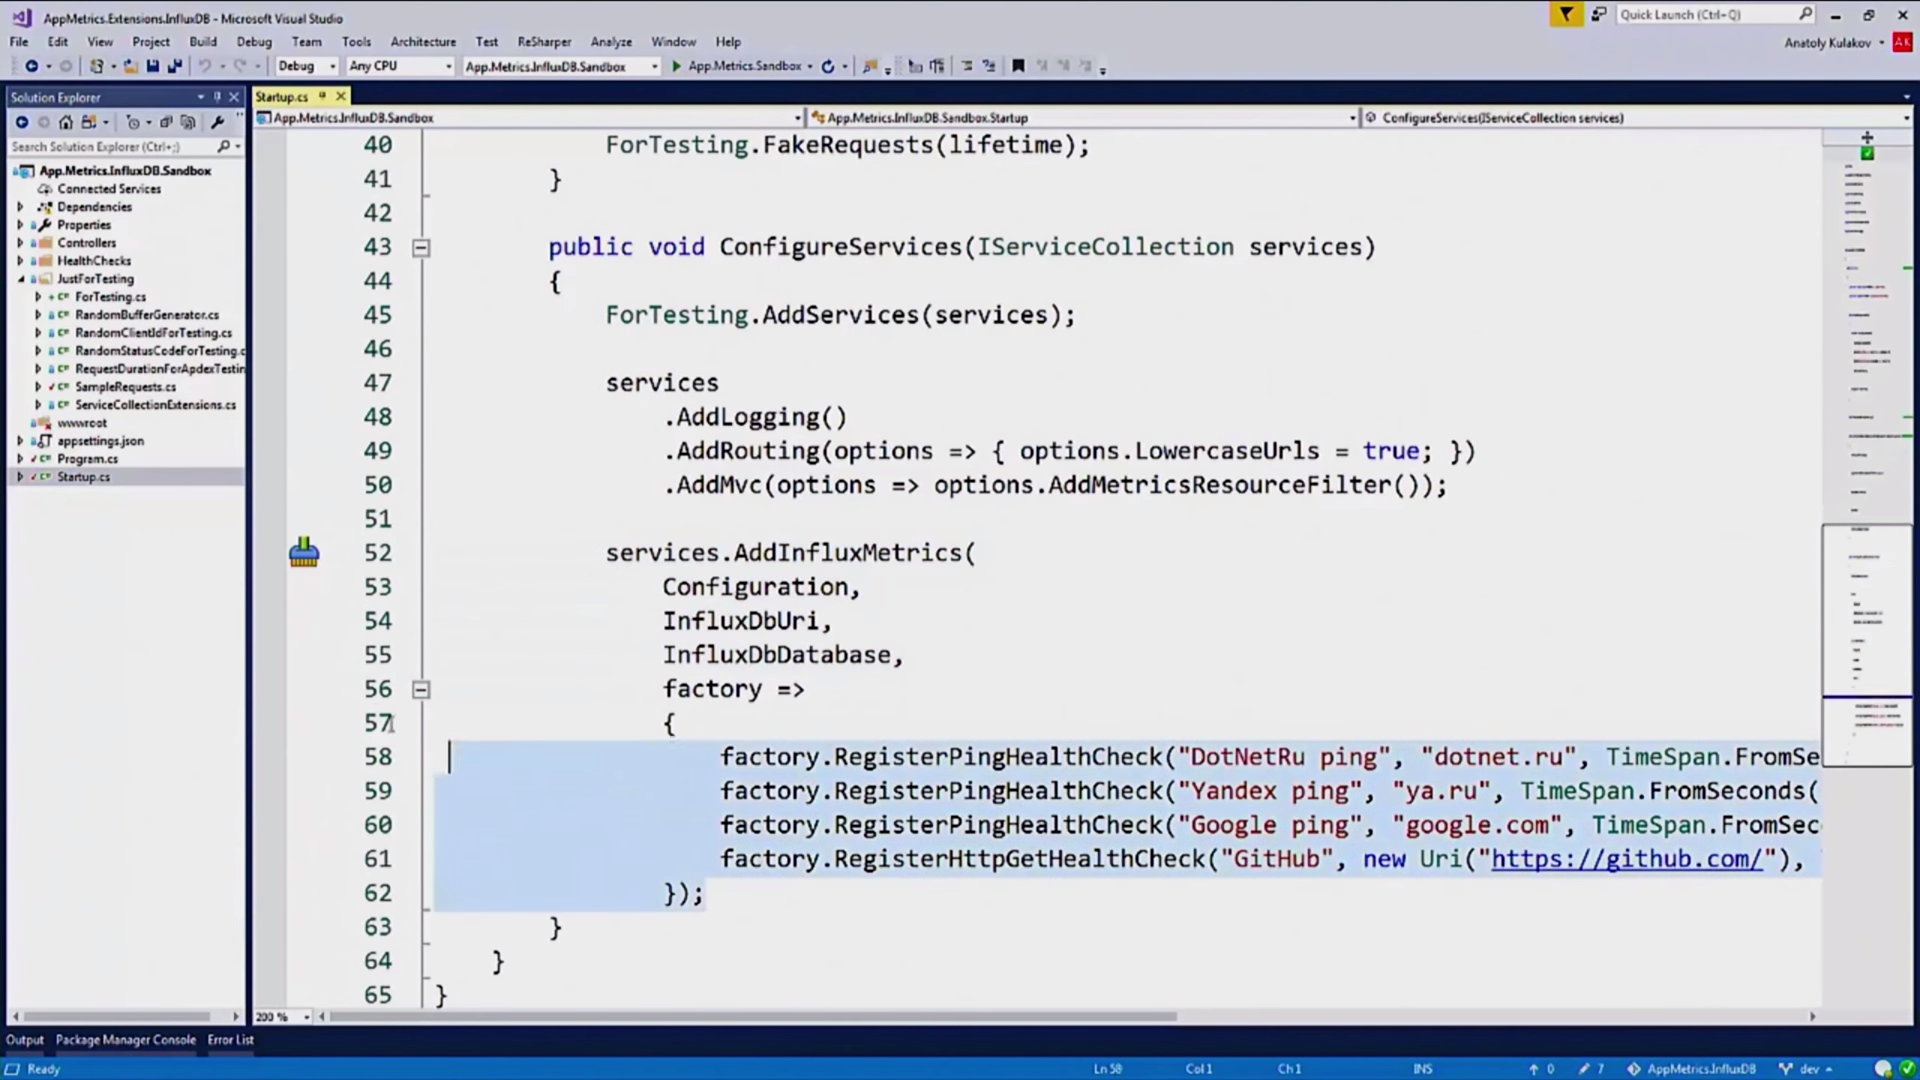
HealthChecks — «» , . , .
, , , - :
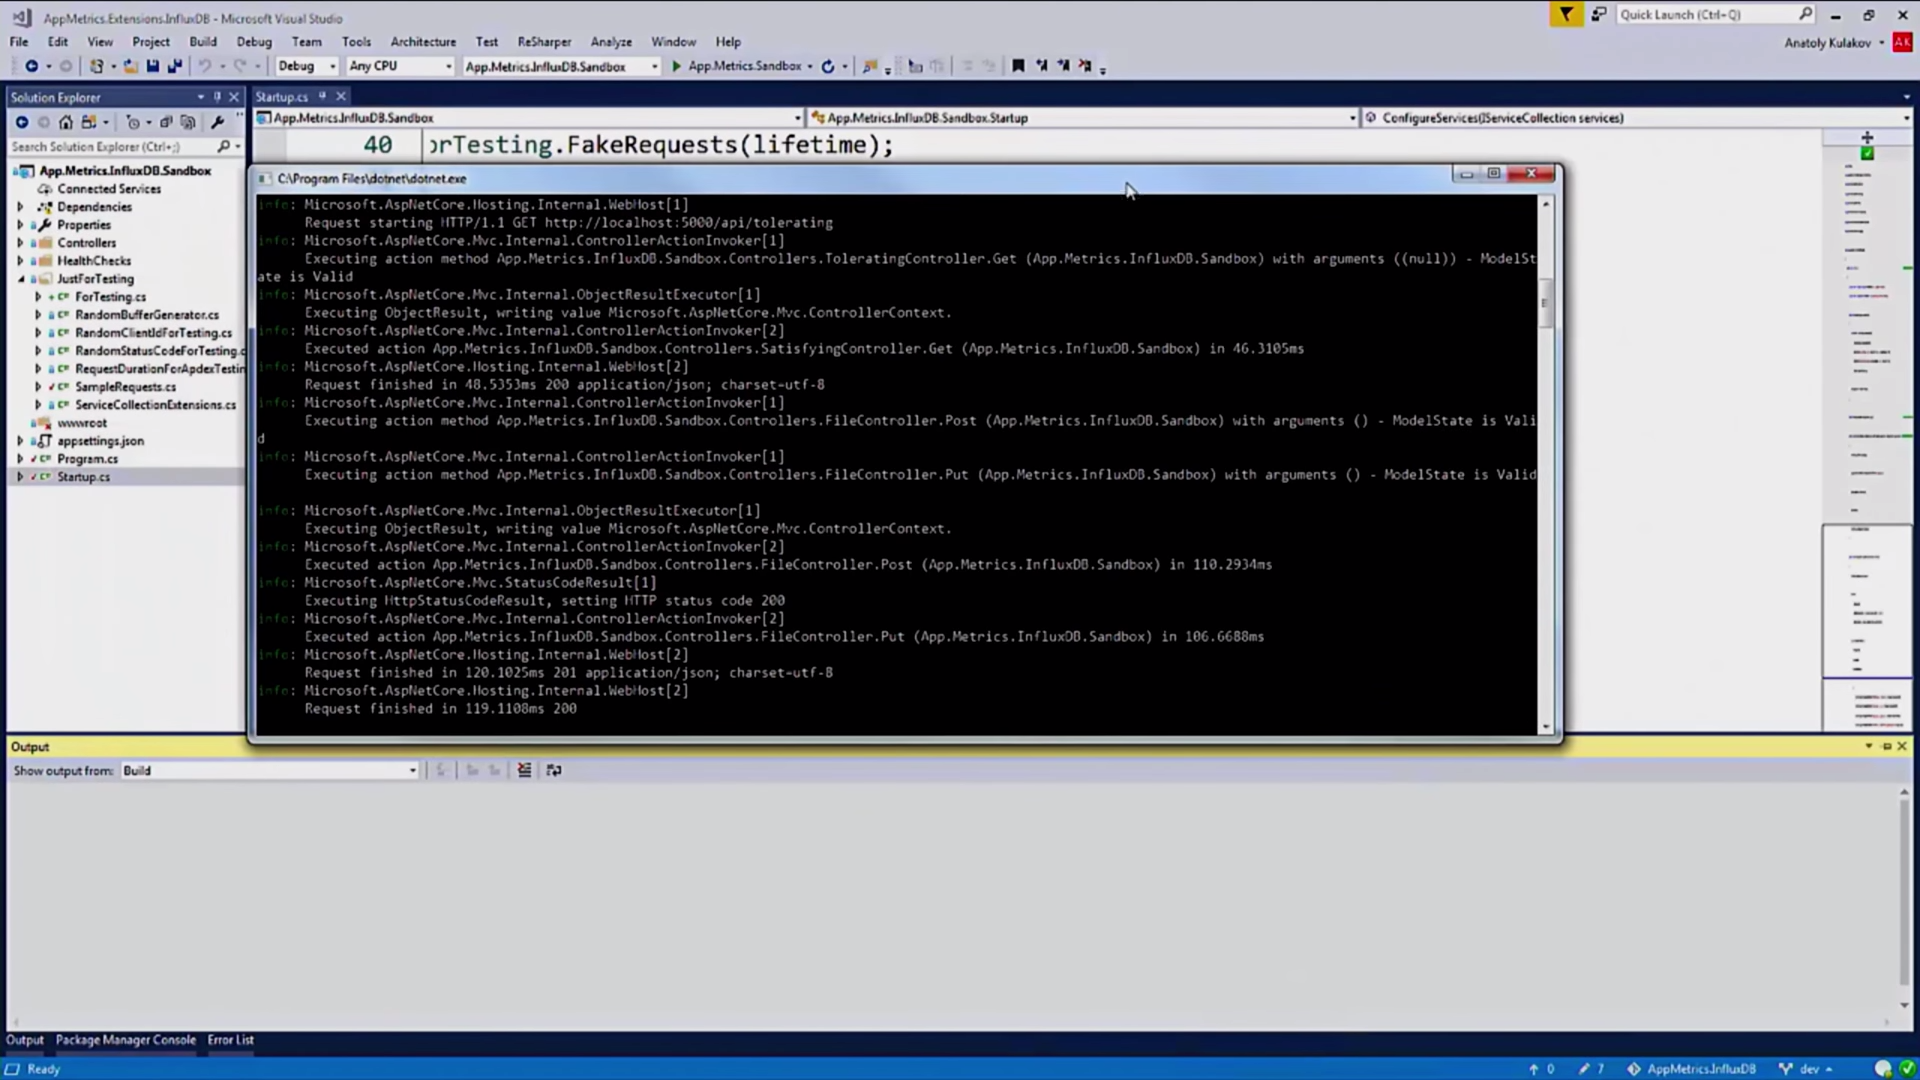
AppMetrics , , , , .
.

, , , , API-:

, , , , , , . , , — . , , HealthCheckers:
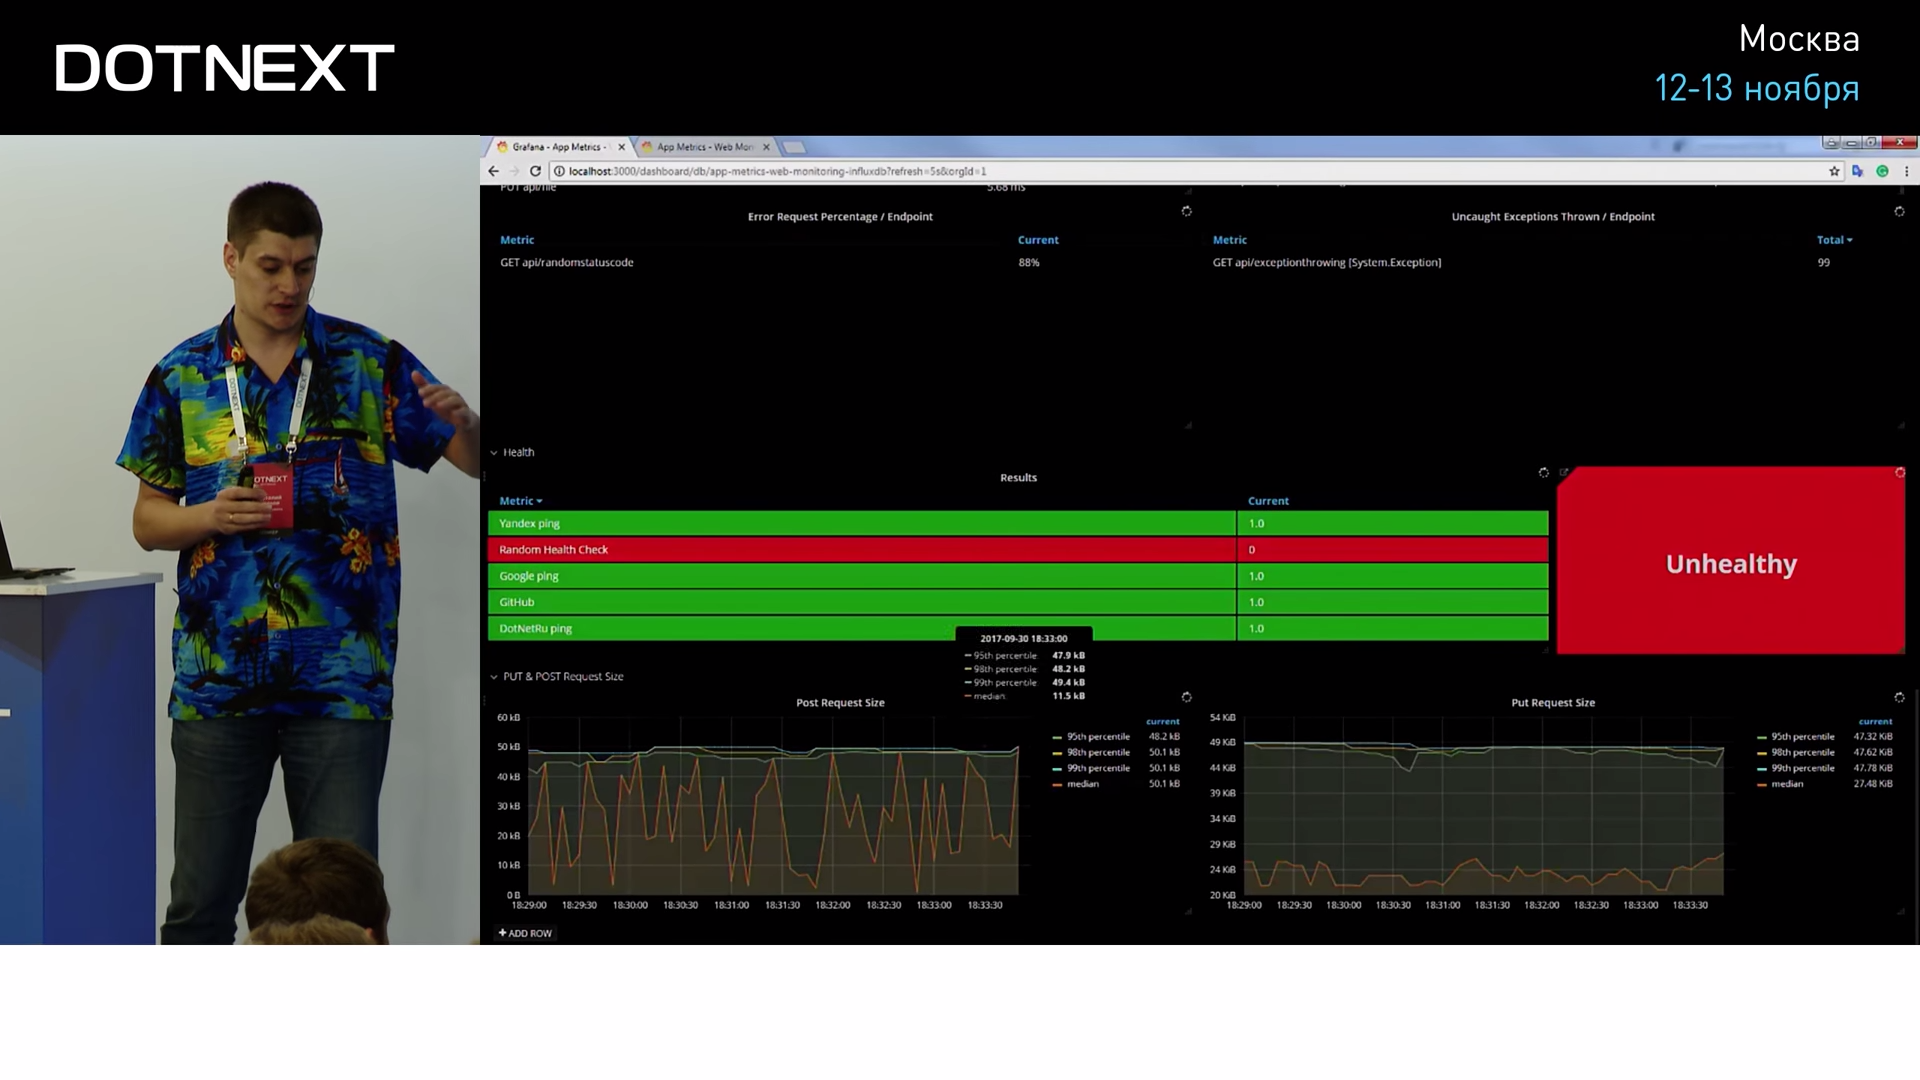
, , — .
, , , , . , ? :
- -, Telegraf , . .
- App Metrics , . Web API, .
- . . , , , body. , , .
- , .
- , , -.
, , -, , . , . , Influx Grafana.
, BenchmarkDotNet. , -: . , , . , , , -, Influx. , , Grafana , , , , .
? , . , influx.exe:
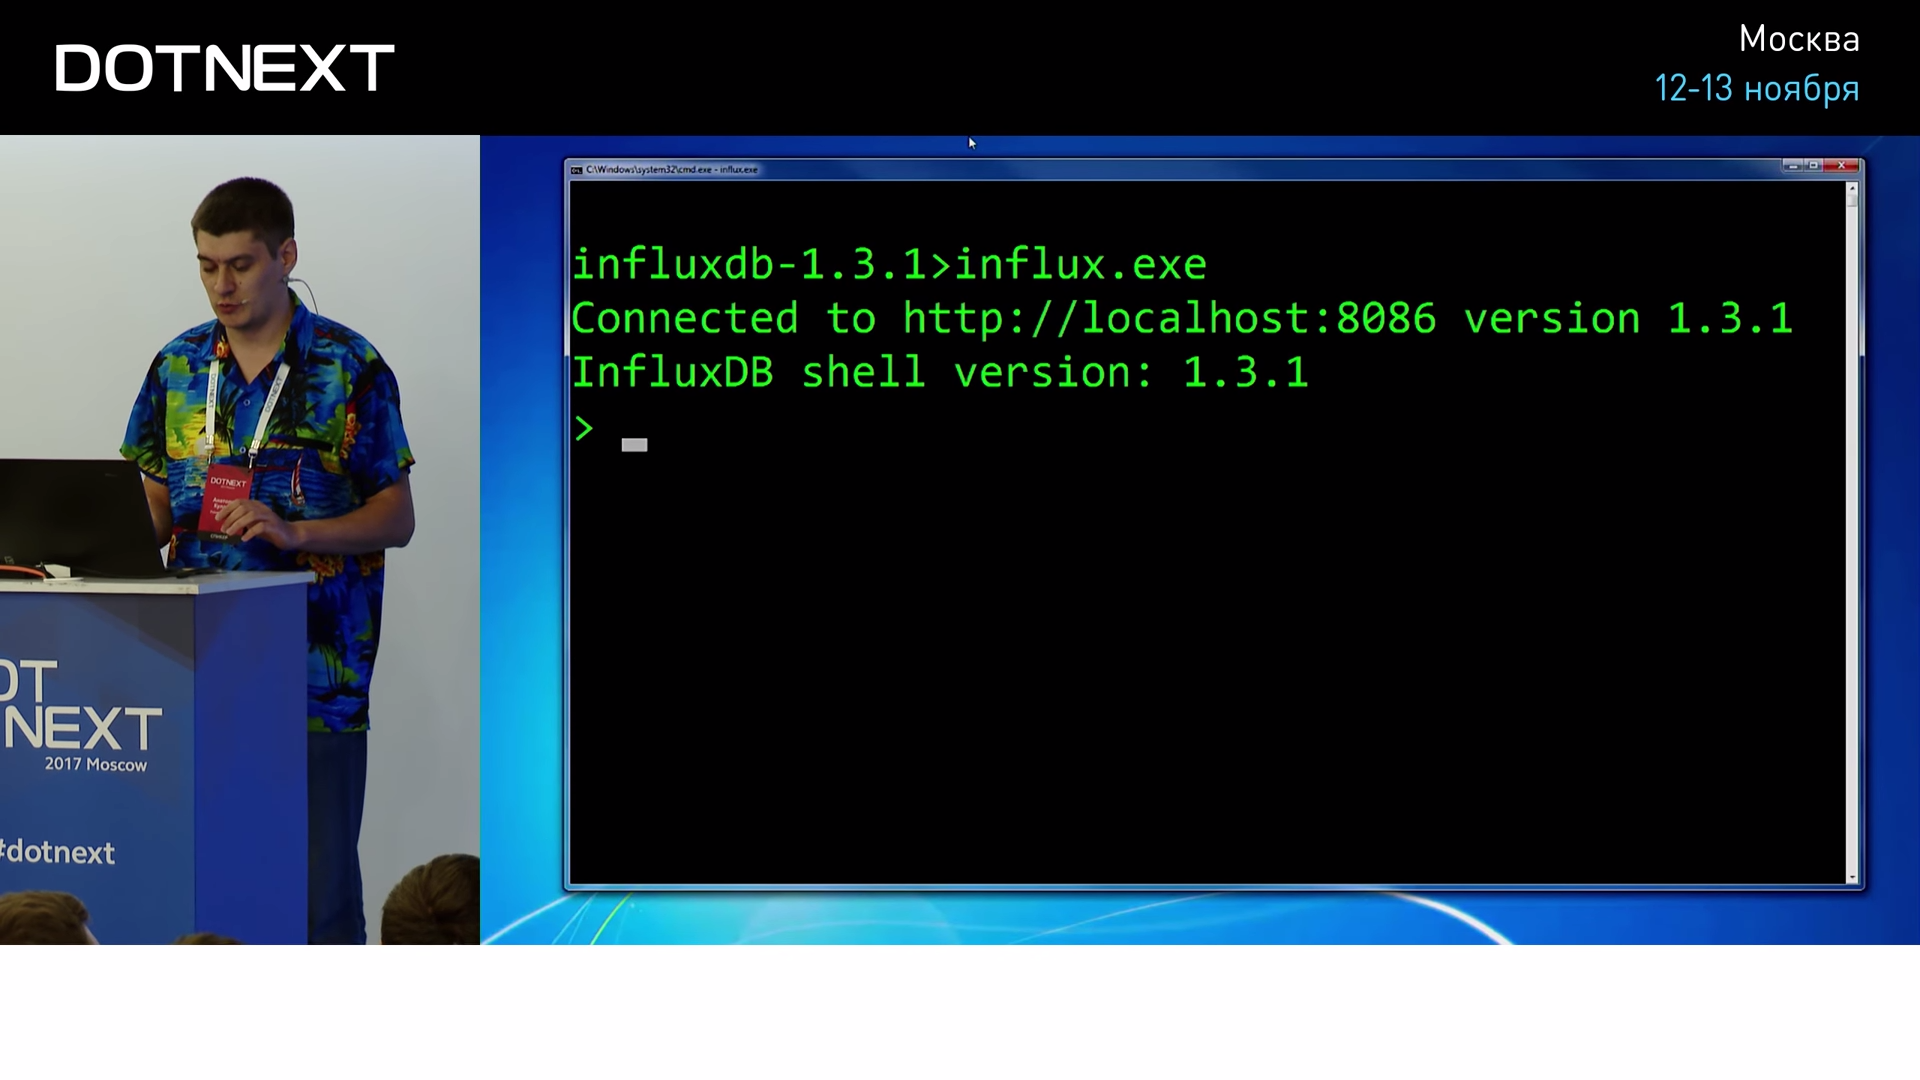
Influx . , benchmarks, .
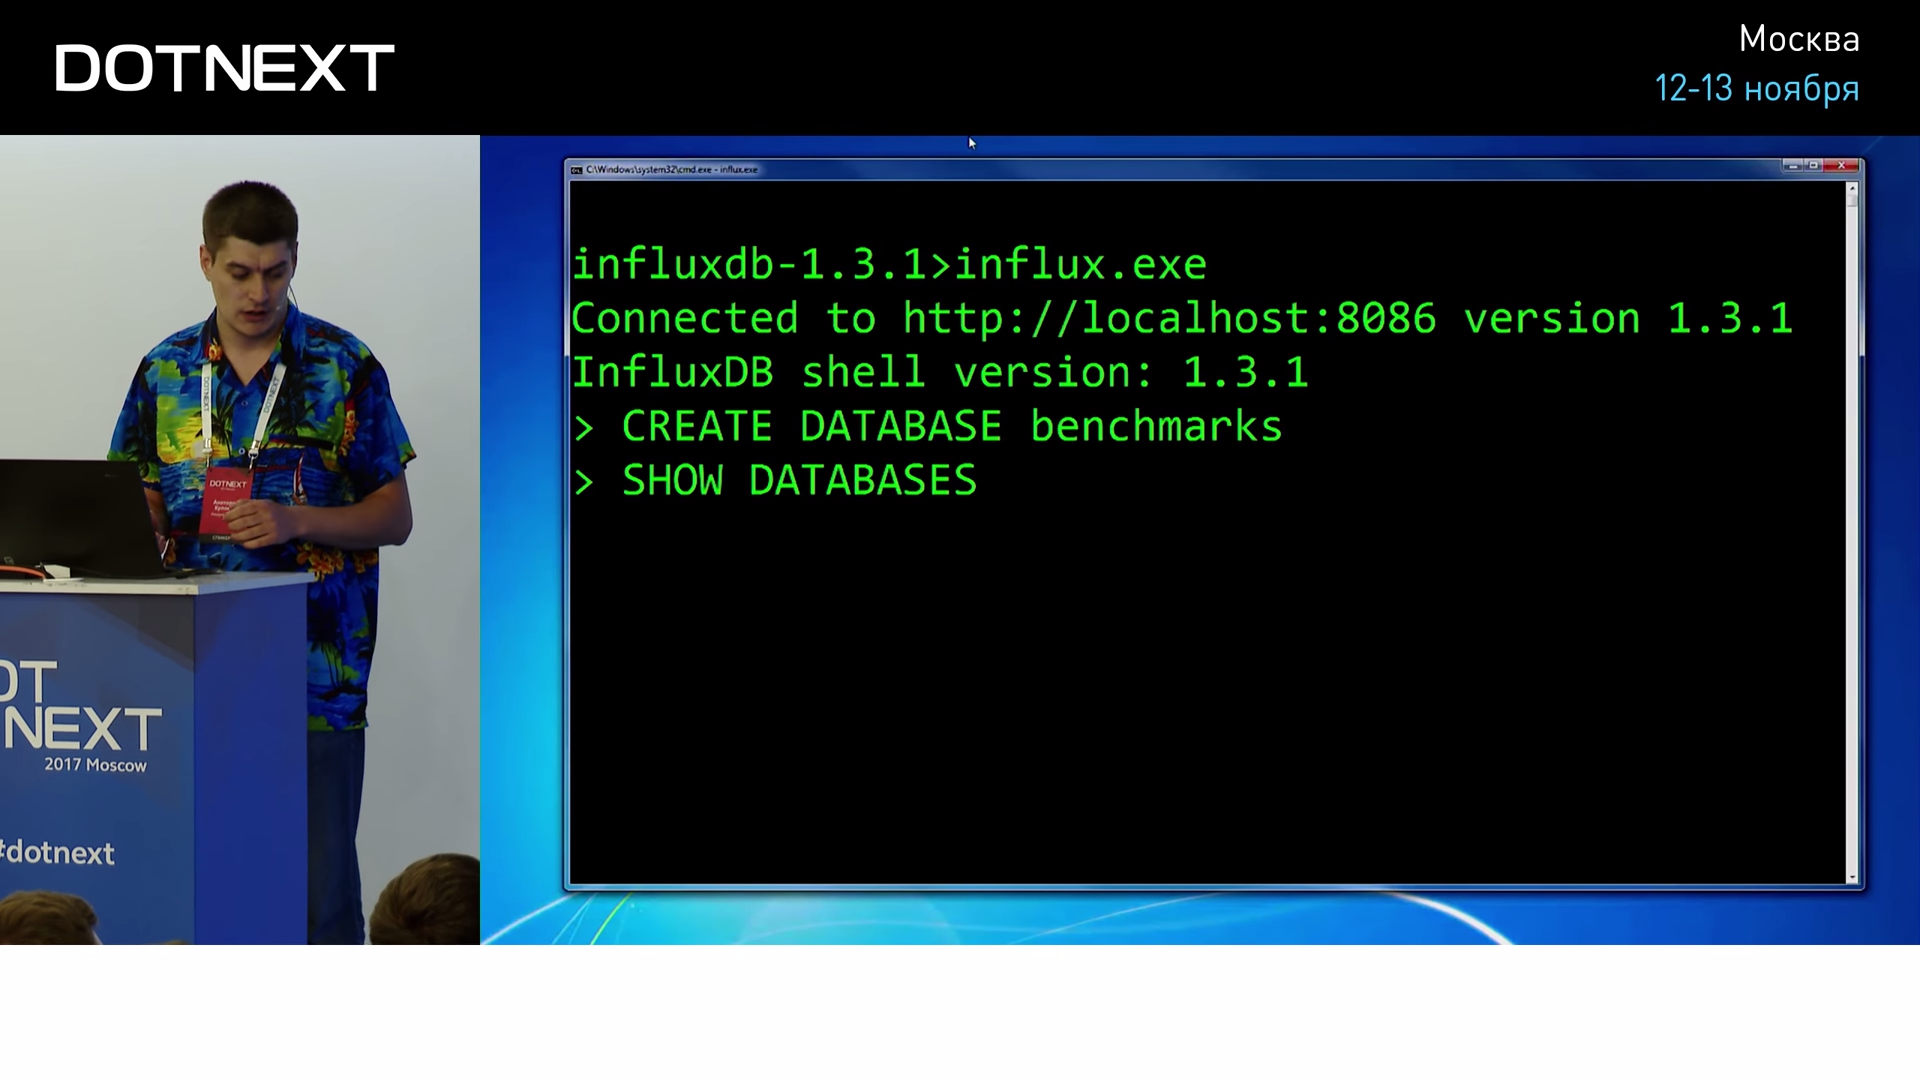
: , , .
:

:

BenchmarkDotNet, . , — InfluxExporter, :
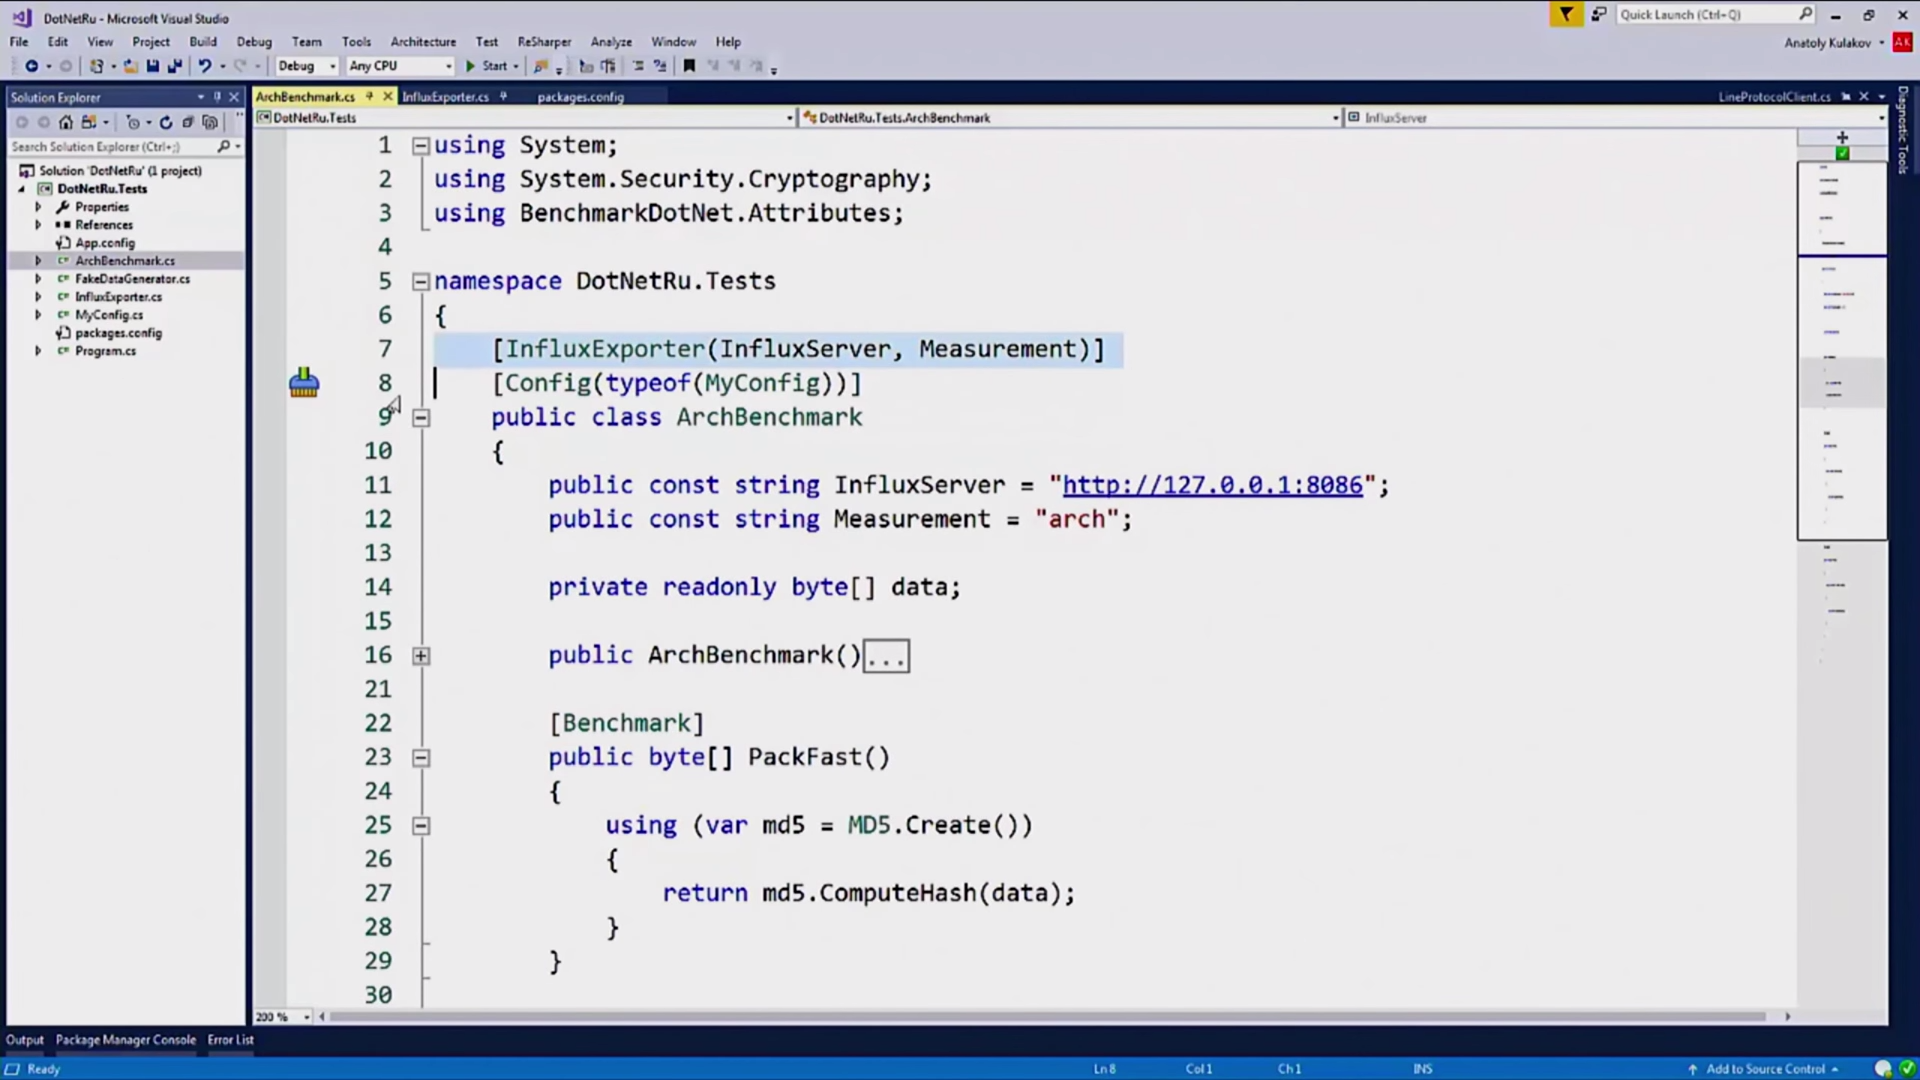
. :

IExporter, BenchmarkDotNet, , .
MetricsCollector:
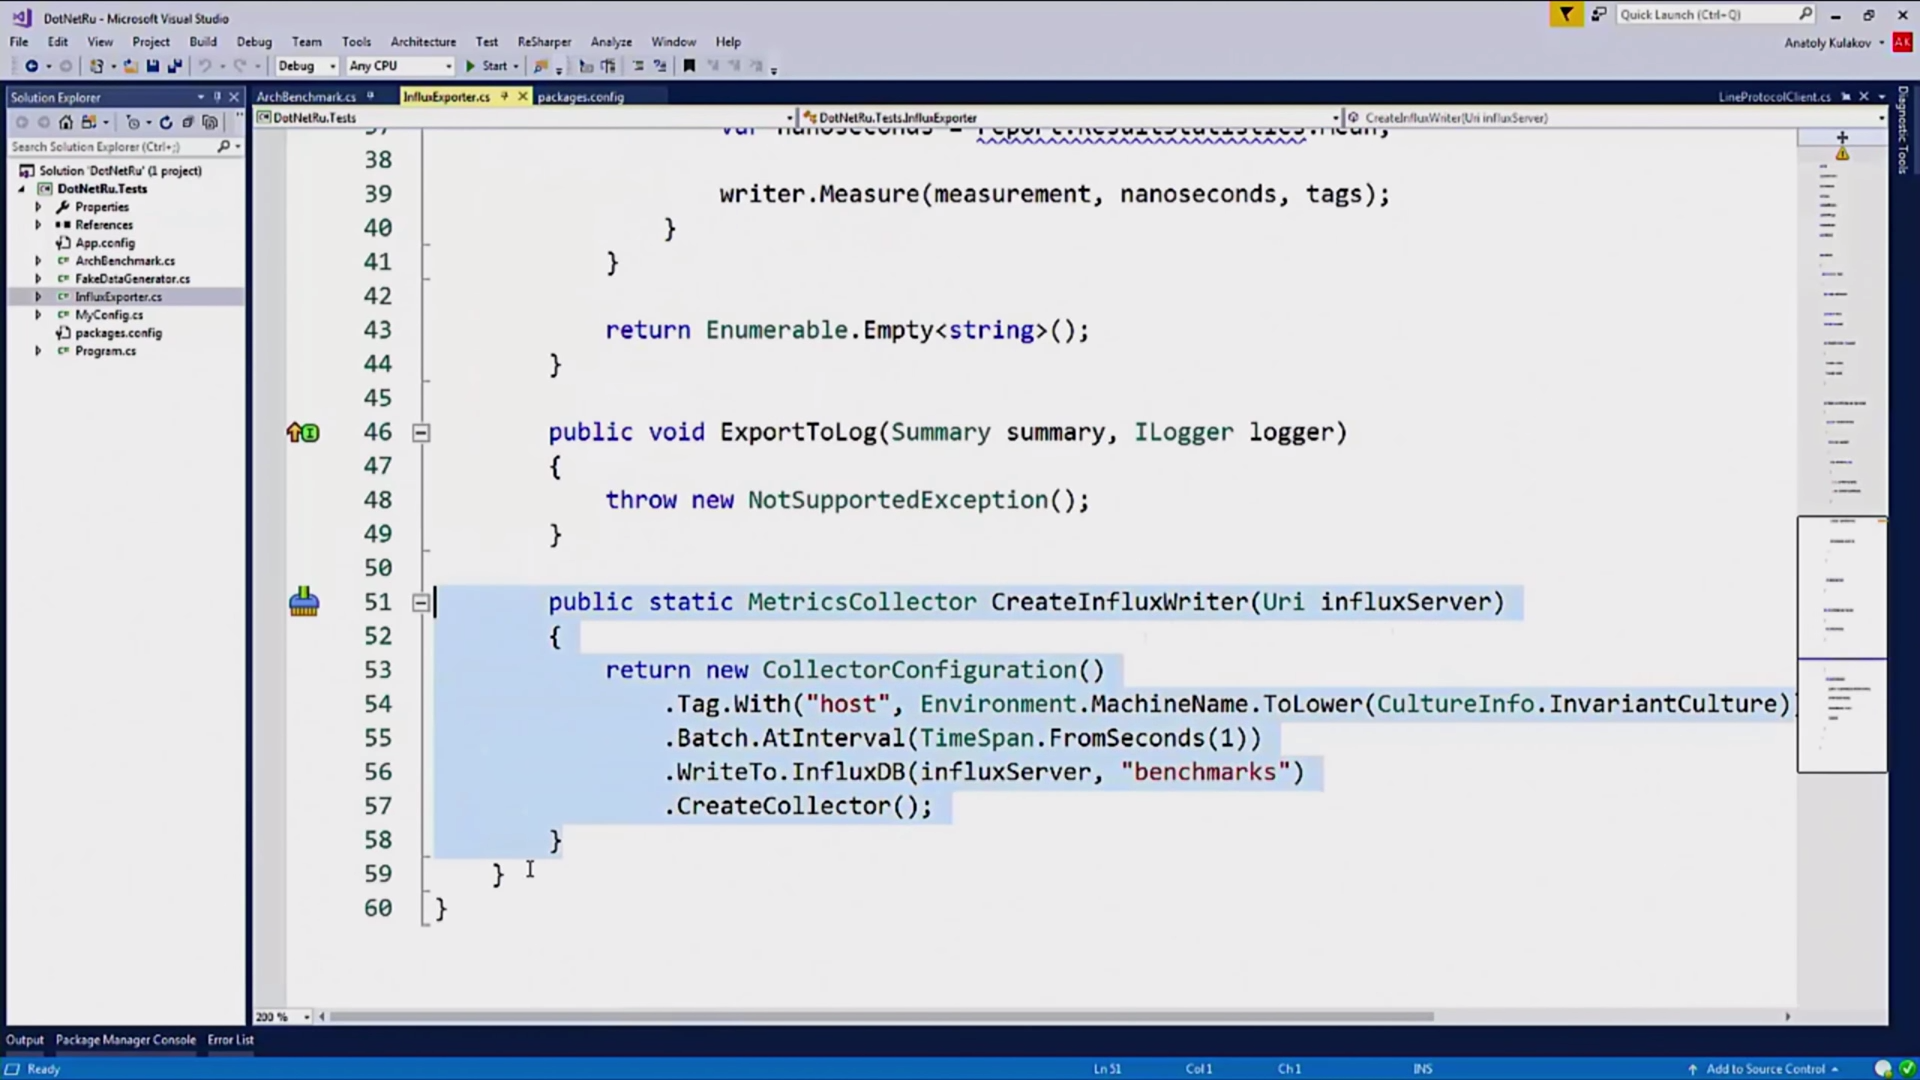
, InfluxDBCollector. , .

. , , real time.
, , :
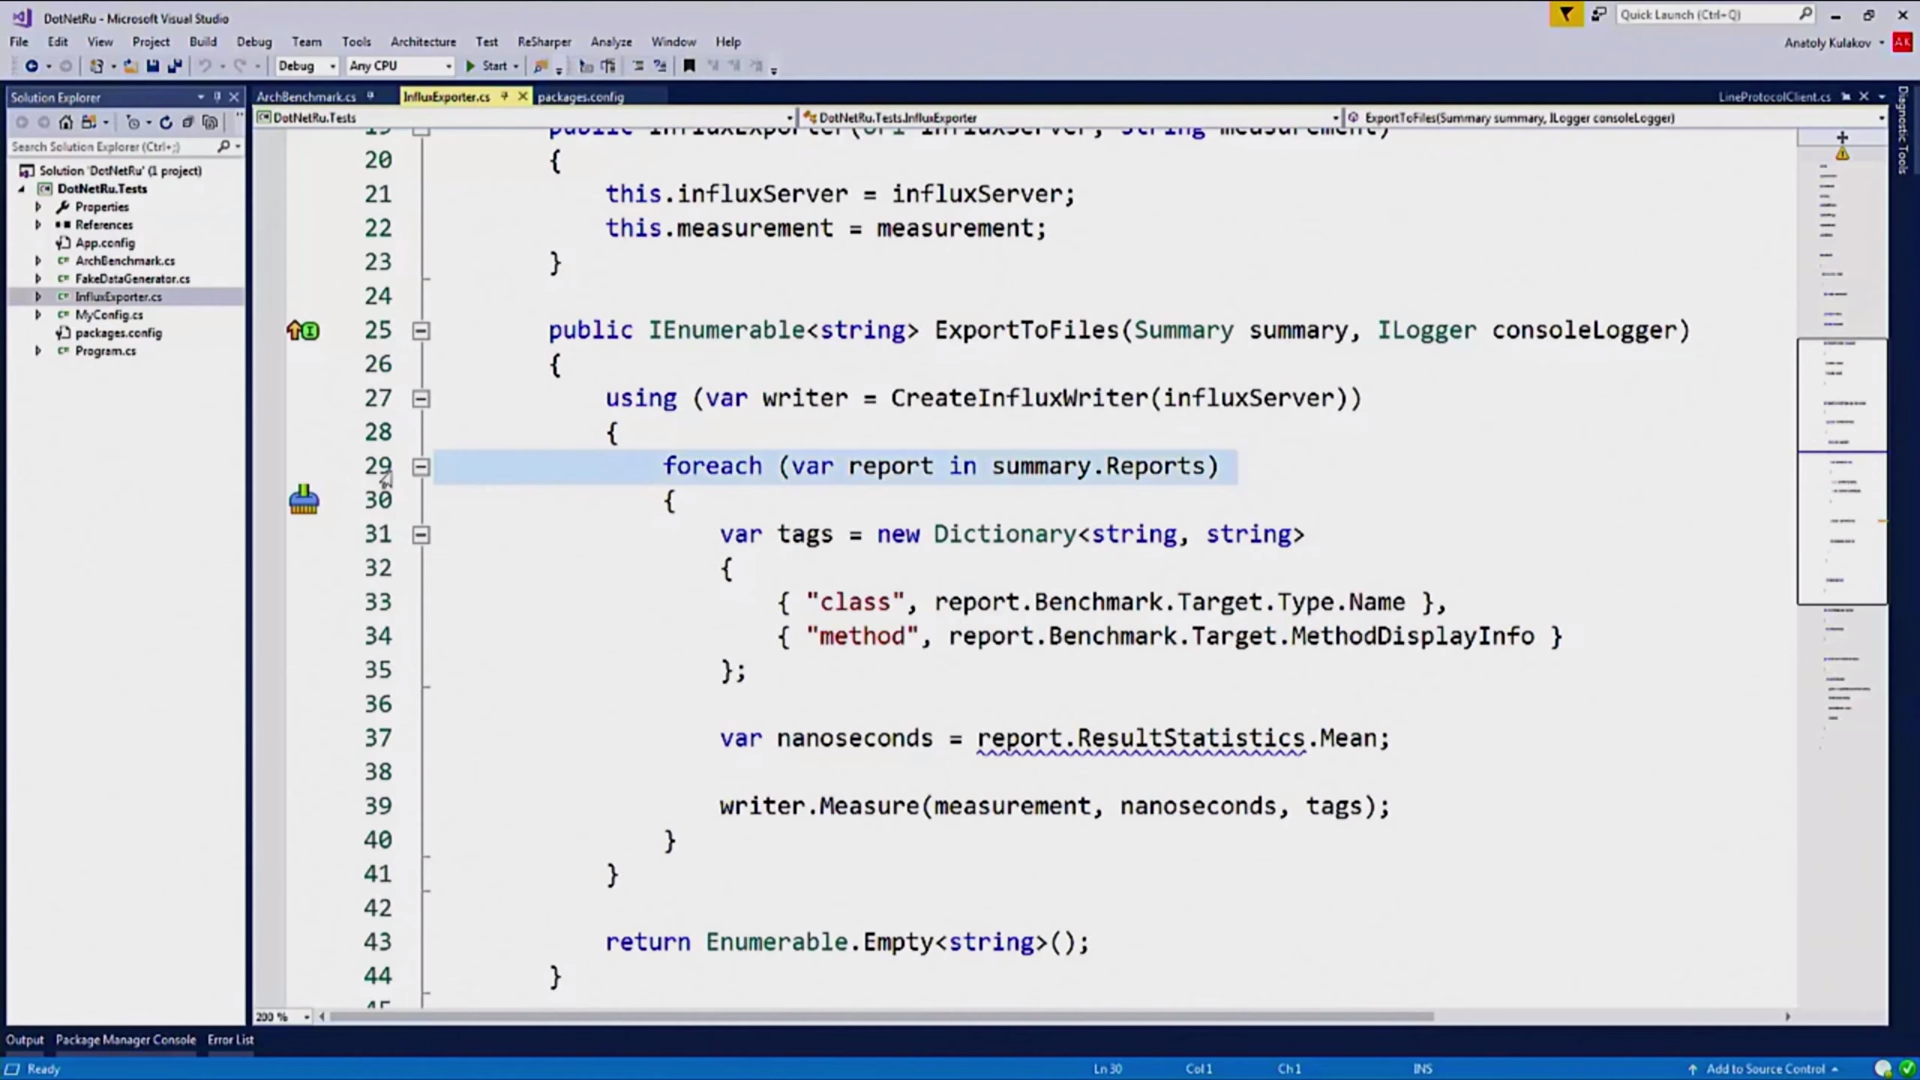
.
InfluxDB LineProtocol, :
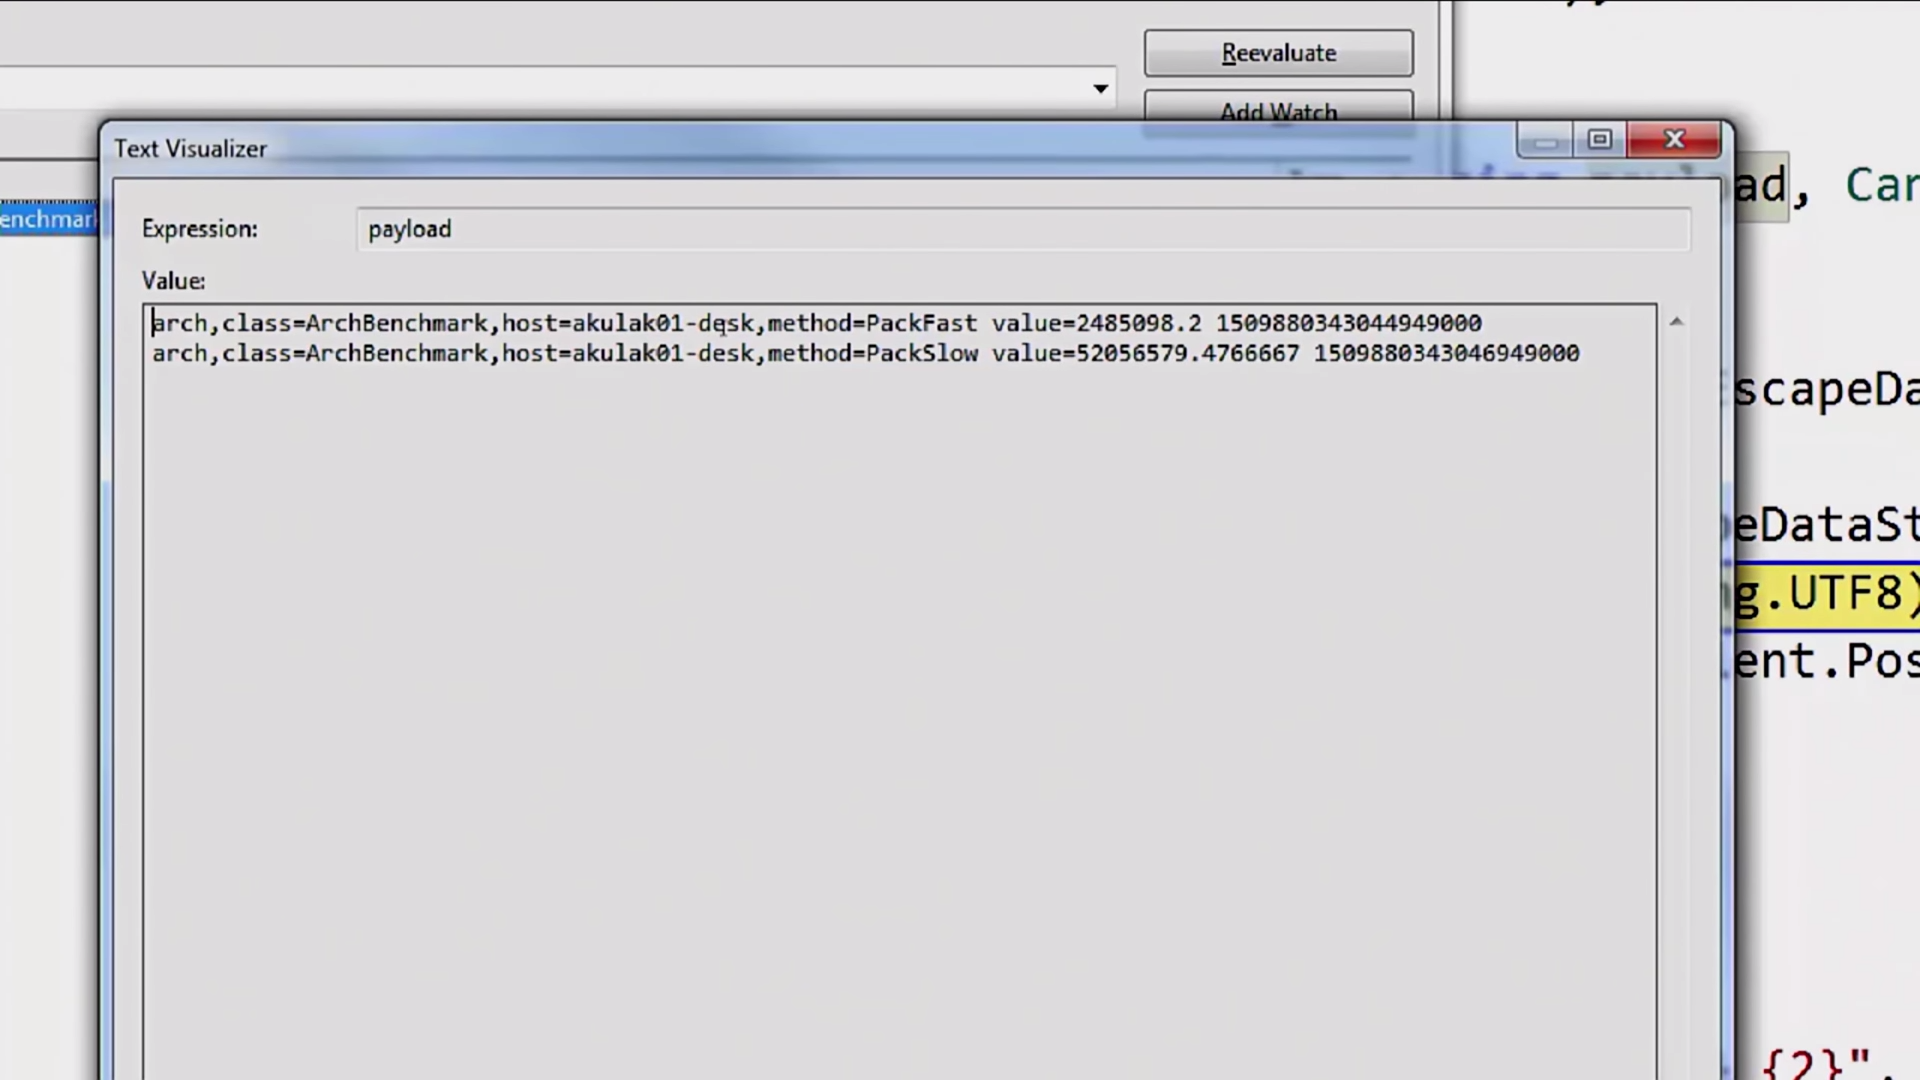
, .
Grafana. , Data Source.
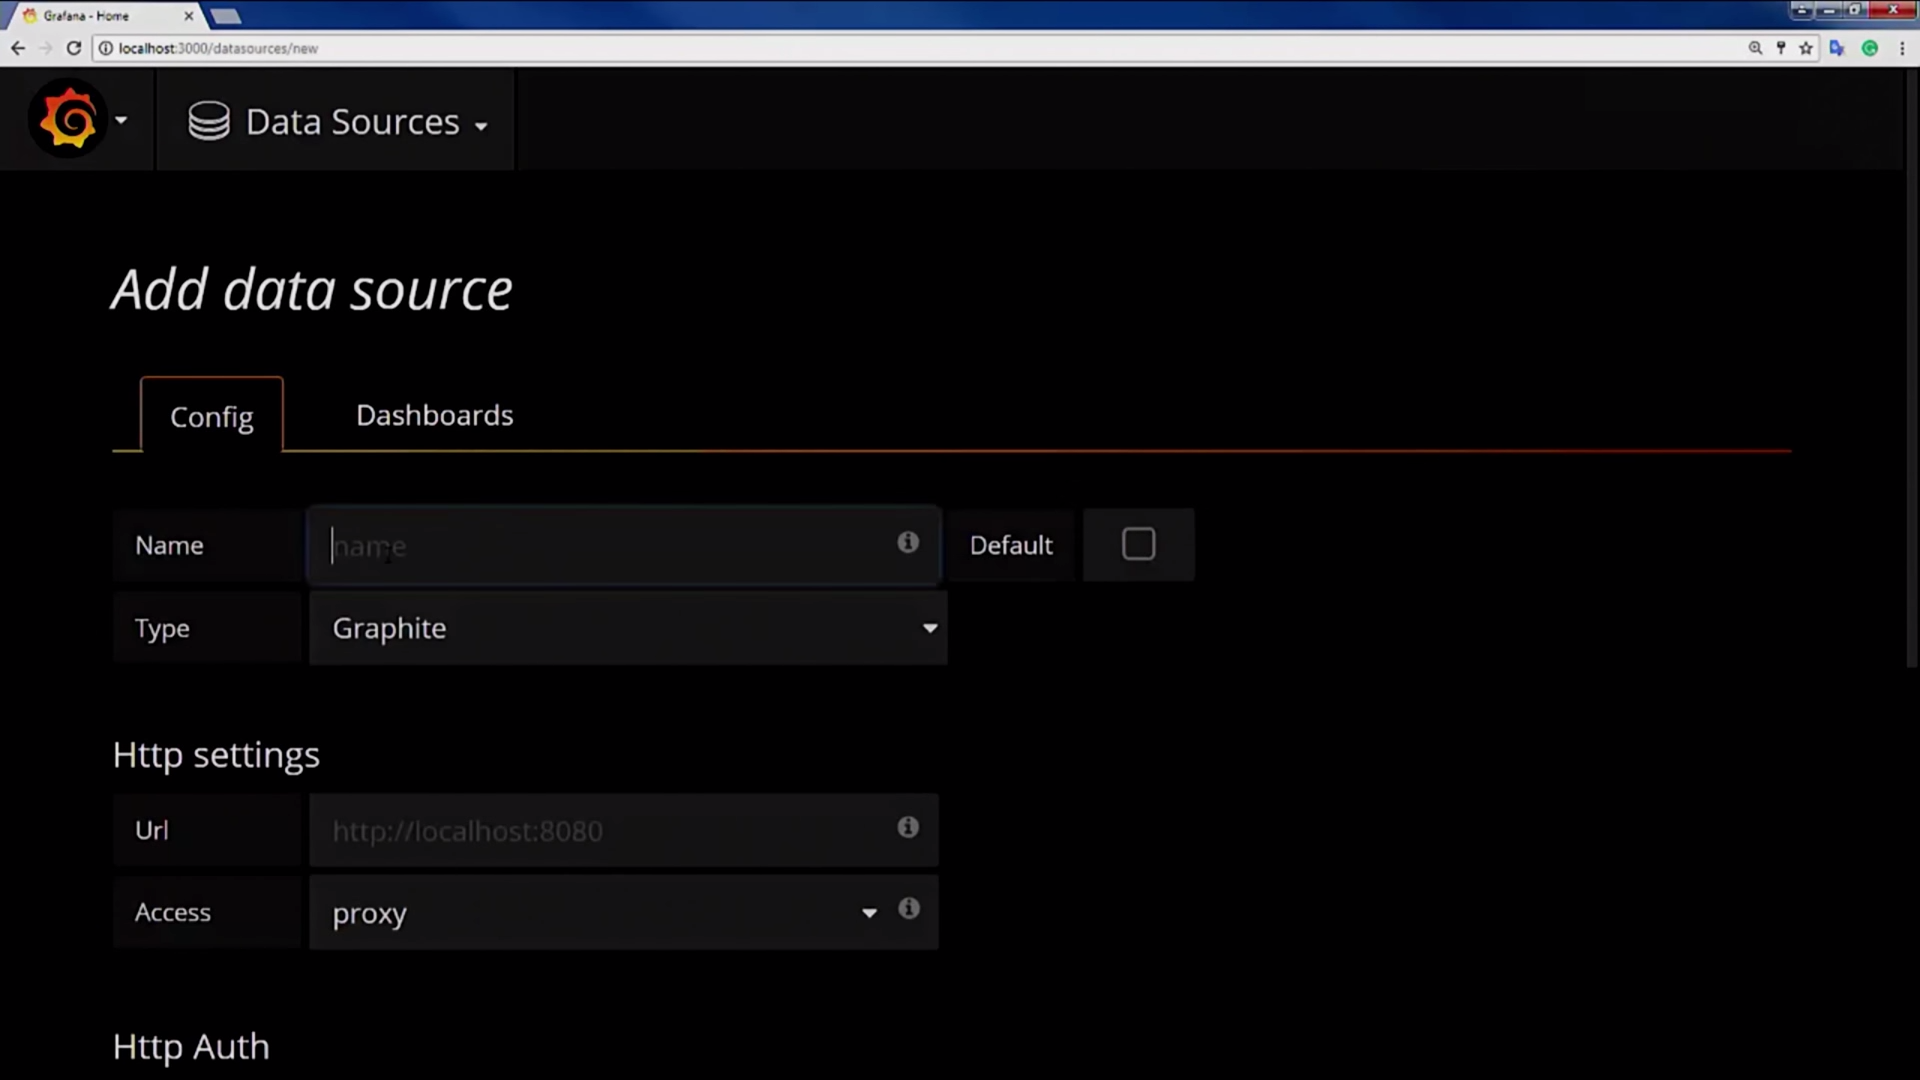
, InfluxDB, Influx ( ). Data Source , .
Influx , .

Data Source , Influx . , , :
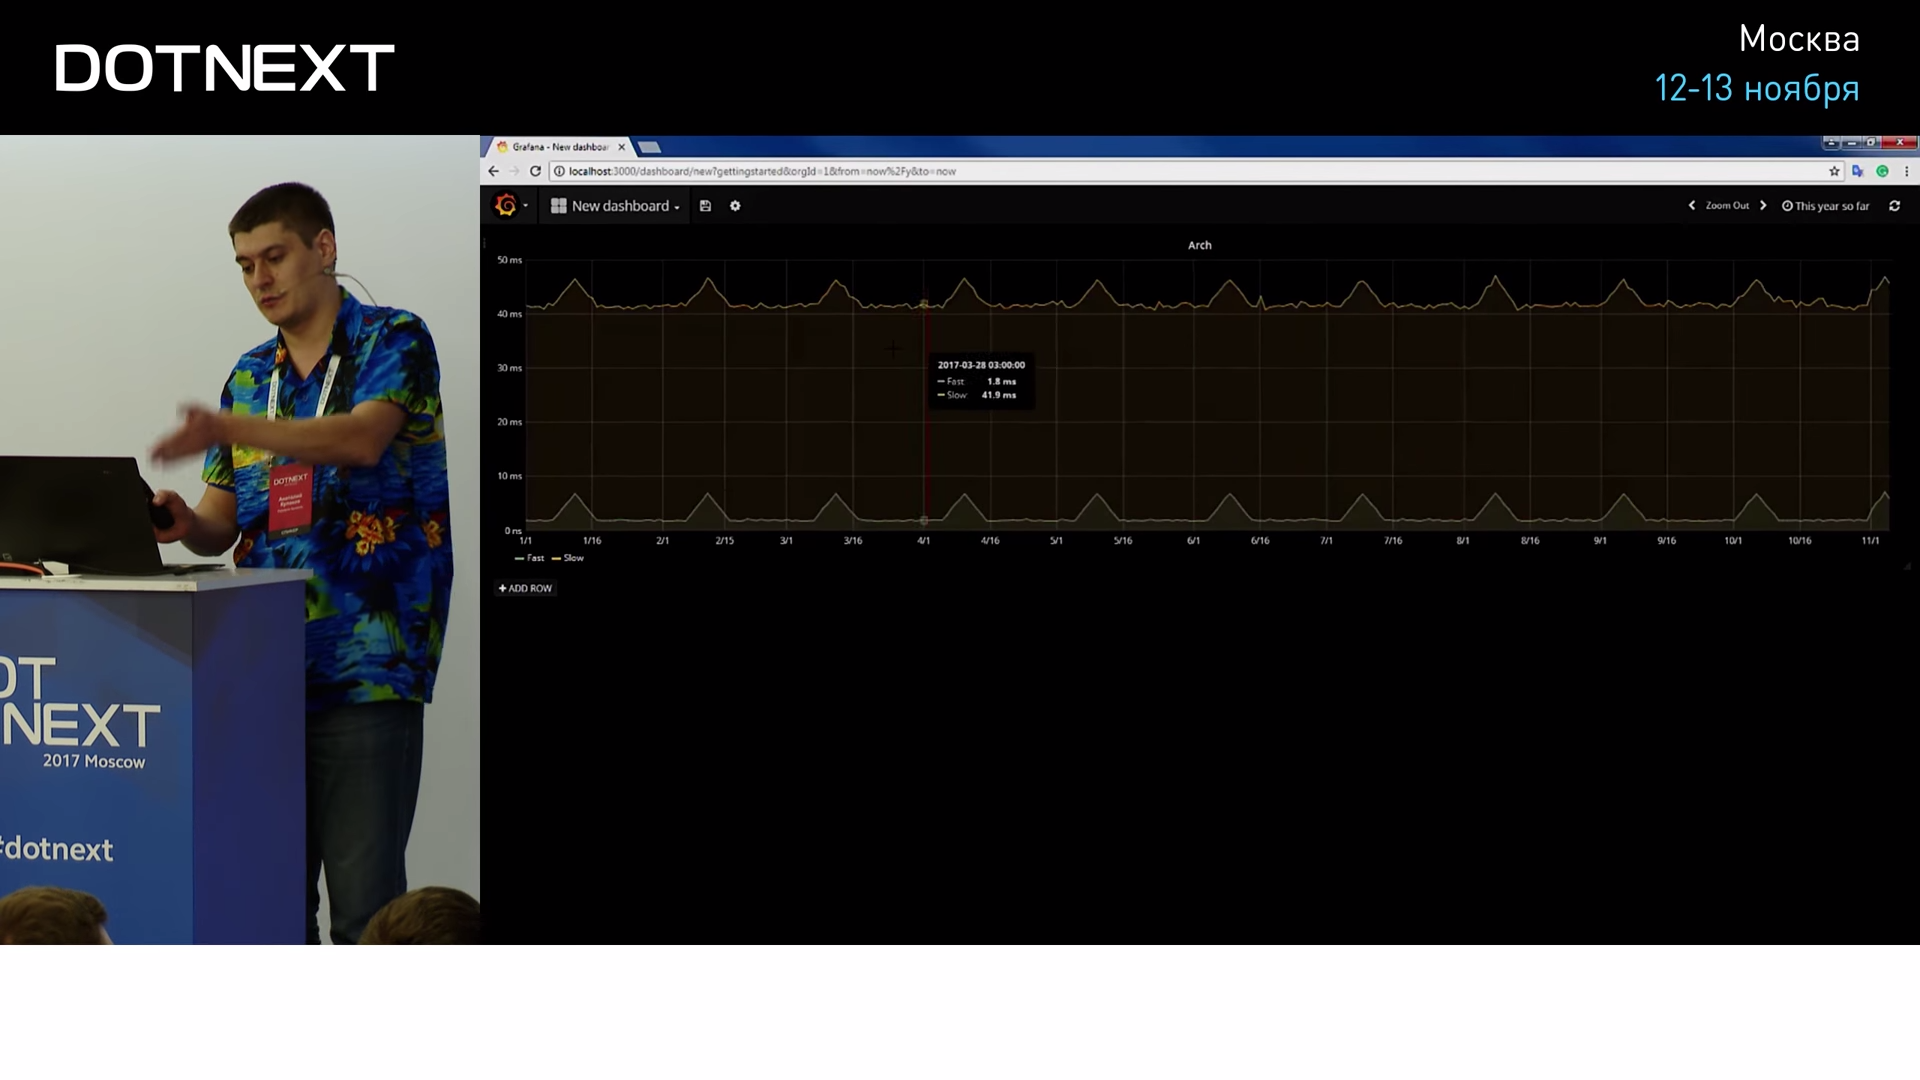
, . . : , , Grafana .

, , .

, Grafana Telegram. , .

, , Telegram. , . .
, .
. , , , . . . , , . , , . .
, , . , , , . .
Dynamic Time Warping. . , «» . , , , , .. : , , , API gateway. API gateway DDoS-. , , . 100% CPU, — - , — - . , , , . . DTW .
, , , . , , , , . , , , , — .
— . .
.
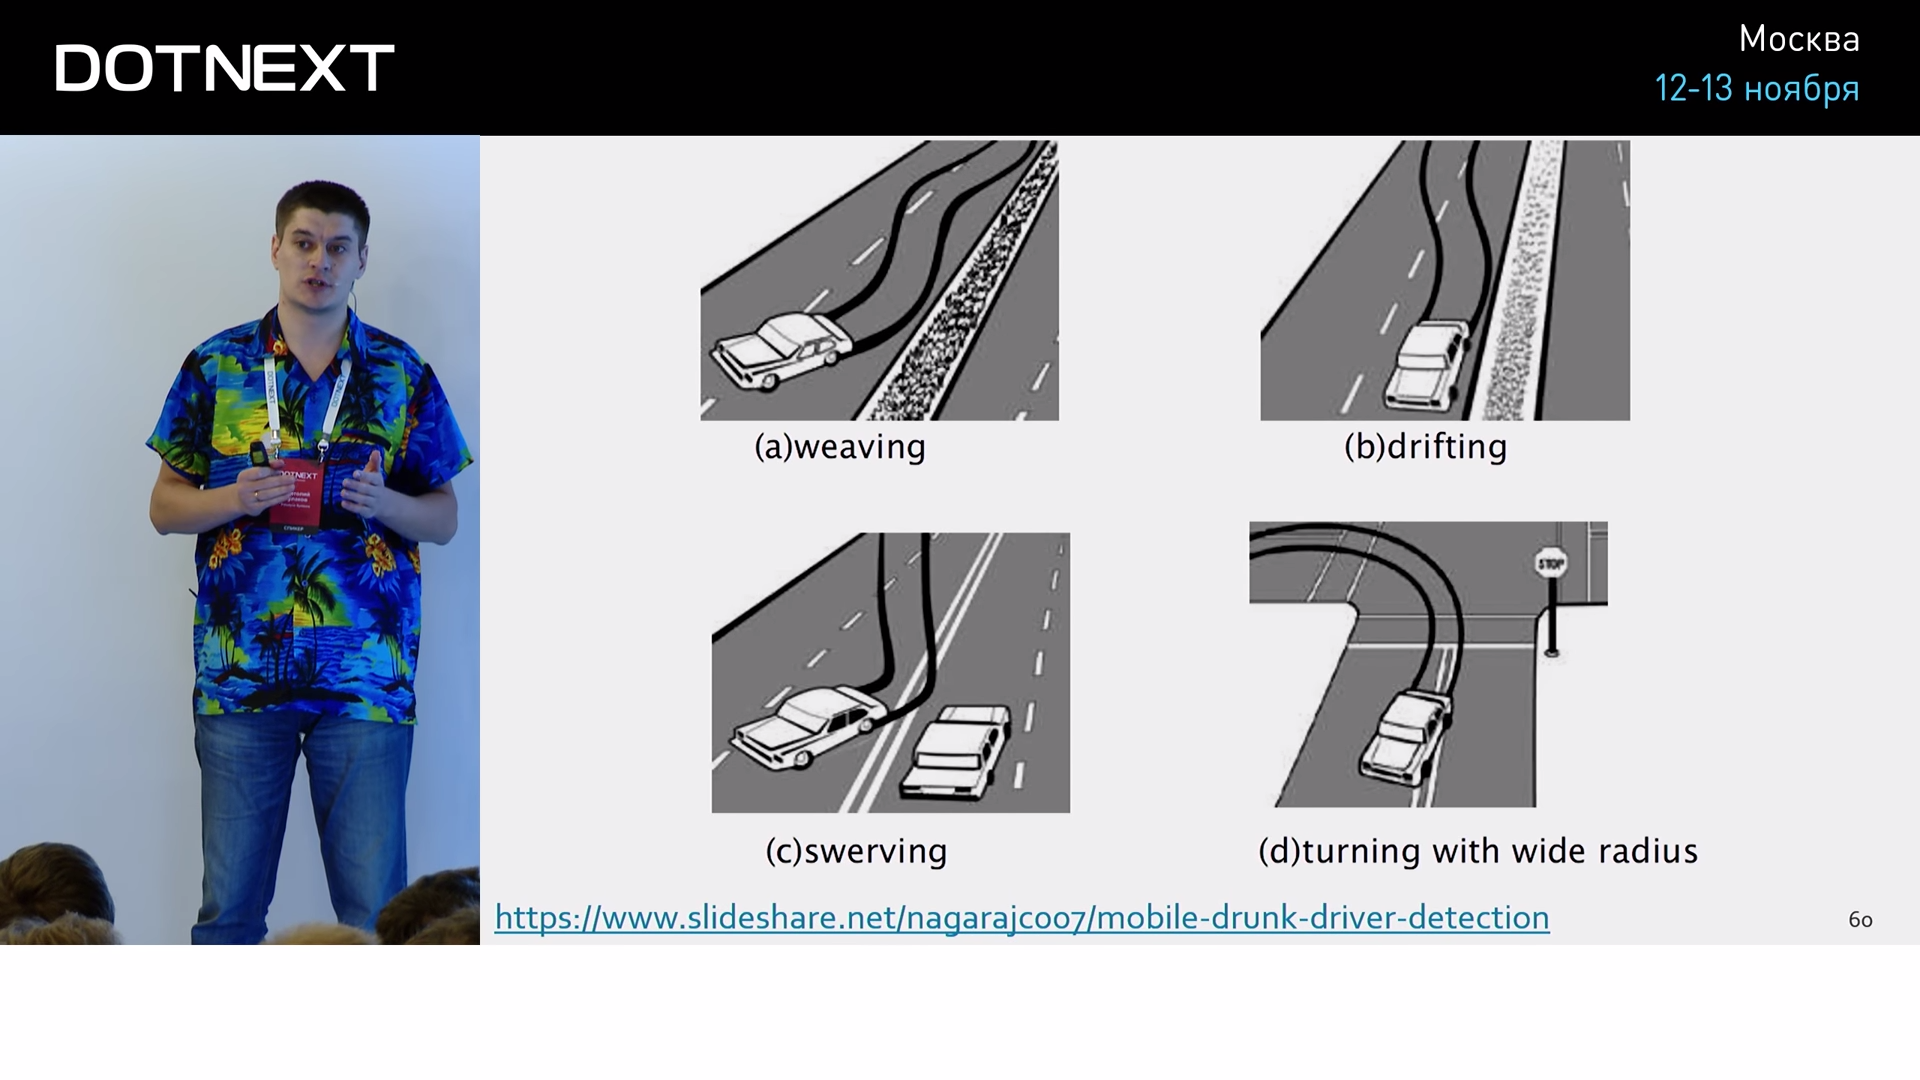
It turns out that this is also a time series. Analyzing this graph, it is possible to predict the possibility of an accident and to warn the sad outcomes in advance. The most interesting is that all this analysis takes place on the driver’s mobile device.
Let's go down to our realities and look at the tools. InfluxData provides you with a set of several tools that can help you in your application. All of them are united under the common name TICK and are perfectly integrated with each other.
We are already familiar with Telegraf. This is a metric collector that can aggregate data and send it to the server.
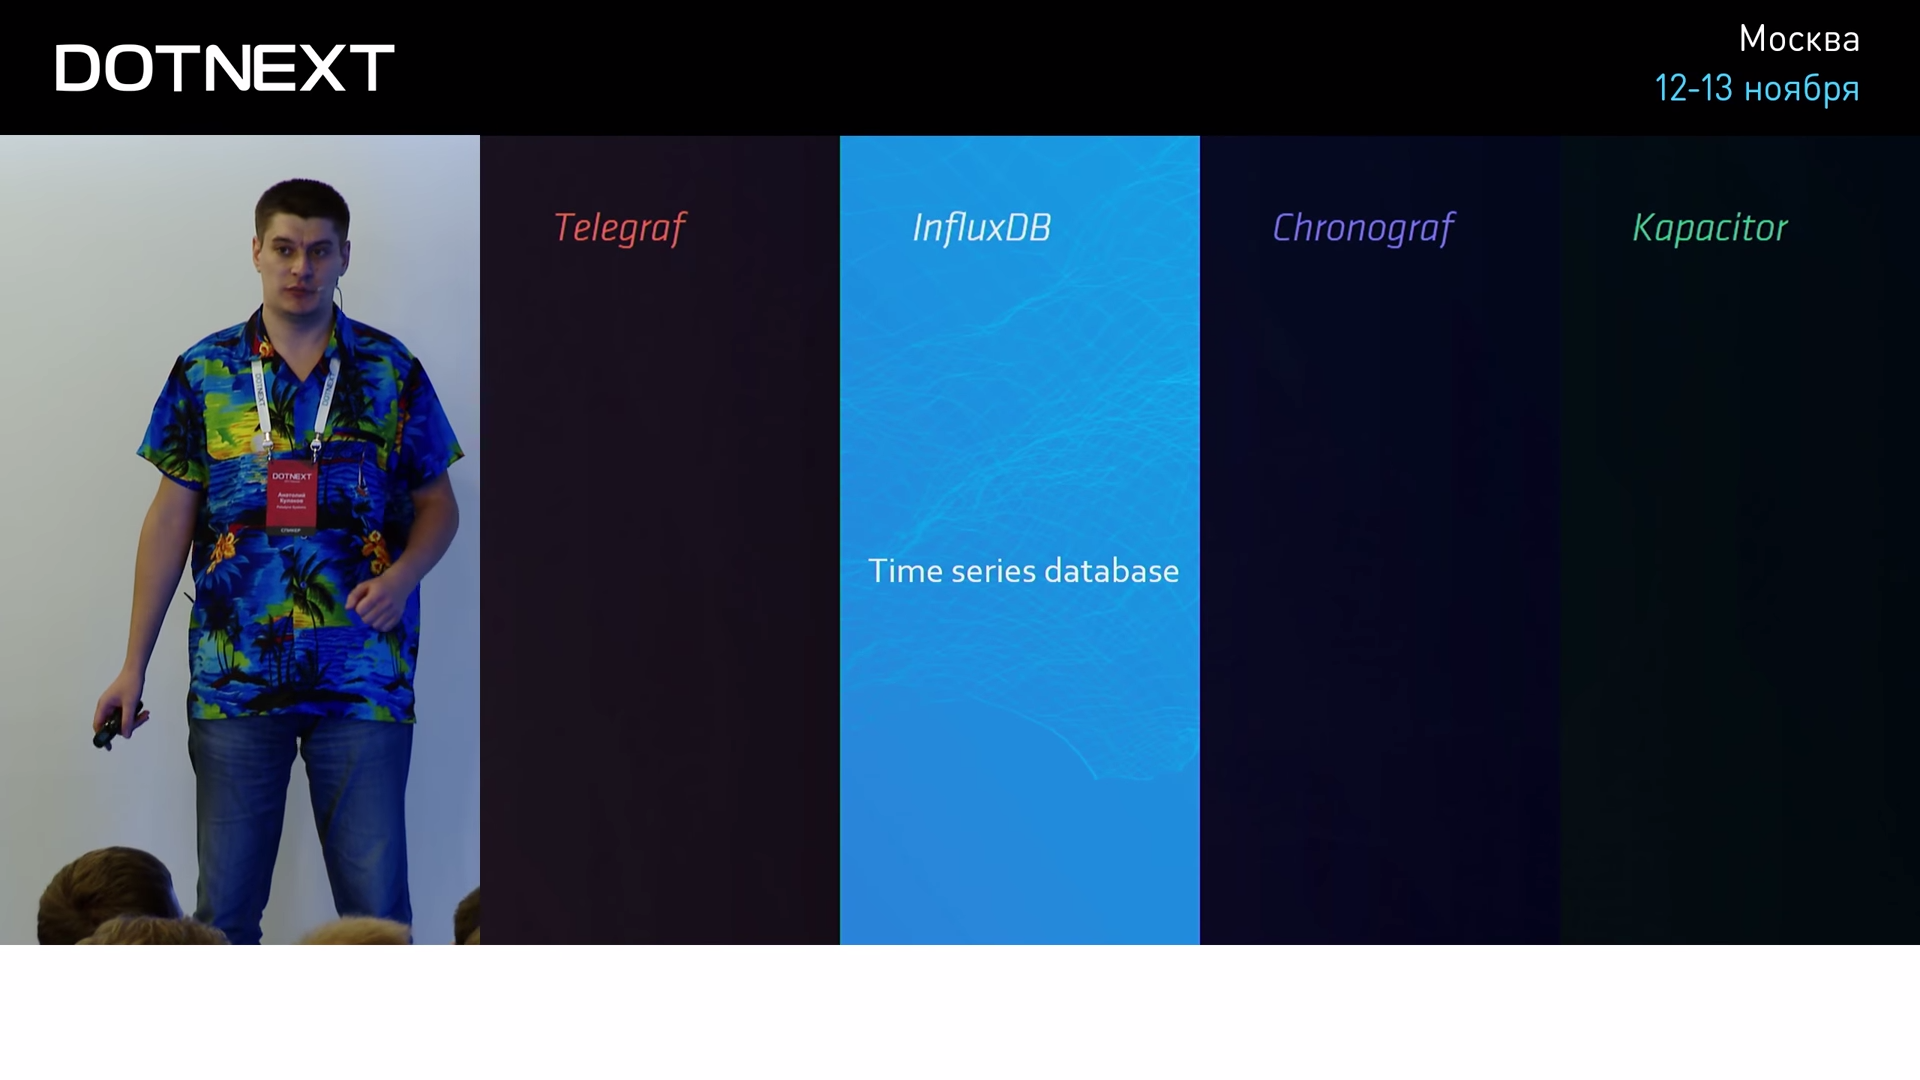
InfluxDB. Basically, InfluxDB is beautiful, its free version should be enough if you make less than a million records per second. The only significant limitation of the free version is the lack of clustering. Therefore, if you need the resiliency and reliability of the metrics system, you need a paid version, where all this is. Influx is available in both cloud and self-hosted solutions.
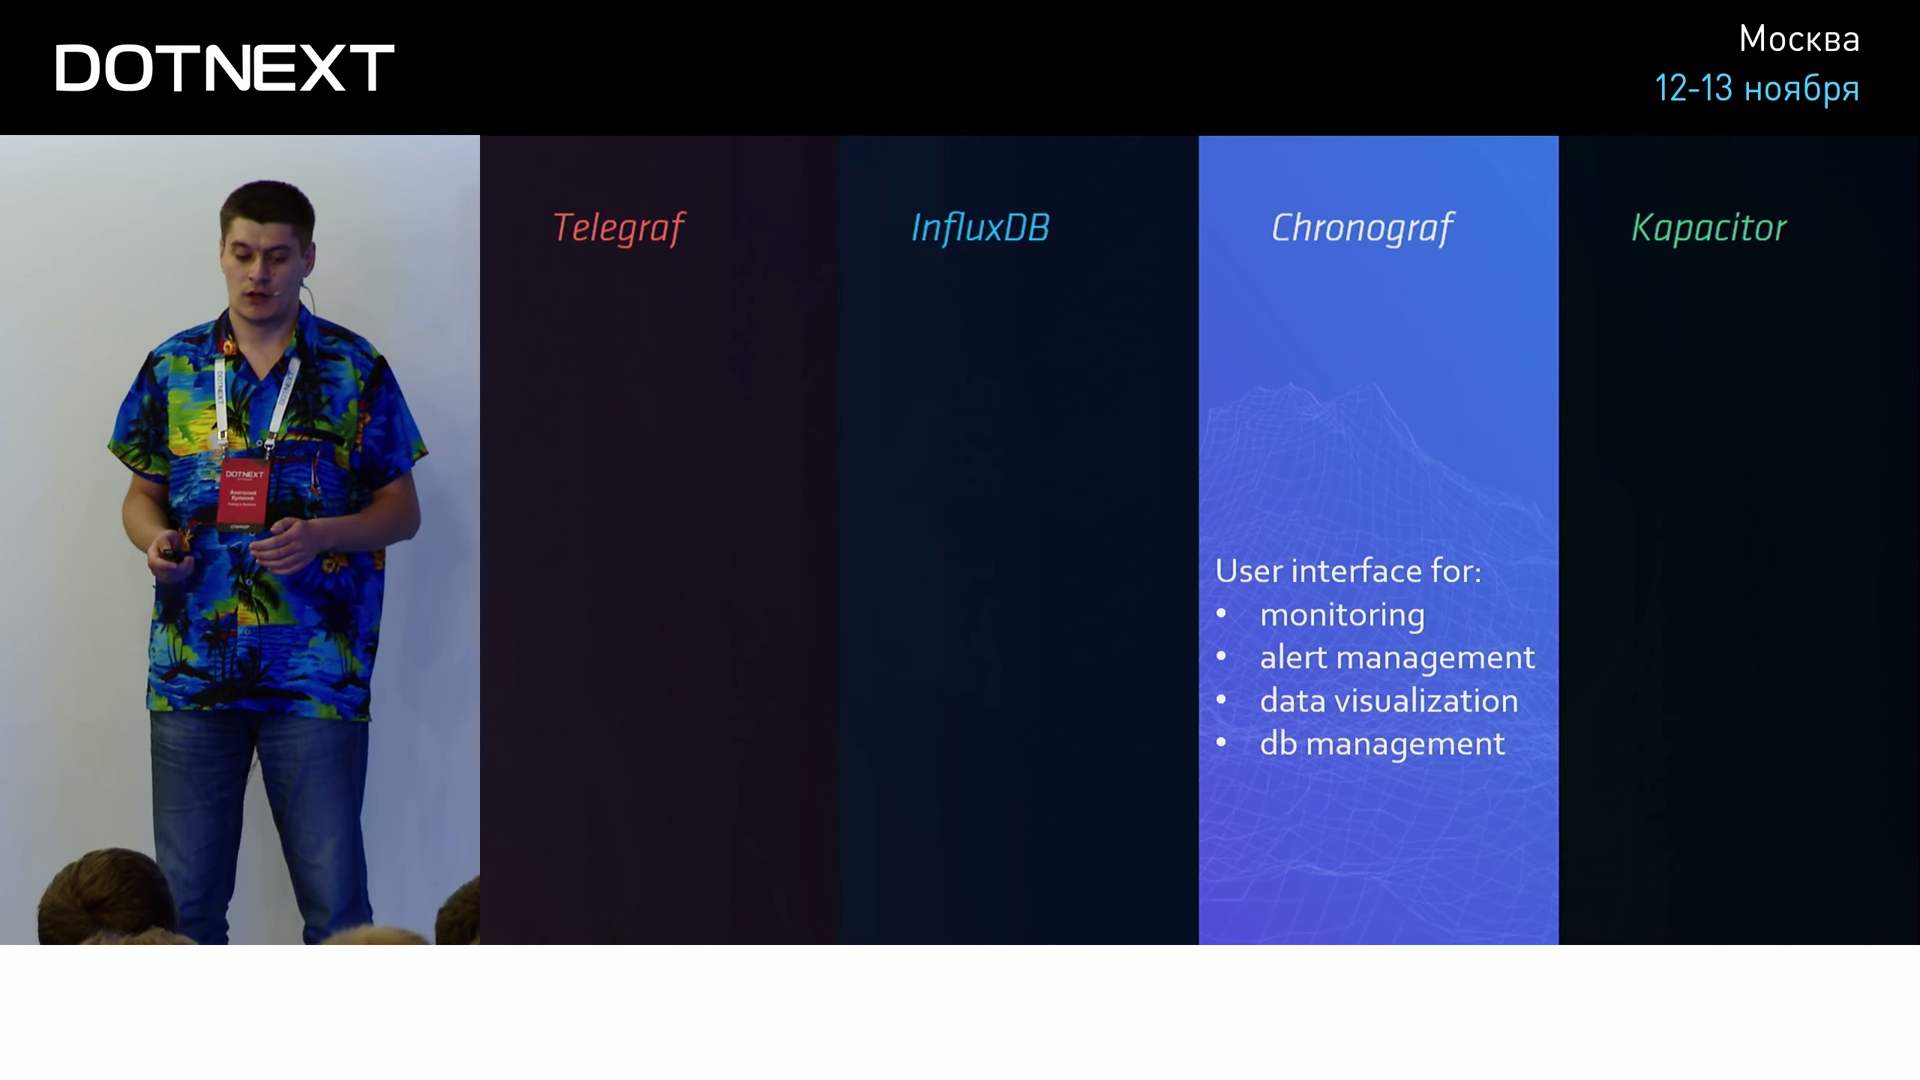
Chronograph is a web UI, which should unite all this family. He is terrible, so I did not tell about him. But, unfortunately, we have no other tool. If you just need to go to Influx and see what kind of data is there, what metrics are created, what retention policy is, then this mess will help you. In principle, it is developing well, there is hope that in the near future it will even be possible to use it.

Kapacitor is positioned as a tool for detecting anomalies using machine learning. But he has a lot of bugs and the brain-consuming syntax of queries, so it is completely unrealistic to use it in practice in the coming years, do not even try. If you really need to detect anomalies using machine learning, the following bundle works: you also store data in Influx in the same way, but read it using your own application, which you write with regard to the existing domain, and use standard machine libraries as analyzers learning. Here it works great. If you need, look this way.

If the Influx competitor can somehow be found, then Grafana is out of competition. Great visualization, the minimum number of bugs. Having a visual query editor that makes the entry threshold flat. A flexible system of plug-ins that ensures the existence of: heaps of data sources, non-standard panels and ready-made dashboards for all popular needs. This is the only web application whose responsiveness does not make me want to break the monitor with a chair. In general, here do not even try to look for an alternative in the coming years.
Such a moment is interesting in conjunction with Grafana and Influx: this scheme is rather autonomous. What does it mean? After you install these tools, you give the developer just two URLs. The first is from Influx, and the developer, implementing another feature, begins to write his own metrics to this URL. He does not need to know anything about Influx, because there is a dynamic scheme, Influx will adjust to it. The second URL is from Grafana. The developer recorded the data in Influx, enters Grafana, and, using the visual editor, easily and quickly plots himself with nice graphics, immediately sees the results of his immediate work, and this is very important in the development practice. Thus, there is a very large metric coverage of your application, which in the future may very well play into your hands.

Unfortunately, a lot of tools in the modern world come with the Linux-first approach. This means that, first of all, the program is developed for Linux, and then transferred as a residual to Windows. The same fate befell our heroes. Grafana is easier, it has a web interface, she doesn’t care where to run, but Influx, despite the fact that it has been developed for more than five years, received the distribution kit for Windows only six months ago (I’m one of those old fart who collected it from source) ). At the moment, the only thing left of such heredity is that these tools are console applications and cannot run as Windows services, which is a standard deployment unit on our Windows systems. A tool like NS Service Manager will help you solve this problem; it takes a console application and makes a full-fledged Windows service out of it. Small and good utility, works without interruption and complaints.
Let's look at alternative approaches. So:
- if instant insertion and fast reading are not important to you;
- if you do not run into bandwidth;
- if you don’t dream of transparent downsampling;
- if you don't know how Continuous Queries can help;
- if you do not need built-in statistics and extended aggregation functions;
- if you want to personally delete every outdated entry;
- if you are not afraid of the size of the base;
- if you are confident in the absence of high loads on your system;
- if you are ready to lose analysis in real time.
So you, in principle, can use standard databases to store metrics in them. And this is not so funny as it seems at first glance, because the finished examination in a team that has already worked with these old footers can exceed the threshold of risk that is needed to bring some new tools into your project.

I have met many projects for which this method turned out to be the most viable, so do not hesitate, this is normal, it happens.
The bundle that I showed you today (Telegraf, Influx and Grafana) is the lowest-level, most optimal system in terms of performance and flexibility. Naturally, not everyone needs such a low level. Many do not want to bother about it and want to choose higher-level solutions, they are also full on the market, they also work, and they can also suit you, try.
Also, if you are not ashamed of the clouds, there are a lot of paid solutions that are pretty good.

Usually, all these high-level solutions work with metrics and logs together to try to correlate them into one scheme, one dashboards.
Unfortunately, one cannot be recommended. When we talk about high-level solutions, you need to look specifically at your project, at your workload, at your approach to development. InfluxDB and Grafana are a kind of basic level that you should be guided by, if you suddenly decide to search for alternatives.
As you probably noticed, one of the great opportunities when working with TSDB is familiarity with their algorithms. Algorithms are quite interesting:
- Gorilla paper
- Akumuli
- Run-length encoding
- Varints
- Zigzag
- Dynamic time warping
- Sketch-based change detection
- Mobile Phone Based Drunk driving detection
Here are links to help you get a little insight into this topic. If you're suddenly a fan of some bit magic, elegant solutions, or just cool and good compression, read this minimum at night before bed, I think you will sleep well.
If we want to get acquainted with the detailed information about our heroes, it’s enough standard information on their official website:
It is very well written, of course, always relevant.
If, after reading the article, you have questions, feel free to email me about how you use metrics, what interesting graphics you have:
I will deal with this topic for a long time and much, because, as the classic said: "Optimism is a lack of information." Therefore, friends, be realistic, know what your application does. Thanks for attention.
Minute advertising. As you probably know, we do conferences. The nearest .NET conference - DotNext 2018 Piter . It will be held April 22-23, 2018 in St. Petersburg. What reports are there - you can see in our archive on YouTube . At the conference, it will be possible to chat live with the speakers and the best experts on .NET in special discussion zones after each report. In short, come in, we are waiting for you.
Source: https://habr.com/ru/post/352624/
All Articles