Performance analysis of the drive Intel Optane SSD 750GB
Last summer, we published an article about Intel Optane SSD disk drives and invited everyone to take part in free testing . The novelty caused great interest: our users tried to use Optane for scientific calculations , for working with in-memory databases , for projects in the field of machine learning.
We ourselves have long been going to write a detailed review, but all did not reach out. But more recently, a suitable opportunity appeared: colleagues from Intel provided us with a new 750 GB capacity for testing. The results of our experiments will be discussed below.
Intel Optane P4800X 750GB: General Information and Specifications
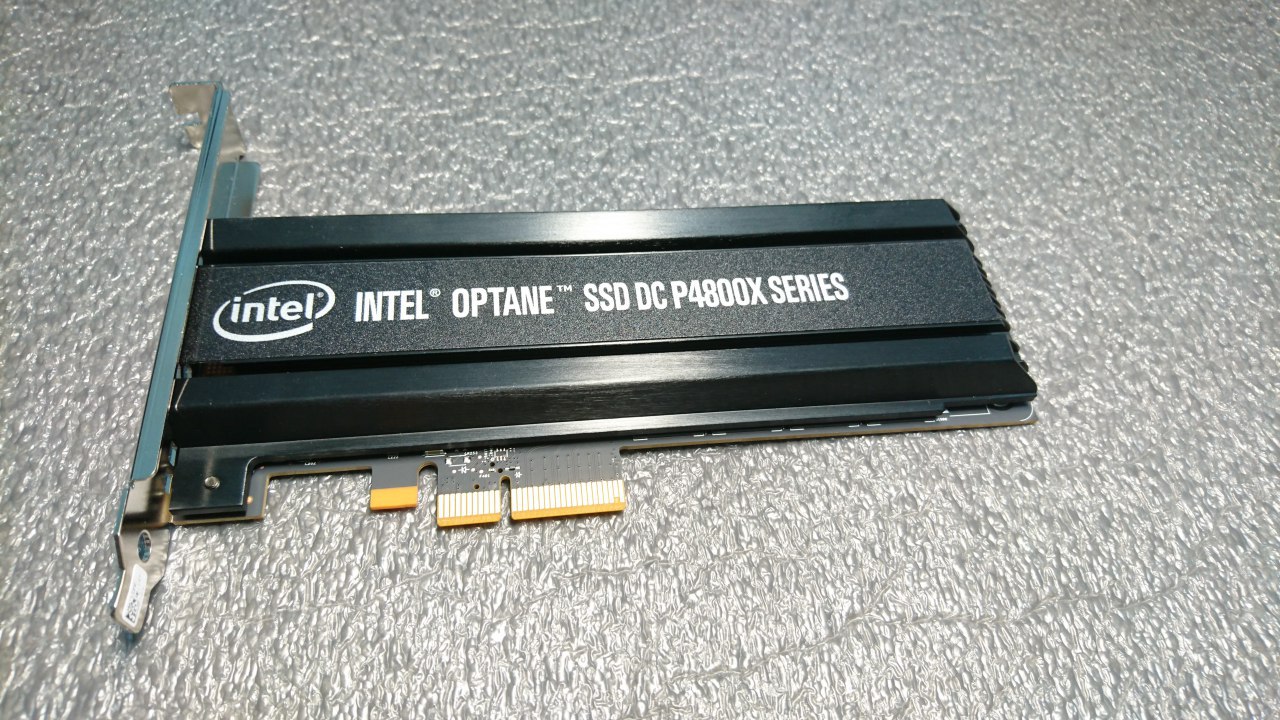
Intel Optane SSDs are available in a 20nm process. It exists in two form factors: in the form of a map (HHHL (CEM3.0) - for details on what it is, see here ) and U.2 15 mm.
')
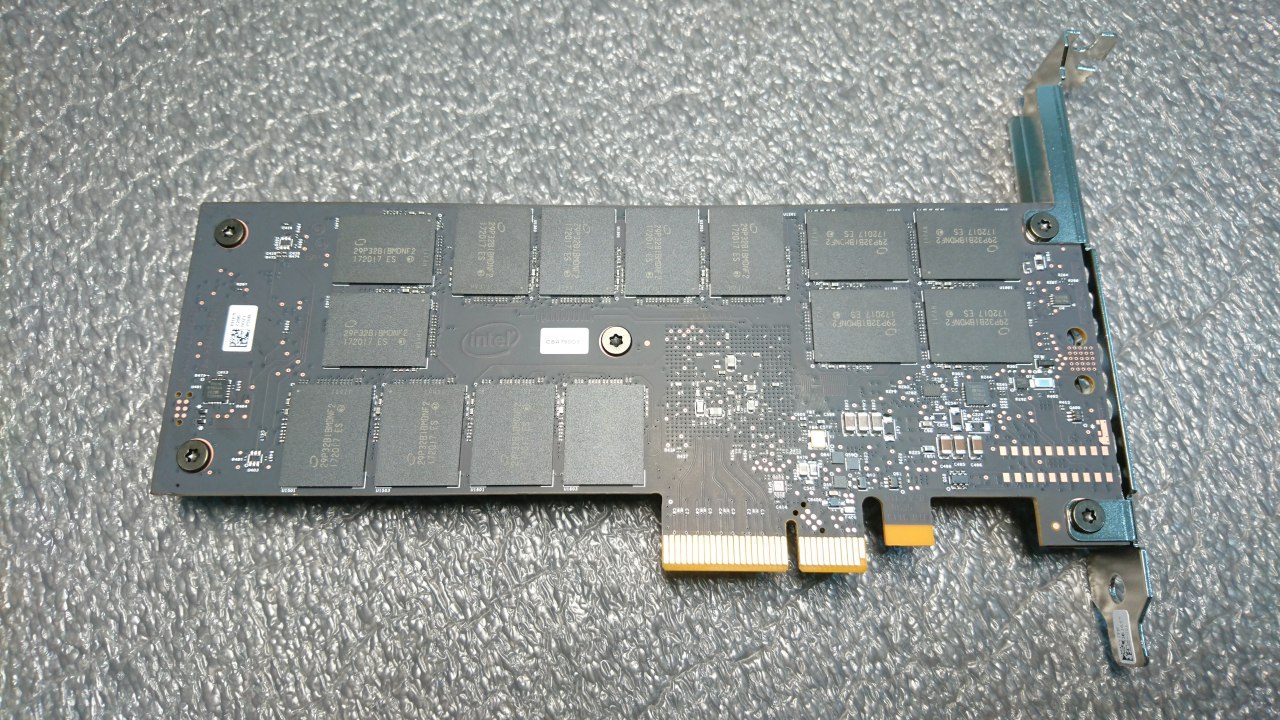
We have a disk in the form of a card:
It is visible in the BIOS and is detected by the system without installing any drivers and additional programs (we give an example for Ubuntu 16.04 OS):
$ lsblk NAME MAJ:MIN RM SIZE RO TYPE MOUNTPOINT sda 8:0 0 149.1G 0 disk ├─sda2 8:2 0 1K 0 part ├─sda5 8:5 0 148.1G 0 part │ ├─vg0-swap_1 253:1 0 4.8G 0 lvm [SWAP] │ └─vg0-root 253:0 0 143.3G 0 lvm / └─sda1 8:1 0 976M 0 part /boot nvme0n1 259:0 0 698.7G 0 disk More information can be viewed using the nvme-cli utility (it is included in the repositories of most modern Linux distributions, but in a very outdated version, so we recommend building a fresh version from the source code ).
But its main technical characteristics (taken from the official site of Intel ):
| Characteristic | Value |
| Volume | 750GB |
| Performance when performing sequential read operations, MB / s | 2500 |
| Performance when performing sequential write operations, MB / s | 2200 |
| Performance when performing random read operations, IOPS | 550000 |
| Performance when performing random write operations, IOPS | 550000 |
| Delay in performing a read operation (latency) | 10 µs |
| Delay in writing operation | 10 µs |
| Wear resistance, PBW * | 41.0 |
* PBW - short for Petabytes written. This characteristic indicates the amount of information that can be written to disk during the entire life cycle.
At first glance, everything looks very impressive. But the numbers given in the marketing materials, many (and not without reason) used to not trust. Therefore, it will not be superfluous to check them, and also to conduct some additional experiments.
We start with a fairly simple synthetic tests, and then conduct tests under conditions as close as possible to actual practice.
Testbed Configuration
Colleagues from Intel (for which many thanks to them) provided us with a server with the following technical characteristics:
- motherboard - Intel R2208WFTZS;
- processor - Intel Xeon Gold 6154 (24.75M Cache, 3.00 GHz);
- memory - 192GB DDR4;
- Intel SSD DC S3510 (the OS was installed on this disk);
- Intel Optane ™ SSD DC P4800X 750GB.
The server was running OS Ubuntu 16.04 with kernel 4.13.
Note! To get good performance NVMe-drives, you need a kernel version of at least 4.10. With earlier kernel versions, the results will be worse: NVMe support in them is not properly implemented.
For the tests we used the following software:
- fio utility, which is the de facto standard for measuring disk performance;
- diagnostic tools developed by Brendan Gregg as part of the iovisor project;
- db_bench utility created in Facebook and used to measure performance in the rocksdb data warehouse .
Synthetic tests
As mentioned above, we first consider the results of synthetic tests. We performed them using the fio utility version 3.3.31, which we collected from the source code .
In accordance with the methodology adopted by us, the following load profiles were used in the tests:
- random write / read in 4 KB blocks, queue depth - 1;
- random write / read in 4 KB blocks, queue depth - 16;
- random write / read in 4 M blocks, queue depth - 32;
- random write / read in 4 KB blocks, queue depth - 128.
Here is an example of the configuration file:
[readtest] blocksize=4M filename=/dev/nvme0n1 rw=randread direct=1 buffered=0 ioengine=libaio iodepth=32 runtime=1200 [writetest] blocksize=4M filename=/dev/nvme0n1 rw=randwrite direct=1 buffered=0 ioengine=libaio iodepth=32 Each test was performed for 20 minutes; upon completion, we entered all the indicators of interest to us in the table (see below).
The greatest interest for us will be represented by such a parameter as the number of I / O operations per second (IOPS). In tests for reading and writing blocks of 4M, the size of the bandwidth is entered in the table.
For clarity, we present the results not only for Optane, but also for other NVMe drives: this is the Intel P 4510, as well as a disk from another manufacturer - Micron :
| Disc model | Disk capacity, GB | randread 4k iodepth = 128 | randwrite 4k iodepth = 128 | randread 4M iodepth = 32 | randwrite 4M iodepth = 32 | randread 4k iodepth = 1 | randwrite 4k iodepth = 16 | randread 4k iodepth = 1 | randwrite 4k iodepth = 1 |
| Intel P4800 X | 750 GB | 400k | 324k | 2663 | 2382 | 399k | 362k | 373k | 76.1k |
| Intel P4510 | 1 TB | 335k | 179k | 2340 | 504 | 142k | 143k | 12.3k | 73.5k |
| Micron MTFDHA X1T6MCE | 1.6 TB | 387k | 201k | 2933 | 754 | 80.6k | 146k | 8425 | 27.4k |
As you can see, in some tests, Optane shows numbers that are several times higher than the results of similar tests for other drives.
But in order to make more or less objective judgments about disk performance, the amount of IOPS alone is not enough. This parameter in itself means nothing apart from the connection with the other - latency.
Latency is the amount of time during which an I / O operation request is sent, sent by an application. It is measured using the same fio utility. Upon completion of all tests, it issues the following output to the console (here is a small fragment):
Jobs: 1 (f=1): [w(1),_(11)][100.0%][r=0KiB/s,w=953MiB/s][r=0,w=244k IOPS][eta 00m:00s] writers: (groupid=0, jobs=1): err= 0: pid=14699: Thu Dec 14 11:04:48 2017 write: IOPS=46.8k, BW=183MiB/s (192MB/s)(699GiB/3916803msec) slat (nsec): min=1159, max=12044k, avg=2379.65, stdev=3040.91 clat (usec): min=7, max=12122, avg=168.32, stdev=98.13 lat (usec): min=11, max=12126, avg=170.75, stdev=97.11 clat percentiles (usec): | 1.00th=[ 29], 5.00th=[ 30], 10.00th=[ 40], 20.00th=[ 47], | 30.00th=[ 137], 40.00th=[ 143], 50.00th=[ 151], 60.00th=[ 169], | 70.00th=[ 253], 80.00th=[ 281], 90.00th=[ 302], 95.00th=[ 326], | 99.00th=[ 363], 99.50th=[ 379], 99.90th=[ 412], 99.95th=[ 429], | 99.99th=[ 457] Note the following snippet:
slat (nsec): min=1159, max=12044k, avg=2379.65, stdev=3040.91 clat (usec): min=7, max=12122, avg=168.32, stdev=98.13 lat (usec): min=11, max=12126, avg=170.75, stdev=97.11 These are the latency values that we obtained during the test. Of greatest interest to us
Slat is the time to send a request (i.e., a parameter that is related to the performance of the I / O subsystem in Linux, but not the disk), and clat is the so-called complete latency, i.e. time of the request received from the device (this is the parameter that interests us). How to analyze these figures is well written in this article , published five years ago, but it’s still relevant.
Fio is a generally accepted and well-proven utility, but sometimes in real practice there are situations when you need to get more accurate information about the delay time and identify possible causes if this indicator is too high. Tools for more accurate diagnostics are developed as part of the iovisor project (see also the repository on GitHub . All these tools are based on the eBPF mechanism (extended Berkeley Packet Filters . In our tests, we tried the biosnoop utility (see the source code here ). It tracks everything I / O operations in the system and measures the delay time for each of them.
This is very useful if there are problems with the performance of a disk to which a large number of read and write requests are being executed (for example, a disk contains a database for some high-load web project).
We started with the simplest option: we ran the standard fio tests and measured the latency for each operation using biosnoop, which was run in a different terminal. While running, biosnoop writes the following table to standard output:
TIME(s) COMM PID DISK T SECTOR BYTES LAT(ms) 300.271456000 fio 34161 nvme0n1 W 963474808 4096 0.01 300.271473000 fio 34161 nvme0n1 W 1861294368 4096 0.01 300.271491000 fio 34161 nvme0n1 W 715773904 4096 0.01 300.271508000 fio 34161 nvme0n1 W 1330778528 4096 0.01 300.271526000 fio 34161 nvme0n1 W 162922568 4096 0.01 300.271543000 fio 34161 nvme0n1 W 1291408728 4096 0.01 This table consists of 8 columns:
- TIME - the time of the operation in the Unix Timestamp format;
- COMM is the name of the process that performed the operation;
- PID - PID of the process that performed the operation;
- T - type of operation (R - read, W - write);
- SECTOR - the sector where the recording was carried out;
- BYTES - the size of the recorded block;
- LAT (ms) is the delay time for the operation.
We carried out many measurements for different disks and paid attention to the following: for Optane during the whole test (and the test duration varied from 20 minutes to 4 hours) the value of the latency parameter remained unchanged and corresponded to the value stated in the table above 10 µs, while while other drives have fluctuations.
According to the results of synthetic tests, it is quite possible to assume that Optane and under high load will show good performance and most importantly - low latency. Therefore, we decided not to stop at pure “synthetics” and conduct a test with real (or at least as close as possible to real) loads.
To do this, we used the performance measurement utilities that make up RocksDB, an interesting and increasingly popular “key-value” repository developed on Facebook. Below we describe in detail the tests performed and analyze their results.
Optane and RocksDB: Performance Tests
Why RocksDB
In recent years, the widespread sharply increased need for fault-tolerant storage of large amounts of data. They are used in various areas: social networks, corporate information systems, instant messengers, cloud storage and others. Software solutions for such storages, as a rule, are built on the basis of so-called LSM-trees - for example, Big Table, HBase, Cassandra, LevelDB, Riak, MongoDB, InfluxDB. Working with them involves serious workloads, including on the disk subsystem - see, for example, here . Optane with all its durability and durability could be an appropriate solution.
RocksdDB (see also the repository on GitHub ) is a “key-value” repository developed by Facebook and a fork of the notorious LevelDB project. It is used to solve a wide range of tasks: from organizing the storage engine for MySQL to caching application data.
We chose it for our tests, guided by the following considerations:
- RocksDB is positioned as a storage designed specifically for fast drives, including NVMe ;
- RocksDB is successfully used in high-load Facebook projects;
- RocksDB includes interesting testing utilities that create a very serious load (see below for details);
- Finally, we were just curious to see how the Optane with its reliability and stability would withstand heavy loads.
All tests described below were carried out on two disks:
- Intel Optane SSD 750 GB
- Micron MTFDHAX1T6MCE
Preparation for testing: compiling RocksDB and creating a base
We compiled RocksDB from source code published on GitHub (here and below are examples of commands for Ubuntu 16.04):
$ sudo apt-get install libgflags-dev libsnappy-dev zlib1g-dev libbz2-dev liblz4-dev libzstd-dev gcc g++ clang make git $ git clone https://github.com/facebook/rocksdb/ $ cd rocksdb $ make all After installation, you need to prepare for the test disk, which will be recorded data.
The official documentation with RocksDB recommends using the XFS file system, which we will create on our Optane:
$ sudo apt-get install xfsprogs $ mkfs.xfs -f /dev/nvme0n1 $ mkdir /mnt/rocksdb $ mount -t xfs /dev/nvme0n1 /mnt/rocksdb This preparatory work is completed, and you can proceed to create a database.
RocksDB is not a DBMS in the classical sense of the word, and in order to create a database, you will need to write a small C or C ++ program. Examples of such programs (1 and 2) are available in the official RecksDB repository in the examples directory. The source code will need to make some changes and specify the correct path to the database. In our case, it looks like this:
$ cd rockdb/examples $ vi simple_example.cc In this file you need to find the line
std::string kDBPath ="/tmp/rocksdb_simple_example" And register in it the path to our database:
std::string kDBPath ="/mnt/rocksdb/testdb1" After that, you need to proceed to compile:
$ make $ ./simple_example As a result of this command, a database will be created in the specified directory. We will write to it (and read from it) the data in our tests. We will test using the db_bench utility; The corresponding binary file is in the RocksDB root directory.
The testing methodology is described in detail on the official wiki-page of the project .
If you carefully read the text on the link, you will see that the meaning of the test is to write one billion keys to the database (and then read the data from this database). The total amount of all data is about 800 GB. We can afford it: the volume of our Optane is only 750 GB. Therefore, we have reduced the number of keys in our test by exactly half: not one billion, but 500 million. To demonstrate the capabilities of Optane and this figure is quite enough.
In our case, the amount of recorded data will be approximately 350 GB.
All these data are stored in SST format (short for Sorted String Table ; see also this article ). At the output we will get several thousand so-called SST-files (you can read more here .
Before running the test, it is necessary to increase the limit on the number of simultaneously open files on the system, otherwise it will not work: approximately 15-20 minutes after the test starts, we will see the message Too many open files.
So that everything goes as it should, run the ulimit command with the n option:
$ ulimit -n By default, the system has a limit of 1024 files. To avoid problems, we will immediately increase it to a million:
$ ulimit -n 1000000 Please note: after a reboot, this limit is not saved and returns to its default value.
That's all, the preparatory work is completed. We proceed to the description of the tests and analysis of the results.
Test description
Introductory notes
Based on the methodology described by the link above, we conducted the following tests:
- bulk key loading in sequential order;
- bulk loading of keys in random order;
- random entry;
- random read.
All tests were performed using the db_bench utility, the source code of which can be found in the rocksdb repository .
The size of each key is 10 bytes, and the size of the value is 800 bytes.
Consider the results of each test in more detail.
Test 1. Bulk upload keys in sequential order.
To run this test, we used the same parameters as indicated in the instructions for the link above. We only changed the number of keys to be written (we already mentioned this): not 1,000,000,000, but 500,000,000.
At the very beginning the base is empty; it is filled during the test. No data reading is performed during data loading.
The db_bench command to run the test looks like this:
bpl=10485760;mcz=2;del=300000000;levels=6;ctrig=4; delay=8; stop=12; wbn=3; \ mbc=20; mb=67108864;wbs=134217728; sync=0; r=50000000 t=1; vs=800; \ bs=4096; cs=1048576; of=500000; si=1000000; \ ./db_bench \ --benchmarks=fillseq --disable_seek_compaction=1 --mmap_read=0 \ --statistics=1 --histogram=1 --num=$r --threads=$t --value_size=$vs \ --block_size=$bs --cache_size=$cs --bloom_bits=10 --cache_numshardbits=6 \ --open_files=$of --verify_checksum=1 --sync=$sync --disable_wal=1 \ --compression_type=none --stats_interval=$si --compression_ratio=0.5 \ --write_buffer_size=$wbs --target_file_size_base=$mb \ --max_write_buffer_number=$wbn --max_background_compactions=$mbc \ --level0_file_num_compaction_trigger=$ctrig \ --level0_slowdown_writes_trigger=$delay \ --level0_stop_writes_trigger=$stop --num_levels=$levels \ --delete_obsolete_files_period_micros=$del --min_level_to_compress=$mcz \ --stats_per_interval=1 --max_bytes_for_level_base=$bpl \ --use_existing_db=0 --db=/mnt/rocksdb/testdb The command contains many options that just need to be commented: they will be used in subsequent tests. At the very beginning we set the values of important parameters:
- bpl - the maximum number of bytes per level;
- mcz - the minimum level of compression;
- del - time interval after which you want to delete obsolete files;
- levels - the number of levels;
- ctrig - the number of files after which you want to start compression;
- delay - the time after which you want to slow down the recording speed;
- stop - the time after which you want to stop recording;
- wbn - maximum number of write buffers;
- mbc is the maximum number of background compression;
- mb is the maximum number of write buffers;
- wbs - write buffer size;
- sync - enable / disable synchronization;
- r is the number of key-value pairs that will be recorded in the database;
- t is the number of threads;
- vs - the value value;
- bs - block size;
- cs - cache size;
- f - the number of open files (does not work, see the comment about this above);
- si is the frequency of statistics collection.
You can read more about the other parameters by running the command
./db_bench --help Detailed descriptions of all options are also provided here .
What results did the test show? The sequential load operation was completed in 23 minutes . The write speed was 536.78 MB / s .
For comparison: on the Micron NVMe drive, the same procedure takes a little more than 30 minutes , and the write speed is 380.31 MB / s .
Test 2. Bulk loading of keys in random order
To test random recording, the following db_bench settings were used (here’s the full listing of the command):
bpl=10485760;mcz=2;del=300000000;levels=2;ctrig=10000000; delay=10000000; stop=10000000; wbn=30; mbc=20; \ mb=1073741824;wbs=268435456; sync=0; r=50000000; t=1; vs=800; bs=65536; cs=1048576; of=500000; si=1000000; \ ./db_bench \ --benchmarks=fillrandom --disable_seek_compaction=1 --mmap_read=0 --statistics=1 --histogram=1 \ --num=$r --threads=$t --value_size=$vs --block_size=$bs --cache_size=$cs --bloom_bits=10 \ --cache_numshardbits=4 --open_files=$of --verify_checksum=1 \ --sync=$sync --disable_wal=1 --compression_type=zlib --stats_interval=$si --compression_ratio=0.5 \ --write_buffer_size=$wbs --target_file_size_base=$mb --max_write_buffer_number=$wbn \ --max_background_compactions=$mbc --level0_file_num_compaction_trigger=$ctrig \ --level0_slowdown_writes_trigger=$delay --level0_stop_writes_trigger=$stop --num_levels=$levels \ --delete_obsolete_files_period_micros=$del --min_level_to_compress=$mcz \ --stats_per_interval=1 --max_bytes_for_level_base=$bpl --memtablerep=vector --use_existing_db=0 \ --disable_auto_compactions=1 --allow_concurrent_memtable_write=false --db=/mnt/rocksdb/testb1 This test took us 1 hour and 6 minutes to complete , and the write speed was 273.36 MB / s. On the Microne, the test is performed in 3 hours and 30 minutes , and the recording speed fluctuates: the average value is 49.7 MB / s .
Test 3. Random Record
In this test, we tried to overwrite 500 million keys into the previously created database.
Here is the full listing of the db_bench command:
bpl=10485760;mcz=2;del=300000000;levels=6;ctrig=4; delay=8; stop=12; wbn=3; \ mbc=20; mb=67108864;wbs=134217728; sync=0; r=500000000; t=1; vs=800; \ bs=65536; cs=1048576; of=500000; si=1000000; \ ./db_bench \ --benchmarks=overwrite --disable_seek_compaction=1 --mmap_read=0 --statistics=1 \ --histogram=1 --num=$r --threads=$t --value_size=$vs --block_size=$bs \ --cache_size=$cs --bloom_bits=10 --cache_numshardbits=4 --open_files=$of \ --verify_checksum=1 --sync=$sync --disable_wal=1 \ --compression_type=zlib --stats_interval=$si --compression_ratio=0.5 \ --write_buffer_size=$wbs --target_file_size_base=$mb --max_write_buffer_number=$wbn \ --max_background_compactions=$mbc --level0_file_num_compaction_trigger=$ctrig \ --level0_slowdown_writes_trigger=$delay --level0_stop_writes_trigger=$stop \ --num_levels=$levels --delete_obsolete_files_period_micros=$del \ --min_level_to_compress=$mcz --stats_per_interval=1 \ --max_bytes_for_level_base=$bpl --use_existing_db=/mnt/rocksdb/testdb In this test, a very good result was obtained: 2 hours 51 minutes at a speed of 49 MB / s (at the time it was reduced to 38 MB / s ).
On Microne, the test takes a little more - 3 hours and 16 minutes ; the speed is about the same, but the vibrations are more pronounced.
Test 4. Random reading
The meaning of this test is to randomly read 500,000,000 keys from the database. Here is a complete listing of the db_bench command with all the options:
bpl=10485760;mcz=2;del=300000000;levels=6;ctrig=4; delay=8; stop=12; wbn=3; \ mbc=20; mb=67108864;wbs=134217728; sync=0; r=500000000; t=1; vs=800; \ bs=4096; cs=1048576; of=500000; si=1000000; \ ./db_bench \ --benchmarks=fillseq --disable_seek_compaction=1 --mmap_read=0 \ --statistics=1 --histogram=1 --num=$r --threads=$t --value_size=$vs \ --block_size=$bs --cache_size=$cs --bloom_bits=10 --cache_numshardbits=6 \ --open_files=$of --verify_checksum=1 --sync=$sync --disable_wal=1 \ --compression_type=none --stats_interval=$si --compression_ratio=0.5 \ --write_buffer_size=$wbs --target_file_size_base=$mb \ --max_write_buffer_number=$wbn --max_background_compactions=$mbc \ --level0_file_num_compaction_trigger=$ctrig \ --level0_slowdown_writes_trigger=$delay \ --level0_stop_writes_trigger=$stop --num_levels=$levels \ --delete_obsolete_files_period_micros=$del --min_level_to_compress=$mcz \ --stats_per_interval=1 --max_bytes_for_level_base=$bpl \ --use_existing_db=0 bpl=10485760;overlap=10;mcz=2;del=300000000;levels=6;ctrig=4; delay=8; \ stop=12; wbn=3; mbc=20; mb=67108864;wbs=134217728; sync=0; r=500000000; \ t=32; vs=800; bs=4096; cs=1048576; of=500000; si=1000000; \ ./db_bench \ --benchmarks=readrandom --disable_seek_compaction=1 --mmap_read=0 \ --statistics=1 --histogram=1 --num=$r --threads=$t --value_size=$vs \ --block_size=$bs --cache_size=$cs --bloom_bits=10 --cache_numshardbits=6 \ --open_files=$of --verify_checksum=1 --sync=$sync --disable_wal=1 \ --compression_type=none --stats_interval=$si --compression_ratio=0.5 \ --write_buffer_size=$wbs --target_file_size_base=$mb \ --max_write_buffer_number=$wbn --max_background_compactions=$mbc \ --level0_file_num_compaction_trigger=$ctrig \ --level0_slowdown_writes_trigger=$delay \ --level0_stop_writes_trigger=$stop --num_levels=$levels \ --delete_obsolete_files_period_micros=$del --min_level_to_compress=$mcz \ --stats_per_interval=1 --max_bytes_for_level_base=$bpl \ --use_existing_db=1 , : , . db_bench .
32 . .
Optane 5 2 , Microne — 6 .
Conclusion
Intel Optane SSD 750 . , . , . Intel .
, Optane . But it is better to see once than hear a hundred times. Optane . : , .
Optane , - .
IMDT (Intel Memory Drive) . , . .
Source: https://habr.com/ru/post/352622/
All Articles