How to solve 90% of NLP tasks: a step-by-step guide to natural language processing
It doesn't matter who you are a reputable company, or just about to launch your first service - you can always use text data to test your product, improve it and expand its functionality.
Natural language processing (NLP) is an actively developing scientific discipline that searches for meaning and learns from textual data.
Over the past year, the Insight team took part in work on several hundred projects, combining the knowledge and experience of leading companies in the United States. They summarized the results of this work in an article whose translation is now in front of you, and derived approaches to solving the most common applied problems of machine learning .
')
We will start with the simplest method that can work - and gradually move to more subtle approaches, such as feature engineering , word vectors and in-depth training.
After reading the article, you will know how:
The post is written in a walkthrough format; It can also be considered as a review of highly efficient standard approaches.
An original Jupyter Notepad is attached to the original post, demonstrating the use of all the mentioned techniques. We encourage you to use it as you read the article.
Processing natural language allows you to get new amazing results and is a very wide area. However, Insight has identified the following key aspects of practical application, which are much more common:
Despite the presence of a large number of scientific publications and tutorials on the topic of NLP on the Internet, today there are practically no full recommendations and tips on how to effectively deal with NLP tasks, while considering solutions to these problems from the very foundations.
Any machine learning task begins with the data — be it a list of email addresses, posts, or tweets. Common sources of textual information are:
To illustrate the approaches described, we will use the “Disasters in Social Media” data courtesy of CrowdFlower .
We set ourselves the task of determining which tweets are related to a catastrophe event as opposed to those tweets that relate to irrelevant topics (for example, films). Why do we need to do this? A potential use would be to notify officials of emergencies that require urgent attention — an overview of Adam Sandler’s latest film would have been ignored. The particular difficulty of this task lies in the fact that both of these classes contain the same search criteria, so we will have to use more subtle differences to separate them.
Further we will refer to catastrophe tweets as a “catastrophe” , and tweets about everything else as “irrelevant” .
Our data is tagged, so we know which categories the tweets belong to. As Richard Socher emphasizes, it’s usually faster, easier and cheaper to find and mark enough data on which the model will be trained - instead of trying to optimize a complex teaching method without a teacher.
Instead of spending a month on formulating a machine-learning task without a teacher, just spend a week sorting out the data and train the classifier.
One of the key skills of Data Scientist pro is knowing what the next step should be - working on a model or on data. As practice shows, it is better to first look at the data itself, and only then clean it up.
Net dataset will allow the model to learn significant signs and not to retrain on irrelevant noise.
This is followed by the checklist that is used when clearing our data (details can be found in the code ).
After we go through these steps and check for additional errors, we can start using clean, tagged data to train the models.
As an input, machine learning models take numeric values. For example, models working with images take a matrix representing the intensity of each pixel in each color channel.
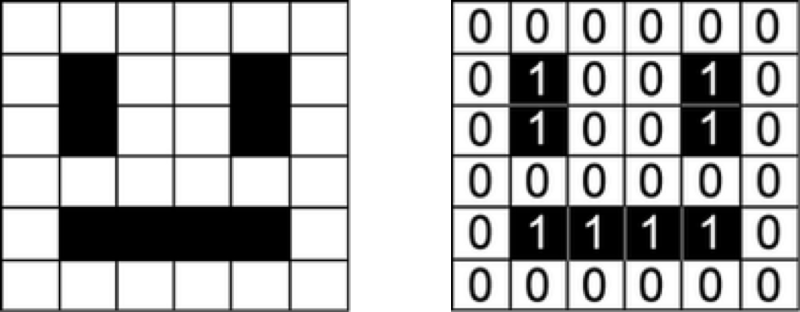
Smiling face represented as an array of numbers
Our dataset is a list of sentences, so in order for our algorithm to extract patterns from data, we first need to find a way to present it in such a way that our algorithm can understand it.
The natural way to display text in computers is to encode each character individually as a number (an example of such an approach is ASCII encoding). If we “feed” such a simple representation to the classifier, he will have to study the structure of words from scratch, based only on our data, which is impossible on most datasets. Therefore, we must use a higher level approach.
For example, we can build a dictionary of all unique words in our dataset, and associate a unique index to each word in the dictionary. Each sentence can then be displayed as a list, the length of which is equal to the number of unique words in our dictionary, and each index in this list will be stored how many times the word is found in the sentence. This model is called Bag of Words , since it is a display that completely ignores the word order of a sentence. Below is an illustration of this approach.
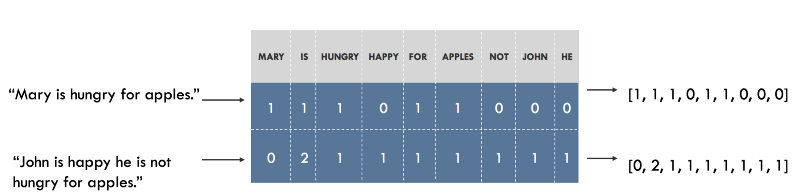
Presentation of sentences in the form of "bag of words." The original sentences are on the left, their presentation is on the right. Each index in the vectors represents one particular word.
The Social Media Crash Dictionary contains about 20,000 words. This means that each sentence will be reflected by a vector of length 20,000. This vector will contain mostly zeros , since each sentence contains only a small subset from our dictionary.
In order to find out whether our vector representations ( embeddings ) capture the information relevant to our task (for example, whether tweets are related to disasters or not), you should try to visualize them and see how well these classes are separated. Since dictionaries are usually very large and data cannot be visualized for 20,000 measurements, approaches like the principal component method (PCA) help project the data into two dimensions.

Visualization of vector representations for the "bag of words"
Judging by the resulting graphics, it does not seem that the two classes are divided as it should be - this may be a feature of our presentation or simply the effect of reducing the dimension. In order to find out whether the “bag of words” possibilities are useful for us, we can train a classifier based on them.
When you start a task for the first time, it’s common practice to start with the simplest method or tool that can solve this problem. When it comes to classifying data, the most common way is logistic regression because of its versatility and ease of interpretation. It is very easy to train, and its results can be interpreted, since you can easily extract all the most important coefficients from the model.
We divide our data into a training sample, which we will use to train our model, and a test sample - in order to see how well our model generalizes to data that we have not seen before. After training, we get an accuracy of 75.4%. Not so bad! Guessing the most frequent class (“irrelevant”) would give us only 57%.
However, even if the result with 75% accuracy would be enough for our needs, we should never use the model in production without trying to understand it.
The first step is to understand what types of errors our model makes, and with what types of errors we would like to see less often in the future. In the case of our example, false-positive results classify an irrelevant tweet as a catastrophe, false-negative ones classify a catastrophe as an irrelevant tweet. If our priority is to respond to each potential event, then we will want to reduce our false negative responses. However, if we are limited in resources, then we can prioritize a lower false-negative response rate to reduce the likelihood of a false alarm. A good way to visualize this information is to use the error matrix , which compares the predictions made by our model with actual labels. Ideally, this matrix would be a diagonal line running from the upper left to the lower right corner (this would mean that our predictions coincided perfectly with the truth).

Our classifier creates more false-negative than false-positive results (proportionally). In other words, the most frequent mistake of our model is inaccurate classification of catastrophes as irrelevant. If false positives reflect a high cost for law enforcement, then this could be a good option for our classifier.
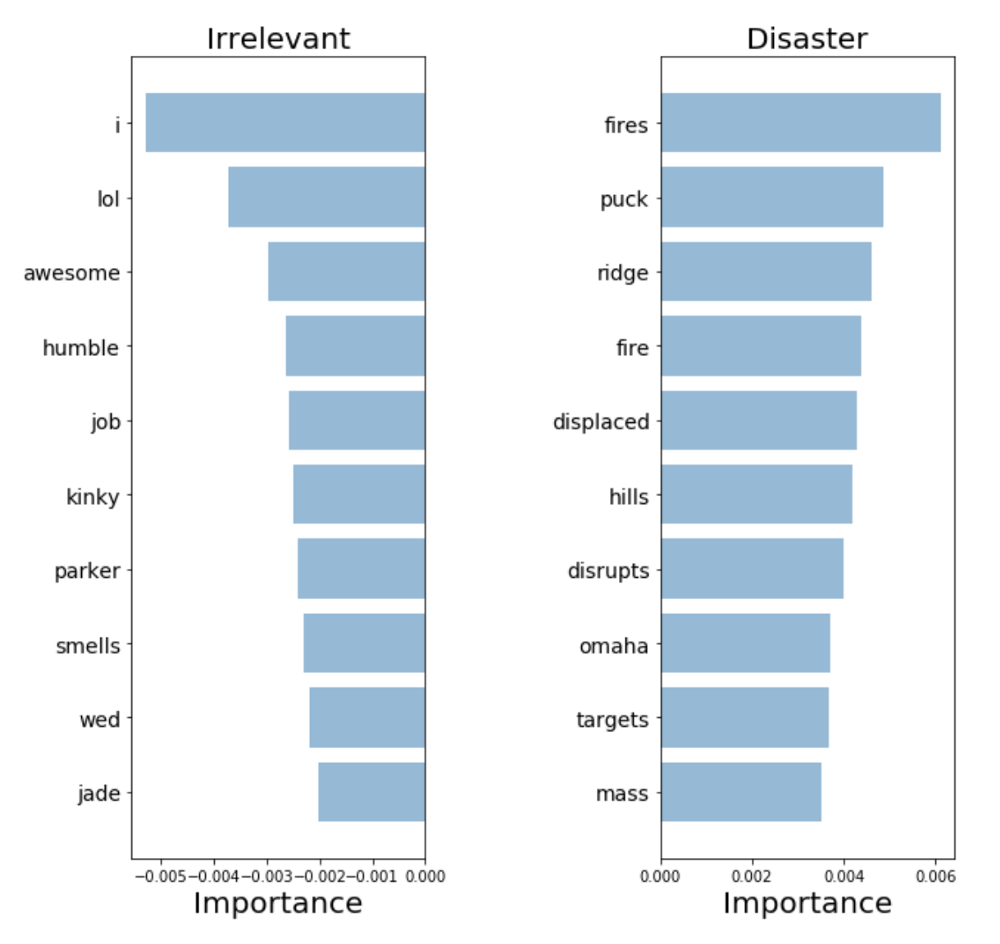
To validate our model and interpret its predictions, it is important to look at the words it uses to make decisions. If our data is biased, our classifier will produce accurate predictions on sample data, but the model will not be able to generalize them well enough in the real world. The diagram below shows the most significant words for classes of disasters and irrelevant tweets. Drawing up diagrams reflecting the significance of words is not difficult in the case of using the “bag of words” and logistic regression, since we simply extract and rank the coefficients that the model uses for its predictions.
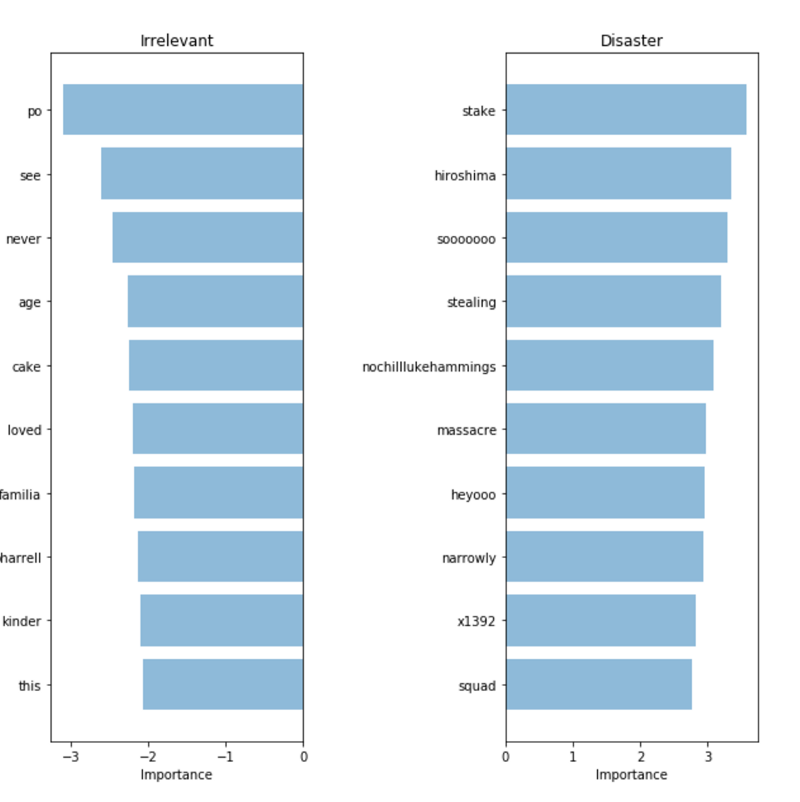
"Bag of words": the importance of words
Our classifier correctly found several patterns ( hiroshima - "Hiroshima", massacre - "massacre"), but it is clear that he retrained in some meaningless terms ("heyoo", "x1392"). So, now our “bag of words” deals with a huge dictionary of various words and all these words are equivalent for him. However, some of these words are very common, and only add noise to our predictions. Therefore, we will further try to find a way to present sentences in such a way that they can take into account the frequency of words, and see if we can get more useful information from our data.
To help our model focus on meaningful words, we can use TF-IDF ( Term Frequency, Inverse Document Frequency ) scoring on top of our word bag model. TF-IDF weighs on the basis of how rare they are in our dataset, lowering the priority of words that occur too often and just add noise. Below is the projection of the principal component method, allowing us to evaluate our new presentation.

Visualize a vector view using TF-IDF.
We can observe a clearer separation between the two colors. This indicates that our classifier should be easier to separate the two groups. Let's see how our results improve. By teaching another logistic regression on our new vector representations, we get an accuracy of 76.2% .
Very minor improvement. Maybe our model at least began to choose more important words? If the result obtained for this part is better, and we do not allow the model to "cheat", then this approach can be considered an improvement.
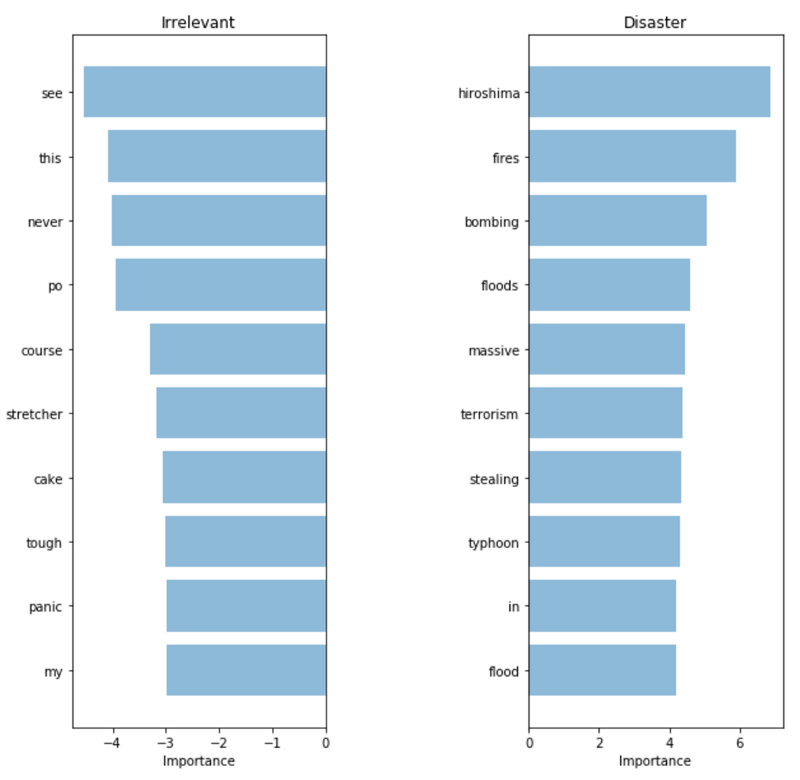
TF-IDF: Significance of Words
The words chosen by the model really look much more relevant. Despite the fact that the metrics on our test set increased only slightly, we now have much more confidence in using the model in a real system that will interact with customers.
Our latest model was able to “snatch” the words that carry the most meaning. However, most likely, when we release her in production, she will encounter words that have not been encountered in the training set — and will not be able to accurately classify these tweets, even if she saw very similar words during the training .
To solve this problem, we need to capture the semantic (semantic) meaning of words - this means that it is important for us to understand that the words “good” and “positive” are closer to each other than the words “apricot” and “continent”. We will use the Word2Vec tool that will help us match the meanings of words.
Word2Vec is a technique for finding continuous mappings for words. Word2Vec learns to read a huge amount of text and then memorize which word appears in similar contexts. After learning on enough data, Word2Vec generates a vector of 300 dimensions for each word in the dictionary, in which words with a similar meaning are located closer to each other.
The authors of the publication on the topic of continuous vector representations of words laid out in an open access model that was previously trained on a very large amount of information, and we can use it in our model to contribute knowledge about the semantic meaning of words. Pre-trained vectors can be taken in the repository mentioned in the article by reference .
A quick way to get suggestions for our classifier is to average Word2Vec scores for all words in our sentence. This is still the same approach as with the “bag of words” earlier, but this time we lose only the syntax of our sentence, while preserving the semantic (semantic) information.
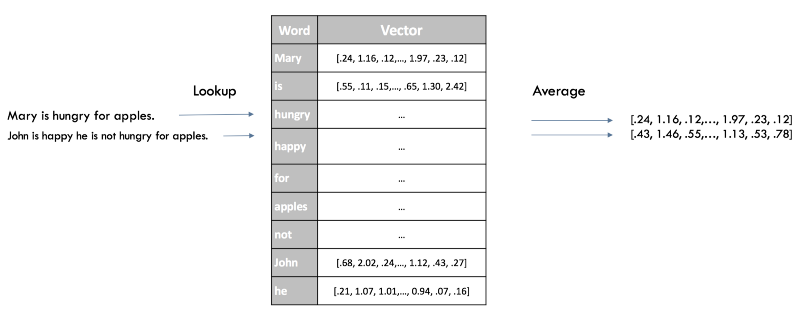
Word2Vec Vector Offerings
Here is a visualization of our new vector concepts after using the listed techniques:
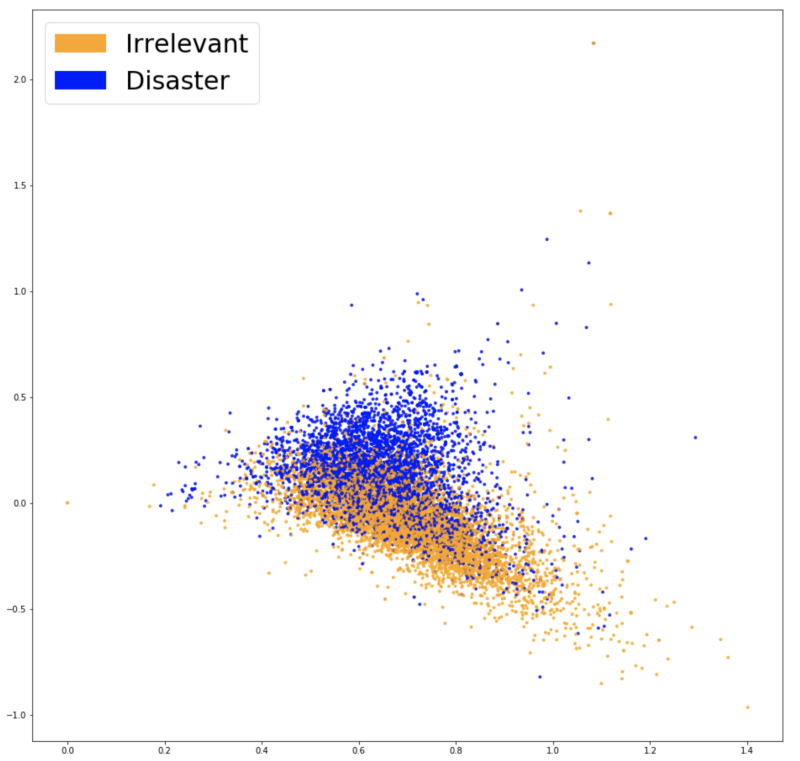
Visualization of vector representations Word2Vec.
Now the two groups of colors look separated even more, and this should help our classifier to find the difference between the two classes. After learning the same model for the third time (logistic regression), we get an accuracy of 77.7% - and this is our best result at the moment! It is time to explore our model.
Since our vector representations are no longer represented as a single-dimension vector per word, as was the case in previous models, it is now harder to understand which words are most relevant to our classification. Despite the fact that we still have access to the coefficients of our logistic regression, they relate to the 300 dimensions of our investments, and not to the indexes of words.
For such a small increase in accuracy, the complete loss of the ability to explain the work of the model is too hard a compromise. Fortunately, when working with more complex models, we can use interpreters like LIME , which are used to get some idea of how the classifier works.
LIME is available on Github as an open package. This black-box interpreter allows users to explain the solutions of any classifier on one specific example by changing the input (in our case, removing the word from the sentence) and observing how the prediction changes.
Let's take a look at a couple of explanations for sentences from our dataset.

The correct words of catastrophes are selected for classification as “relevant”.
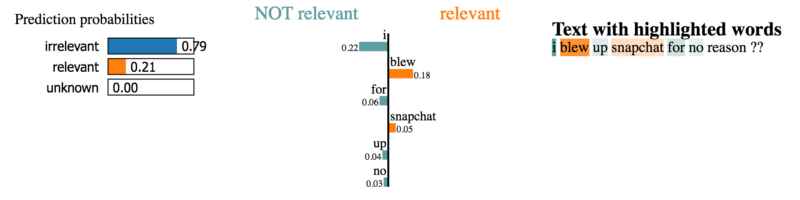
Here the contribution of words to the classification looks less obvious.
However, we do not have enough time to investigate thousands of examples from our dataset. Instead, let's run LIME on a representative sample of test data, and see which words occur regularly and make the most contribution to the final result. Using this approach, we can get estimates of the significance of words in the same way as we did for previous models, and validate the predictions of our model.
It seems that the model chooses highly relevant words and accordingly makes clear decisions. Compared to all previous models, she chooses the most relevant words, so it would be better to send her to the production.
We considered fast and efficient approaches for generating compact vector representations of sentences. However, omitting the word order, we discard all syntactic information from our sentences. If these methods do not provide sufficient results, you can use a more complex model that accepts whole expressions as input and predicts labels, without the need to construct an intermediate representation. A common way to do this is to consider a sentence as a sequence of individual word vectors using either Word2Vec, or more recent approaches like GloVe or CoVe . This is what we will do next.

High-performance model learning architecture without additional prior and post-processing (end-to-end, source )
Convolutional neural networks for proposal classification ( CNNs for Sentence Classification ) learn very quickly and can do an excellent service as an input level in the deep learning architecture. Despite the fact that convolutional neural networks (CNN) are mainly known for their high performance on image data, they show excellent results when working with textual data, and are usually much faster to learn than most complex NLP approaches (for example, LSTM networks and architecture encoder / decoder ). This model preserves word order and learns valuable information about which word sequences serve as prediction of our target classes. Unlike previous models, she is aware of the existence of a difference between the phrases “Lesha eats plants” and “Plants eat Lesha”.
Training this model will not require much more effort compared to previous approaches (see the code ), and, as a result, we will get a model that works much better than the previous one, allowing us to obtain an accuracy of 79.5% . As with the models we reviewed earlier, the next step should be to research and explain the predictions using the methods we described above to make sure that the model is the best option we can offer to users. By this point, you should already feel confident enough to handle the next steps yourself.
So, a summary of the approach that we have successfully applied in practice:
We considered these approaches on a concrete example using models that are designed to recognize, understand, and use short texts — for example, tweets; however, the same ideas are widely applicable to many different tasks .
Natural language processing (NLP) is an actively developing scientific discipline that searches for meaning and learns from textual data.
How can this article help you
Over the past year, the Insight team took part in work on several hundred projects, combining the knowledge and experience of leading companies in the United States. They summarized the results of this work in an article whose translation is now in front of you, and derived approaches to solving the most common applied problems of machine learning .
')
We will start with the simplest method that can work - and gradually move to more subtle approaches, such as feature engineering , word vectors and in-depth training.
After reading the article, you will know how:
- collect, prepare, and inspect data;
- build simple models and, if necessary, make the transition to deep learning;
- interpret and understand your models to make sure that you interpret the information, not the noise.
The post is written in a walkthrough format; It can also be considered as a review of highly efficient standard approaches.
An original Jupyter Notepad is attached to the original post, demonstrating the use of all the mentioned techniques. We encourage you to use it as you read the article.
Apply machine learning to understand and use text.
Processing natural language allows you to get new amazing results and is a very wide area. However, Insight has identified the following key aspects of practical application, which are much more common:
- Identifying different cohorts of users or customers (for example, predicting customer churn, total customer profits, product preferences)
- Accurate detection and extraction of various categories of feedback (positive and negative opinions, references to individual attributes like clothing size, etc.)
- Classification of the text in accordance with its meaning (request for elementary assistance, urgent problem).
Despite the presence of a large number of scientific publications and tutorials on the topic of NLP on the Internet, today there are practically no full recommendations and tips on how to effectively deal with NLP tasks, while considering solutions to these problems from the very foundations.
Step 1: Collect your data
Sample data sources
Any machine learning task begins with the data — be it a list of email addresses, posts, or tweets. Common sources of textual information are:
- Product Reviews (Amazon, Yelp and various app stores).
- User created content (tweets, Facebook posts, questions on StackOverflow).
- Diagnostic information (user requests, support tickets, chat logs).
Dataset "Disaster in social media"
To illustrate the approaches described, we will use the “Disasters in Social Media” data courtesy of CrowdFlower .
The authors reviewed over 10,000 tweets that were selected using various search queries such as "on fire", "quarantine" and "pandemonium." They then marked whether the tweet was related to a catastrophe event (as opposed to jokes using these words, movie reviews, or anything not related to disasters).
We set ourselves the task of determining which tweets are related to a catastrophe event as opposed to those tweets that relate to irrelevant topics (for example, films). Why do we need to do this? A potential use would be to notify officials of emergencies that require urgent attention — an overview of Adam Sandler’s latest film would have been ignored. The particular difficulty of this task lies in the fact that both of these classes contain the same search criteria, so we will have to use more subtle differences to separate them.
Further we will refer to catastrophe tweets as a “catastrophe” , and tweets about everything else as “irrelevant” .
Labels
Our data is tagged, so we know which categories the tweets belong to. As Richard Socher emphasizes, it’s usually faster, easier and cheaper to find and mark enough data on which the model will be trained - instead of trying to optimize a complex teaching method without a teacher.
Instead of spending a month on formulating a machine-learning task without a teacher, just spend a week sorting out the data and train the classifier.
Step 2. Clear your data
Rule number one: "Your model can only become so good
how good is your data
One of the key skills of Data Scientist pro is knowing what the next step should be - working on a model or on data. As practice shows, it is better to first look at the data itself, and only then clean it up.
Net dataset will allow the model to learn significant signs and not to retrain on irrelevant noise.
This is followed by the checklist that is used when clearing our data (details can be found in the code ).
- Delete all irrelevant characters (for example, any non-alphanumeric characters).
- Tokenize text by dividing it into individual words.
- Delete irrelevant words - for example, tweeting or URLs.
- Translate all characters in lower case so that the words “hello”, “Hello” and “HELLO” are considered the same word.
- Consider combining words that are misspelled or have alternative spellings (for example, cool / cool / kruuto)
- Consider the possibility of carrying out lemmatization , i.e., the information of various forms of one word to the dictionary form (for example, “machine” instead of “machine”, “by machine”, “machines”, etc.)
After we go through these steps and check for additional errors, we can start using clean, tagged data to train the models.
Step 3. Choose a good data presentation.
As an input, machine learning models take numeric values. For example, models working with images take a matrix representing the intensity of each pixel in each color channel.
Smiling face represented as an array of numbers
Our dataset is a list of sentences, so in order for our algorithm to extract patterns from data, we first need to find a way to present it in such a way that our algorithm can understand it.
One-hot encoding ("Bag of words")
The natural way to display text in computers is to encode each character individually as a number (an example of such an approach is ASCII encoding). If we “feed” such a simple representation to the classifier, he will have to study the structure of words from scratch, based only on our data, which is impossible on most datasets. Therefore, we must use a higher level approach.
For example, we can build a dictionary of all unique words in our dataset, and associate a unique index to each word in the dictionary. Each sentence can then be displayed as a list, the length of which is equal to the number of unique words in our dictionary, and each index in this list will be stored how many times the word is found in the sentence. This model is called Bag of Words , since it is a display that completely ignores the word order of a sentence. Below is an illustration of this approach.
Presentation of sentences in the form of "bag of words." The original sentences are on the left, their presentation is on the right. Each index in the vectors represents one particular word.
Visualize vector views.
The Social Media Crash Dictionary contains about 20,000 words. This means that each sentence will be reflected by a vector of length 20,000. This vector will contain mostly zeros , since each sentence contains only a small subset from our dictionary.
In order to find out whether our vector representations ( embeddings ) capture the information relevant to our task (for example, whether tweets are related to disasters or not), you should try to visualize them and see how well these classes are separated. Since dictionaries are usually very large and data cannot be visualized for 20,000 measurements, approaches like the principal component method (PCA) help project the data into two dimensions.
Visualization of vector representations for the "bag of words"
Judging by the resulting graphics, it does not seem that the two classes are divided as it should be - this may be a feature of our presentation or simply the effect of reducing the dimension. In order to find out whether the “bag of words” possibilities are useful for us, we can train a classifier based on them.
Step 4. Classification
When you start a task for the first time, it’s common practice to start with the simplest method or tool that can solve this problem. When it comes to classifying data, the most common way is logistic regression because of its versatility and ease of interpretation. It is very easy to train, and its results can be interpreted, since you can easily extract all the most important coefficients from the model.
We divide our data into a training sample, which we will use to train our model, and a test sample - in order to see how well our model generalizes to data that we have not seen before. After training, we get an accuracy of 75.4%. Not so bad! Guessing the most frequent class (“irrelevant”) would give us only 57%.
However, even if the result with 75% accuracy would be enough for our needs, we should never use the model in production without trying to understand it.
Step 5. Inspection
Error matrix
The first step is to understand what types of errors our model makes, and with what types of errors we would like to see less often in the future. In the case of our example, false-positive results classify an irrelevant tweet as a catastrophe, false-negative ones classify a catastrophe as an irrelevant tweet. If our priority is to respond to each potential event, then we will want to reduce our false negative responses. However, if we are limited in resources, then we can prioritize a lower false-negative response rate to reduce the likelihood of a false alarm. A good way to visualize this information is to use the error matrix , which compares the predictions made by our model with actual labels. Ideally, this matrix would be a diagonal line running from the upper left to the lower right corner (this would mean that our predictions coincided perfectly with the truth).
Our classifier creates more false-negative than false-positive results (proportionally). In other words, the most frequent mistake of our model is inaccurate classification of catastrophes as irrelevant. If false positives reflect a high cost for law enforcement, then this could be a good option for our classifier.
Explanation and interpretation of our model
To validate our model and interpret its predictions, it is important to look at the words it uses to make decisions. If our data is biased, our classifier will produce accurate predictions on sample data, but the model will not be able to generalize them well enough in the real world. The diagram below shows the most significant words for classes of disasters and irrelevant tweets. Drawing up diagrams reflecting the significance of words is not difficult in the case of using the “bag of words” and logistic regression, since we simply extract and rank the coefficients that the model uses for its predictions.
"Bag of words": the importance of words
Our classifier correctly found several patterns ( hiroshima - "Hiroshima", massacre - "massacre"), but it is clear that he retrained in some meaningless terms ("heyoo", "x1392"). So, now our “bag of words” deals with a huge dictionary of various words and all these words are equivalent for him. However, some of these words are very common, and only add noise to our predictions. Therefore, we will further try to find a way to present sentences in such a way that they can take into account the frequency of words, and see if we can get more useful information from our data.
Step 6. Consider the structure of the dictionary
TF-IDF
To help our model focus on meaningful words, we can use TF-IDF ( Term Frequency, Inverse Document Frequency ) scoring on top of our word bag model. TF-IDF weighs on the basis of how rare they are in our dataset, lowering the priority of words that occur too often and just add noise. Below is the projection of the principal component method, allowing us to evaluate our new presentation.
Visualize a vector view using TF-IDF.
We can observe a clearer separation between the two colors. This indicates that our classifier should be easier to separate the two groups. Let's see how our results improve. By teaching another logistic regression on our new vector representations, we get an accuracy of 76.2% .
Very minor improvement. Maybe our model at least began to choose more important words? If the result obtained for this part is better, and we do not allow the model to "cheat", then this approach can be considered an improvement.
TF-IDF: Significance of Words
The words chosen by the model really look much more relevant. Despite the fact that the metrics on our test set increased only slightly, we now have much more confidence in using the model in a real system that will interact with customers.
Step 7. Apply semantics
Word2vec
Our latest model was able to “snatch” the words that carry the most meaning. However, most likely, when we release her in production, she will encounter words that have not been encountered in the training set — and will not be able to accurately classify these tweets, even if she saw very similar words during the training .
To solve this problem, we need to capture the semantic (semantic) meaning of words - this means that it is important for us to understand that the words “good” and “positive” are closer to each other than the words “apricot” and “continent”. We will use the Word2Vec tool that will help us match the meanings of words.
Use of pre-training results
Word2Vec is a technique for finding continuous mappings for words. Word2Vec learns to read a huge amount of text and then memorize which word appears in similar contexts. After learning on enough data, Word2Vec generates a vector of 300 dimensions for each word in the dictionary, in which words with a similar meaning are located closer to each other.
The authors of the publication on the topic of continuous vector representations of words laid out in an open access model that was previously trained on a very large amount of information, and we can use it in our model to contribute knowledge about the semantic meaning of words. Pre-trained vectors can be taken in the repository mentioned in the article by reference .
Offer Level Display
A quick way to get suggestions for our classifier is to average Word2Vec scores for all words in our sentence. This is still the same approach as with the “bag of words” earlier, but this time we lose only the syntax of our sentence, while preserving the semantic (semantic) information.
Word2Vec Vector Offerings
Here is a visualization of our new vector concepts after using the listed techniques:
Visualization of vector representations Word2Vec.
Now the two groups of colors look separated even more, and this should help our classifier to find the difference between the two classes. After learning the same model for the third time (logistic regression), we get an accuracy of 77.7% - and this is our best result at the moment! It is time to explore our model.
Compromise between complexity and explicability
Since our vector representations are no longer represented as a single-dimension vector per word, as was the case in previous models, it is now harder to understand which words are most relevant to our classification. Despite the fact that we still have access to the coefficients of our logistic regression, they relate to the 300 dimensions of our investments, and not to the indexes of words.
For such a small increase in accuracy, the complete loss of the ability to explain the work of the model is too hard a compromise. Fortunately, when working with more complex models, we can use interpreters like LIME , which are used to get some idea of how the classifier works.
LIME
LIME is available on Github as an open package. This black-box interpreter allows users to explain the solutions of any classifier on one specific example by changing the input (in our case, removing the word from the sentence) and observing how the prediction changes.
Let's take a look at a couple of explanations for sentences from our dataset.
The correct words of catastrophes are selected for classification as “relevant”.
Here the contribution of words to the classification looks less obvious.
However, we do not have enough time to investigate thousands of examples from our dataset. Instead, let's run LIME on a representative sample of test data, and see which words occur regularly and make the most contribution to the final result. Using this approach, we can get estimates of the significance of words in the same way as we did for previous models, and validate the predictions of our model.
It seems that the model chooses highly relevant words and accordingly makes clear decisions. Compared to all previous models, she chooses the most relevant words, so it would be better to send her to the production.
Step 8. Using syntax with end-to-end approaches
We considered fast and efficient approaches for generating compact vector representations of sentences. However, omitting the word order, we discard all syntactic information from our sentences. If these methods do not provide sufficient results, you can use a more complex model that accepts whole expressions as input and predicts labels, without the need to construct an intermediate representation. A common way to do this is to consider a sentence as a sequence of individual word vectors using either Word2Vec, or more recent approaches like GloVe or CoVe . This is what we will do next.
High-performance model learning architecture without additional prior and post-processing (end-to-end, source )
Convolutional neural networks for proposal classification ( CNNs for Sentence Classification ) learn very quickly and can do an excellent service as an input level in the deep learning architecture. Despite the fact that convolutional neural networks (CNN) are mainly known for their high performance on image data, they show excellent results when working with textual data, and are usually much faster to learn than most complex NLP approaches (for example, LSTM networks and architecture encoder / decoder ). This model preserves word order and learns valuable information about which word sequences serve as prediction of our target classes. Unlike previous models, she is aware of the existence of a difference between the phrases “Lesha eats plants” and “Plants eat Lesha”.
Training this model will not require much more effort compared to previous approaches (see the code ), and, as a result, we will get a model that works much better than the previous one, allowing us to obtain an accuracy of 79.5% . As with the models we reviewed earlier, the next step should be to research and explain the predictions using the methods we described above to make sure that the model is the best option we can offer to users. By this point, you should already feel confident enough to handle the next steps yourself.
Finally
So, a summary of the approach that we have successfully applied in practice:
- We start with a quick and simple model;
- explain her predictions;
- we understand what kinds of mistakes she makes;
- We use our knowledge to make a decision about the next step - whether it is working on data or on a more complex model.
We considered these approaches on a concrete example using models that are designed to recognize, understand, and use short texts — for example, tweets; however, the same ideas are widely applicable to many different tasks .
As already noted in the article, anyone can benefit by applying methods of machine learning, especially in the Internet world, with all the variety of analytical data. Therefore, the topics of artificial intelligence and machine learning are certainly discussed at our conferences RIT ++ and Highload ++ , and from a completely practical point of view, as in this article. Here, for example, is a video of several performances last year:
- Search for signs of fraud in medical insurance losses / Vasily Ryazanov (Allianz)
- Ranking of candidate responses using machine learning / Sergey Saigushkin (Superjob)
- Machine learning in e-commerce / Alexander Serbul (1C-Bitrix)
- Application of machine learning for generating structured snippets / Nikita Spirin (Datastars)
The program of the May festival RIT ++ and June Highload ++ Siberia is on the way, you can follow the current status on conference sites or subscribe to the newsletter , and we will periodically send announcements of approved reports so that you don’t miss anything.
Source: https://habr.com/ru/post/352614/
All Articles