Using the Python Control Systems Library for designing automatic control systems

Hello!
With the advent of the Python Control Systems Library [1], the solution of the main problems of designing automatic control systems (ACS) using Python tools has become much simpler and is now almost identical to solving such problems in the Matlab mathematical package.
However, the design of control systems with the use of this library has a number of significant features that are not in the documentation [1], therefore this publication is dedicated to the use of Python Control Systems Librar.
Let's start with the installation of the library. The documentation talks about loading two slycot and control modules, in fact, for normal operation, you also need the numpy + mkl library, the rest are installed automatically when the control is loaded.
')
These modules can be downloaded from the site [2]. The documentation also says that for the default interface you just need to import a control package as follows: import control .
However, with this import, the library does not work for any of the examples. To import a library, you must use from control import * as well as for importing the matlab: from control environment . matlab import * [1].
Consider the specialized library of the Python Control Systems Library can only be applied to the problems of the design of automatic control systems, so we do.
1. Models of system connections (tf and feedback functions)
Enter transfer functions:
# -*- coding: utf8 -*- from control.matlab import * f = tf(1, [1, 1]); g = tf(1, [2 ,1]); Parallel connection of blocks or systems:
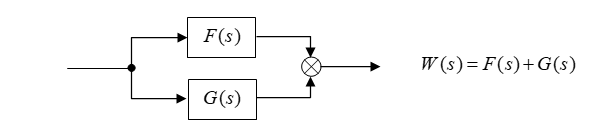
# -*- coding: utf8 -*- from control.matlab import * f = tf(1, [1, 1]); g = tf(1, [2 ,1]); w = f + g print (w) (3 s + 2)/(s^2 + 3 s + 1)Consecutive connection of blocks or systems:
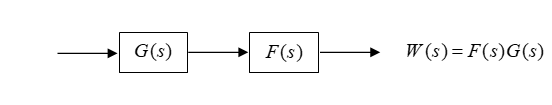
# -*- coding: utf8 -*- from control.matlab import * f = tf(1, [1, 1]); g = tf(1, [2 ,1]); w = f* g print (w) 1/(2 s^2 + 3 s + 1)Feedback loop:
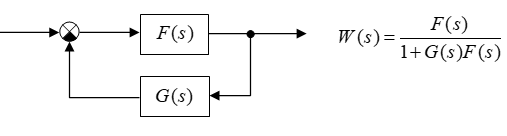
a) Negative feedback loop:
# -*- coding: utf8 -*- from control.matlab import * f = tf(1, [1, 1]); g = tf(1, [2 ,1]); w = feedback(f, g) print(w) (2 s + 1)/(2 s^2 + 3 s + 2)b) Contour with positive feedback:
# -*- coding: utf8 -*- from control.matlab import * f = tf(1, [1, 1]); g = tf(1, [2 ,1]); w = f/(1-f*g) print(w) (2 s^2 + 3 s + 1)/(2 s^3 + 5 s^2 + 3 s)Conclusion:
With the help of the tf and feedback functions, you can model the connections of blocks and systems.
2. Dynamic and frequency characteristics of automatic control systems (ACS)
Let's set the transfer function of the ACS:

Find its dynamic and frequency characteristics:
# -*- coding: utf8 -*- from control.matlab import * """ LTI- w, :""" num= [1., 2.] den= [3., 4., 5.,3] w= tf(num, den) """ pole, zero""" print(' : \n %s'%w) print(": \n %s"%pole(w)) print(":\n %s -\n "%zero(w)) SAU transfer function:
( s + 2)/(3 s^3 + 4 s^2 + 5 s + 3)Poles:
-0.26392546+1.08251346j
-0.26392546-1.08251346j
-0. 80548241+0.j
: -2
Construct a transition function with the step (w) command:
# -*- coding: utf8 -*- from control.matlab import * import matplotlib.pyplot as plt """ LTI- w, :""" num= [1., 2.] den= [3., 4., 5.,3] w= tf(num, den) y,x=step(w) plt.plot(x,y,"b") plt.title('Step Responsse ') plt.ylabel('Amplitude') plt.xlabel('Time(sec)') plt.grid(True) plt.show() 
Let's build an impulse transient function with the impulse (w) command:
# -*- coding: utf8 -*- from control.matlab import * import matplotlib.pyplot as plt """ LTI- w, :""" num= [1., 2.] den= [3., 4., 5.,3] w= tf(num, den) y,x=impulse(w) plt.plot(x,y,"r") plt.title('impulse Responsse ') plt.ylabel('Amplitude') plt.xlabel('Time(sec)') plt.grid(True) plt.show() 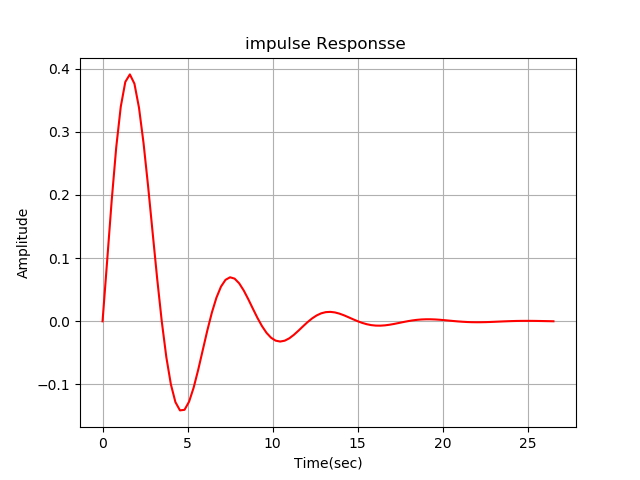
A bode diagram is obtained using the bode (w) command:
# -*- coding: utf8 -*- from control.matlab import * import matplotlib.pyplot as plt """ LTI- w, :""" num= [1., 2.] den= [3., 4., 5.,3] w= tf(num, den) mag, phase, omega = bode(w, dB=True) plt.plot() plt.show() 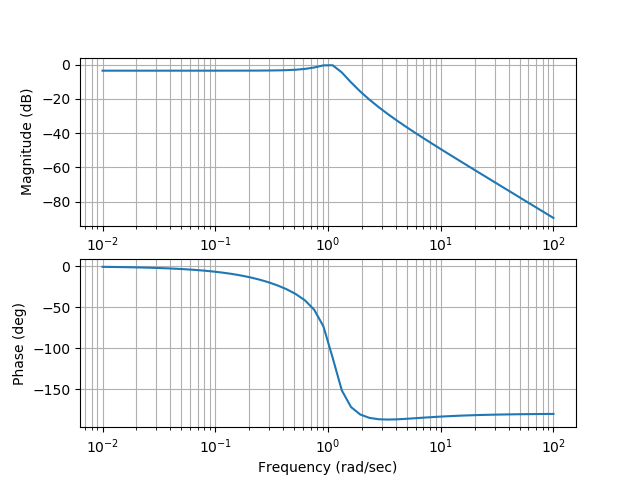
Conclusion:
Building a bode chart has some features listed in the listing.
Construct a Nyquist diagram with the nyquist (w) command:
import matplotlib.pyplot as plt from control.matlab import * num= [1., 2.] den= [3., 4., 5.,3] w= tf(num, den) plt.title('Nyquist Diagram ') plt.ylabel('Imaginary Axis') plt.xlabel('Real Axis') nyquist(w) plt.grid(True) plt.plot() plt.show() 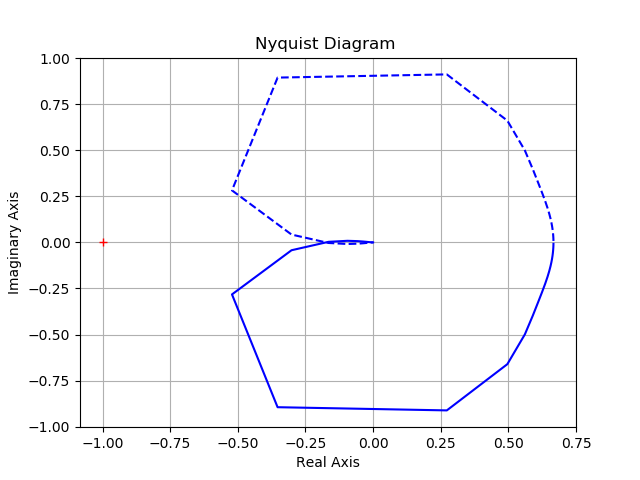
Conclusion:
The construction of the Nyquist chart has some features shown in the listing.
We looked at simple tasks, now we’ll try to preload the Python Control Systems Library library quite a bit.
3. Find the discrete transfer function of the actuator, the equations of state of which are:
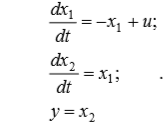 (one)
(one)To calculate, we use the matrix exponent:
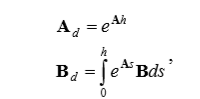 (2)
(2)where h is the quantization interval.
We find its Laplace transform of (2), which will be equal to.
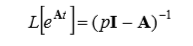 (3)
(3)where I is the identity matrix.
After substitution of matrix A in (3), we obtain.
 (four)
Calculate the inverse matrix.
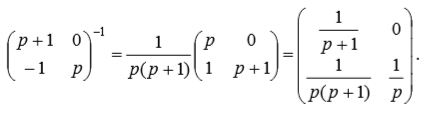 (five)
Whence, performing the z - transformation of the last matrix, we find the transition matrix of the discrete system Ad.
 (6)
(6)where h is the sampling interval in time.
The matrix Bd in accordance with (2) will be equal to.

Then the discrete analogue of the actuator model will look like:
 (7)
(7)This Python Control Systems Library example for h = 0.1 is written as:
# -*- coding: utf8 -*- import matplotlib.pyplot as plt from control.matlab import * import numpy as np A=np.matrix([[-1,0],[1,0]]) B=np.matrix([[1],[0]]) C=np.matrix([[0,1]]) D=0 sn=ss(A,B,C,D) wd=tf(sn) print(" : \n %s"%sn) print(" \n %s"%wd) y,x=step(wd) plt.plot(x,y,"b") plt.title('Step Responsse ') plt.ylabel('Amplitude') plt.xlabel('Time(sec)') plt.grid(True) plt.show() h=1 sd=c2d(sn,h) print(" : \n %s"%sd) Transmission function
1 / (s ^ 2 + s)

Continuous model:
A = [[-1 0] [ 1 0]] B = [[1] [0]] C = [[0 1]] D = [[0]] Discrete model:
A = [[0.36787944 0. ] [0.63212056 1. ]] B = [[0.63212056] [0.36787944]] C = [[0 1]] D = [[0]] dt = 1 Conclusion:
Using a library in Python Control Systems Library, a mathematical model of the actuator based on the system of differential equations (1) was obtained. The model used matrix operators.
I am sure that Python lovers will like the new library, which significantly expands the capabilities of your favorite programming language. However, readers know that any new library requires great effort to adapt it to real problems and only after that it becomes popular and popular.
Thank you all for your attention!
References:
1. Python Control Systems.
2. Unofficial Windows Binaries for Python Extension Packages.
Source: https://habr.com/ru/post/352492/
All Articles