Miners succeeded cryptographers
At Solar JSOC, we continuously collect data on information security events and incidents in customer infrastructures. On the basis of this information, we do analytics every six months, which demonstrates how attacks on Russian organizations change. Today we have collected for you the most interesting trends of the second half of 2017.

So, to begin with, some general statistics, and then we will consider the threats and attack vectors in more detail.
In total, for the second half of 2017, the flow of IS events amounted to about 8.243 billion (in the first half of the year - 6.156 billion). Of these, about 1,270 per day (a total of 231,623 in six months) are events with suspicion of an incident that needed to be examined by an analyst.
')
Approximately every sixth incident was classified as critical. In our terminology, incidents that potentially lead to financial losses in excess of 1 million rubles, compromise of confidential information, or shutdown of critical business systems are considered critical.
This time we compared the performance of all key metrics for 4 years, and in some places it gave interesting results. For example, it turned out that every year the share of critical incidents is steadily growing. If in the first half of 2015 this figure was 8.1%, then in the second half of 2017 it was already 15.5% (with an increase in the number of customers).
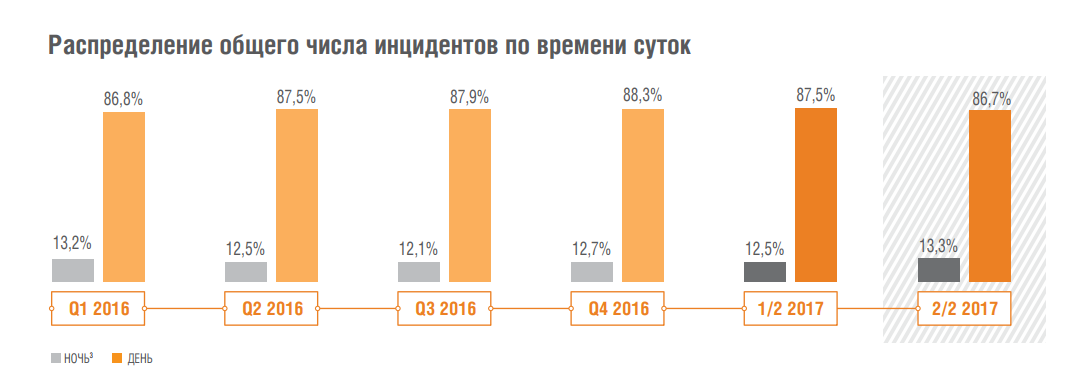
Most of all incidents (86.7%) occurred during the day, but if we talk about critical external incidents, then in 58.7% of cases they occurred at night. This is the highest figure in the last four years.
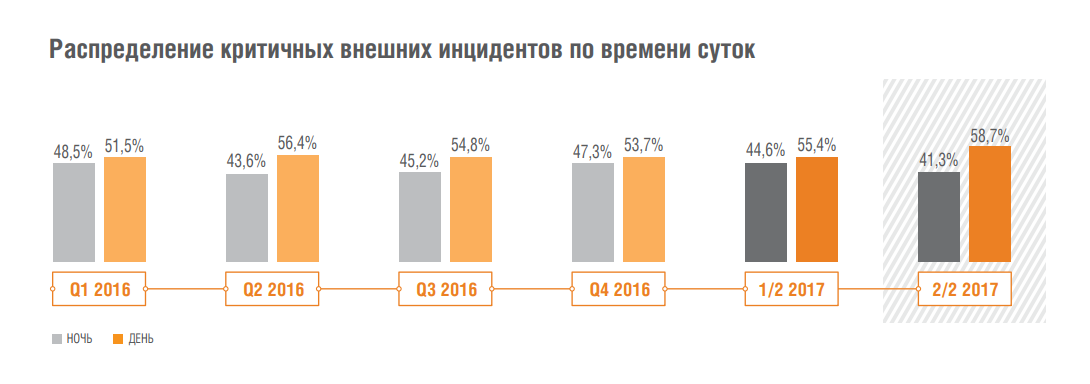
This phenomenon is quite understandable: it is likely that a night incident will not be detected immediately, and cybercriminals will have more time to consolidate in the infrastructure or even to penetrate the target segments, which allow monetizing the attack.
Separately, we consider incidents that constitute Kill Chain - a chain of sequential actions of a cybercriminal aimed at hacking the infrastructure and compromising the company's key resources. The classic and most common Kill Chain scheme looks like this:

It would seem that ordinary users are constantly told about the threats emanating from the web. However, social engineering is still strikingly effective. In the second half of 2017, in 65% of cases, it was she who was used to penetrate the infrastructure of the company. At the same time, in the first half of the year this figure was 54%. Users opened malicious attachments and passed through phishing links, thereby downloading malicious software that served the purposes of cybercriminals.
Speaking of malware, we can note that the number of infections by encryption viruses compared to the first half of 2017 decreased by about a third. But their place was quickly taken by the miners.
It is curious that in relation to the mining software there is a certain industry specificity. So, in banks they are most often found on workstations that were infected through mail or infected sites and, as a rule, as part of malware packages.
Outside the financial sector, the situation is different: on average, in every third organization, we record incidents when miners on the server equipment of a company are installed directly by employees of the IT department.
In general, external attackers most often attack web applications of organizations (32.3%), in 22.8% they resort to brute-force and compromising the credentials of external client services, in 22.1% of cases they are trying to implement malicious BY.

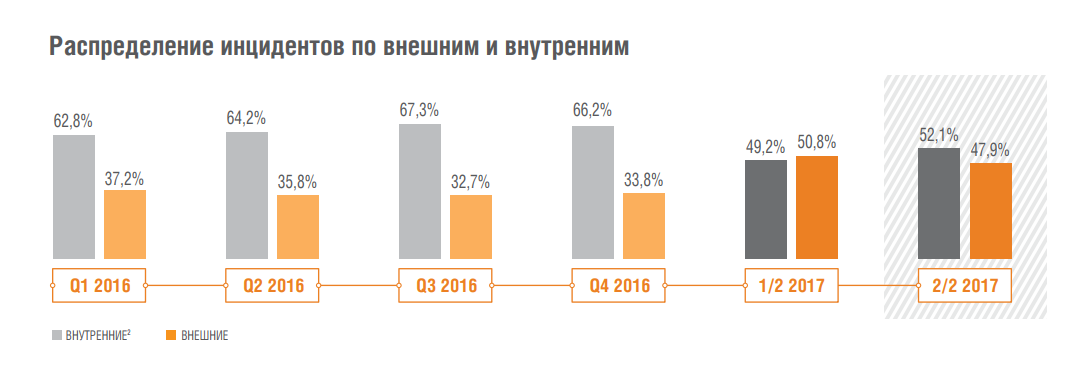
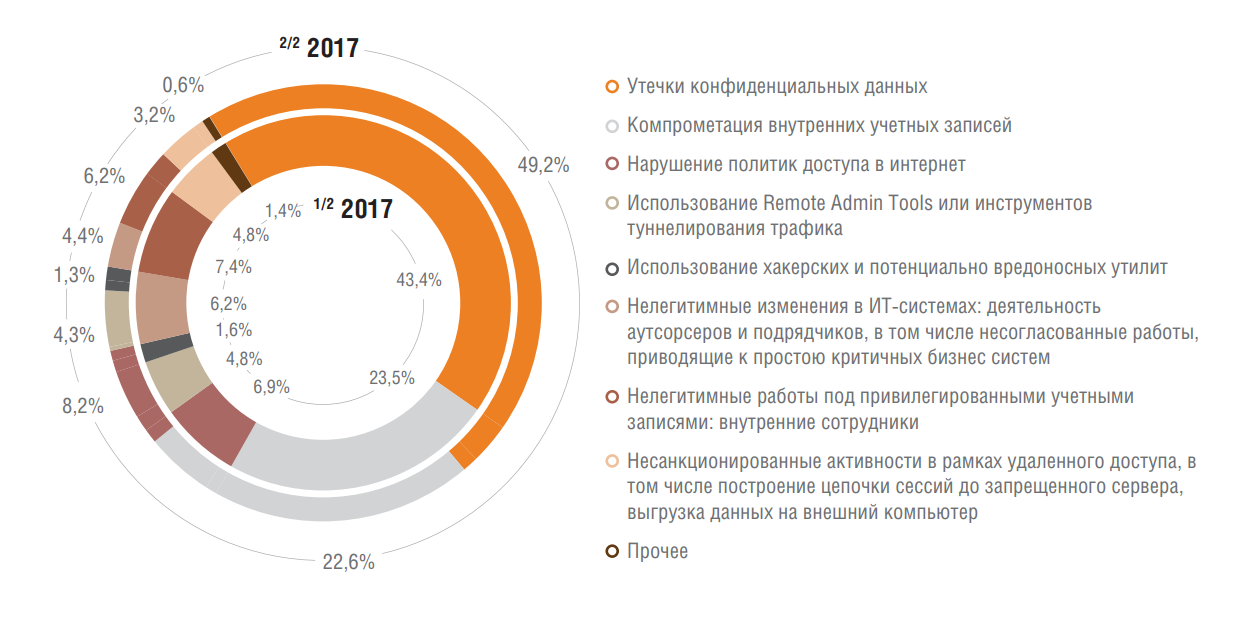
The incidents related to the actions of internal intruders were distributed as follows: leakage of confidential data - 48.2%, compromise of internal accounts - 22.6%, violation of Internet access policies - 8.2%. Note that leaks are almost half of all internal incidents. Apparently, the desire to increase their value in the eyes of other potential employers often proves irresistible.
In the second half of 2017, the number of incidents that were caused by the IT administrators of companies increased significantly (from 25.6% to 31.3%). This includes confidential information leaks and non-compliance with information security policies by the IT department. It can be assumed that such figures are associated with poor control over these employees (or the ability of IT professionals to circumvent technical protection tools).

In addition, some time ago we told you how to build the process of using external sources of data on threats. Here are the types of Threat Intelligence we use ourselves:
And which of them were most useful in the second half of 2017:
So, to begin with, some general statistics, and then we will consider the threats and attack vectors in more detail.
In total, for the second half of 2017, the flow of IS events amounted to about 8.243 billion (in the first half of the year - 6.156 billion). Of these, about 1,270 per day (a total of 231,623 in six months) are events with suspicion of an incident that needed to be examined by an analyst.
')
Approximately every sixth incident was classified as critical. In our terminology, incidents that potentially lead to financial losses in excess of 1 million rubles, compromise of confidential information, or shutdown of critical business systems are considered critical.
This time we compared the performance of all key metrics for 4 years, and in some places it gave interesting results. For example, it turned out that every year the share of critical incidents is steadily growing. If in the first half of 2015 this figure was 8.1%, then in the second half of 2017 it was already 15.5% (with an increase in the number of customers).
The number of attacks on companies since 2014 has increased by an average of 26%.
Most of all incidents (86.7%) occurred during the day, but if we talk about critical external incidents, then in 58.7% of cases they occurred at night. This is the highest figure in the last four years.
This phenomenon is quite understandable: it is likely that a night incident will not be detected immediately, and cybercriminals will have more time to consolidate in the infrastructure or even to penetrate the target segments, which allow monetizing the attack.
Kill chain
Separately, we consider incidents that constitute Kill Chain - a chain of sequential actions of a cybercriminal aimed at hacking the infrastructure and compromising the company's key resources. The classic and most common Kill Chain scheme looks like this:
It would seem that ordinary users are constantly told about the threats emanating from the web. However, social engineering is still strikingly effective. In the second half of 2017, in 65% of cases, it was she who was used to penetrate the infrastructure of the company. At the same time, in the first half of the year this figure was 54%. Users opened malicious attachments and passed through phishing links, thereby downloading malicious software that served the purposes of cybercriminals.
Speaking of malware, we can note that the number of infections by encryption viruses compared to the first half of 2017 decreased by about a third. But their place was quickly taken by the miners.
It is curious that in relation to the mining software there is a certain industry specificity. So, in banks they are most often found on workstations that were infected through mail or infected sites and, as a rule, as part of malware packages.
Outside the financial sector, the situation is different: on average, in every third organization, we record incidents when miners on the server equipment of a company are installed directly by employees of the IT department.
In general, external attackers most often attack web applications of organizations (32.3%), in 22.8% they resort to brute-force and compromising the credentials of external client services, in 22.1% of cases they are trying to implement malicious BY.
The incidents related to the actions of internal intruders were distributed as follows: leakage of confidential data - 48.2%, compromise of internal accounts - 22.6%, violation of Internet access policies - 8.2%. Note that leaks are almost half of all internal incidents. Apparently, the desire to increase their value in the eyes of other potential employers often proves irresistible.
In the second half of 2017, the number of incidents that were caused by the IT administrators of companies increased significantly (from 25.6% to 31.3%). This includes confidential information leaks and non-compliance with information security policies by the IT department. It can be assumed that such figures are associated with poor control over these employees (or the ability of IT professionals to circumvent technical protection tools).
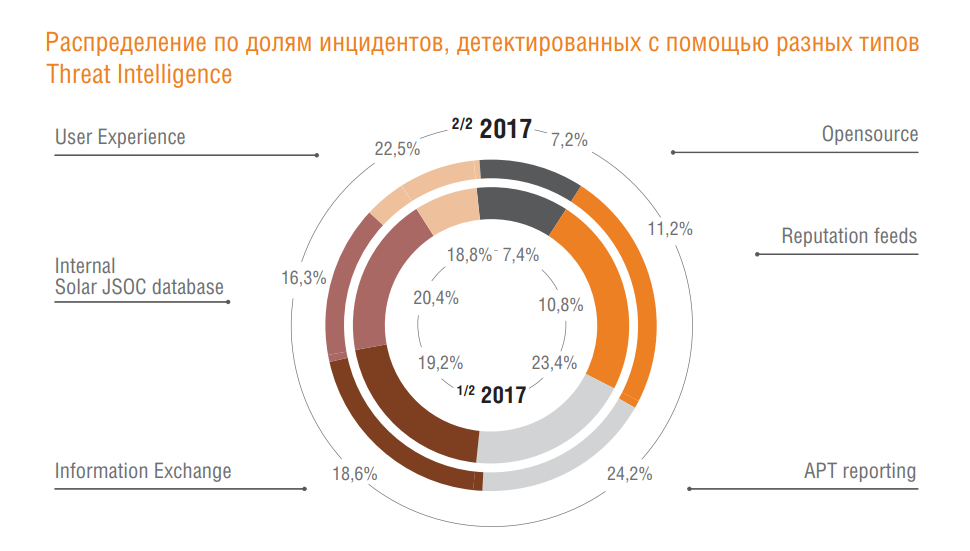
In addition, some time ago we told you how to build the process of using external sources of data on threats. Here are the types of Threat Intelligence we use ourselves:
- Opensource - open database of indicators of malware, management servers and phishing links. As a rule, only network indicators are relevant in the context of detection using SIEM platforms.
- Reputation feeds are paid subscriptions to reputation lists of malware, management servers, and phishing links. As a rule, only network indicators are relevant in the context of detection using SIEM platforms.
- APT / IOC reporting - paid subscriptions to detailed descriptions of 0day malware, including, among other things, a description of the vulnerabilities used and host indicators of malware.
- Information Exchange - information obtained in the framework of information exchanges with state, departmental and foreign incident response centers (CERT).
- Internal Solar JSOC database - indicators obtained as a result of Solar JSOC own investigations or incident investigations.
- User experience - information obtained directly from users of clients (successful counteraction to social engineering, detection of phishing mailings, etc.).
And which of them were most useful in the second half of 2017:
Source: https://habr.com/ru/post/352338/
All Articles