Automation in the development of the platform "1C: Enterprise"
This article will discuss how we automate the development and testing processes of the 1C: Enterprise 8 technology platform. The 1C: Enterprise 8 platform is a set of tools for creating business applications and their execution environment. This is a large (more than ten million lines of code) project in C ++, Java and JavaScript. Dozens of programmers are working on it, simultaneously developing and supporting up to 10 different versions of the product.
The platform works on various OS and DB versions:
Supports several types of clients:
')
Considering that it is necessary to support a number of versions of the above operating systems, DBMS and browsers, platform testing becomes a non-trivial task.
The goals that we set for ourselves:
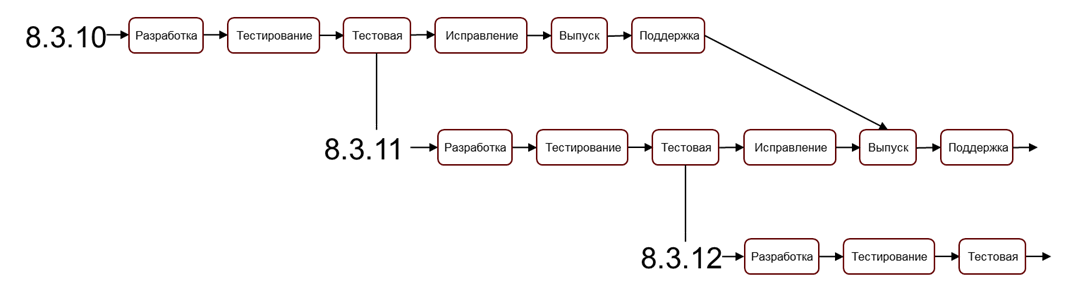
Simultaneous development of multiple platform versions
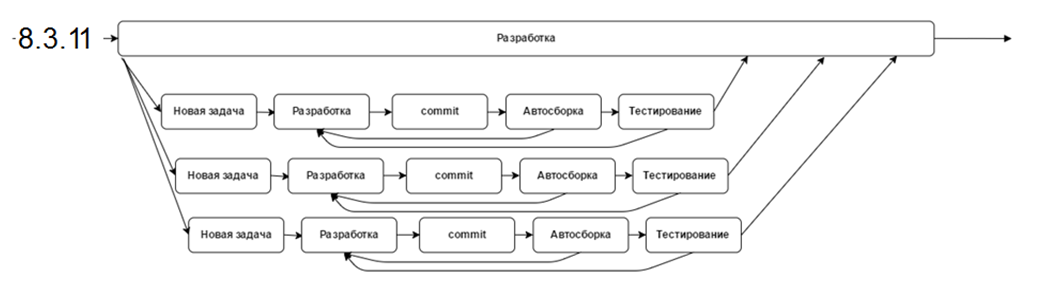
We use the practice of Continuous Integration (CI); The merging of working copies of the code into the general main branch occurs several times a day; after the merge, the automatic assembly and autotesting of the modified project is performed. If there are problems during assembly or testing, the modified code is returned for revision.
Development processes of one version of the platform
Tasks for CI:
Automatic assembly with us are several times a day. A full cycle of automatic testing takes about a day, which for some tasks, unfortunately, is unacceptably long (balancing testing resources speeds up the process if there are free resources - if there are any at the moment). To neutralize this negative effect, we develop a “lightweight” version of the tests, which should be run in an hour and affect about 80% of the functionality. Thus, a general understanding of how efficient a build is is that we can get much faster. There may be occasions when an hour is not needed.
Now, when testing, the results of previous testing cycles are taken into account, and problem / new / corrected tests are launched with a higher priority, which allows you to see the progress of changes on the most modified functionality immediately at the beginning of testing.
For some type of builds, the rule “10 failures” is adopted, when a series of tests is automatically interrupted when 10 failures are reached within one series, in order to free up resources for testing other builds / other versions, etc.
About 70 physical servers and about 1500 virtual servers participate in our build and testing.
We use Jenkins as a continuous integration system. During peak periods, it performs from 20 platform assemblies per day; It takes about 1.5 hours for one complete assembly, and 1 hour for testing. The build is carried out in parallel along architectures (Windows, Linux, macOS), each build is in hundreds of threads at the same time. A few years ago, this approach allowed us to reduce the build time of one version of the platform with all architectures from 8 hours to 80 minutes, and we are not going to stop there.
Through web services, Jenkins is integrated with our task tracker, Task Base (written on the 1C: Enterprise platform), and in case of problems, automatically initiates errors directly in the Task Base, putting links to test logs and artifacts. Jenkins also prepares the platform for publication, if necessary, filters and parses dumps.
Jenkins also manages testing, allowing you to implement arbitrarily complex scenarios on arbitrary hardware configurations, including a large number of virtual machines, and also does additional work, for example, delivering and installing a platform for 1,500 servers up to 70 times a day.
JMeter has a very valuable quality - it has low hardware requirements for emulating a large number of users. Also JMeter allows you to generate a mixed load in one test - HTTP, SOAP, JDBC, LDAP, SMTP, TCP.
In particular, we use JMeter to test the performance of an application cluster and its individual components, as well as for load testing an application cluster with a large number (up to 10,000) of users. For this test, one DB server, two 1C servers and one server load are sufficient.
We have 4 test benches where a single cluster is tested, a cluster in fault tolerant and non-fault tolerant configurations; to test these configurations, we need only two physical machines.
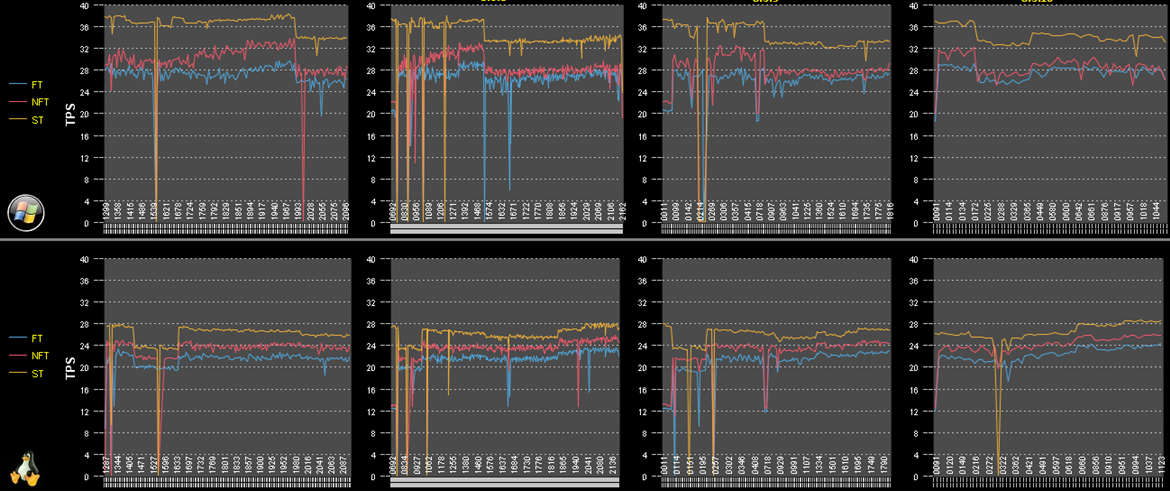
JMeter Performance Charts
For more complex testing, we use our product Test Center (part of the Corporate Tool Package ). The Test Center is a configuration on the 1C: Enterprise 8 platform; It allows you to describe multi-user test scripts, automatically run them and monitor the progress of their execution. We run the Test Center on the so-called conveyors; One pipeline consists of 2 powerful physical servers on which virtual machines are located:
We put a lot of effort into improving the accuracy of the conveyor; we now have, when running tests on the same platform versions and configurations, the scatter of results is less than 1.5%. On one conveyor, there are either 100 very fast clients (performing operations without pauses), or 1000 clients that are close to real users (emulating the work of an ordinary person, with pauses between actions).
Conveyors design stand types:
Conveyors can assemble 15 different work site configurations. Configurations vary in server composition, fault tolerance. Servers can be on Linux and Windows. The bases for testing (as well as test scenarios) are prepared in two versions:
Separated information bases (for testing work in 1cfresh technology) with configurations:
In CORP options, the configurations are tested:
Load tests can involve: 1, 2, 4, 10 pipelines.
Load tests are in options for 100, 200, 400, 3000 and 10,000 users.
In different workplace configurations, the number of servers in a cluster varies from 1 to 6.
To run tests for 10,000 users in one database, two working 1C application servers are used. Each cluster configuration is configured automatically from hundreds of parameters at the beginning of each test. In fact, we can assume that the stand is fully prepared for operation automatically, because:
Cluster configuration scripts, configuration files, OS, special processing are stored centrally in Git and delivered to the stands automatically when there are changes.
We also have scenarios for testing restructuring (product version updates, during which the database structure is changed). We are testing restructuring on the same stands. After the test is completed, the final result is checked - the data in the database must be updated correctly, and the database structure must correspond to the new version. Both the old and the new restructuring mechanism are being tested.
During the load tests, we automatically collect and analyze:
All data are automatically generated reports (different depending on the types of tests), which are sent to the responsible. All data is stored and aggregated in a special database with statistics and test results.
Test Center Screen
We also perform load testing of 10,000 users in the “1C: ERP Enterprise Management 2” configuration on a fault-tolerant cluster with simulation of equipment failures, network failures, insufficient memory, CPU resources, and disk space. This is a large test scenario in which the hang of 1C server processes is modeled alternately throughout the test, some processes are “killed” by the taskkill utility, the network is shut down and restored, etc. As part of testing, custom work scenarios are run in different subsystems — warehouse, purchasing, sales, mutual settlements, etc. In the ERP load test, about 400 key operations are performed, the test takes several hours.
On top of the described systems, our internal tool works - “Configuration Performance Comparison” (SEC), which allows you to compare performance:
In the "Configuration Performance Comparison" system, all the same parameters are collected that are collected during normal load tests. The system allows you to automatically detect the appearance of an error, the change in the load on the servers, the change in the duration of requests (or the appearance of requests that were not there before).
We analyze both the deterioration of performance and improvement, which can be a symptom of a problem.
The system can be used for comparison.
As a result, we get reports on passed load tests, with detailed information and a comparison of performance, load on equipment; the reports contain the time for the execution of queries to the DBMS, the facts of exceptions, etc.
Performance benchmarking refers to measuring the overall performance of the configurations, average runtime and average APDEX for each key operation.
All of the above tools emulate users, invoking the appropriate methods of embedded objects of the tested configurations, making calls to web and HTTP services, etc. But it is also extremely important to test exactly what the user actually sees, especially the user working through the web client (where it can take quite a while for the browser to draw the interface). We were faced with a situation where the performance in terms of automatic tests during the transition to the new version did not change, but when we put a person with a stopwatch, he got some numbers on the old version, and completely different ones on the new one. This is due, in particular, with the time of drawing the graphical interface, which in the new version could for some reason change.
We wrote our tool that allows you to do visual testing of almost any application. The tool records the actions of the user running the application in a script file. The tool also records the image of the working area of the screen. When monitoring new client versions, scripts are played without user participation. When playing a script, the tool, before simulating keystrokes or mouse buttons, expects the appearance of the same screen image (up to a pixel) as it was in the recorded script.
The tool also measures the performance of applications with an accuracy of 25 milliseconds, the results are written to the log for further automatic comparison. In some cases, we loop back parts of the script (for example, repeat order entry several times) to analyze the degradation of the runtime of the script. This testing, in addition to measuring performance, also allows us to be confident that in the new version of the platform the user will see the same screens in the thin client and browser as on the previous version of the application.
An example of launching a scenario for entering an order in the configuration “Management of Our Firm” - an order is entered 5 times; Here is the real speed of the 1C: Enterprise platform, if the user responds immediately to the availability of the interface:
We are also actively developing functional testing. We test combinations of major OS versions and databases, for each such combination we have our own set of virtual machines, the whole set of combinations forms one pipeline; Automated adding of new OS and DB combinations to this pipeline. Each functional test turns into a set of tasks that are executed on all possible combinations; tasks are performed by the first free stands. The Configurator (1C application development environment), the functions of the embedded language, the query language, etc. are tested.
When testing the Configurator, we check most of the commands available on the Configurator command line. In addition, we have a special library (we do not deliver it to the outside), which allows us to test the internal logic of the Configurator, which is available only through the user interface, without resorting to direct UI testing. Thus, most of the functions for working with configuration extensions, the comparison / merge functional and other Configurator functionality are tested.
For testing purposes, writing scripts in 1C is available in this mode. Within the script, special objects are available for testing purposes. The launch of the configurator in this mode can be combined in one test with the launch of the client application. This allows using this mode not only as a tool for testing the configurator, but also as a way to set up a test environment.
There are a number of our internal tools written on the 1C: Enterprise platform that we use in our daily work. They work on the latest build platform. Below we will talk about two of them - the “Task Base” and “Employee Reports”.
Our internal task tracker, “Task database” is a configuration written on the 1C: Enterprise platform. These are 21 independent bases (part of the bases are workers, part are test ones) on different versions of the platform, with different operating systems and DBMS, the bases are synchronized via the platform data exchange mechanism ; Platform versions are updated daily, on some servers experimental versions of the platform are installed with separate new features. The newly built platform functionality can be tested on the “Task Base” the very next day. Different database instances work with different server environments (OS, DBMS) and with different versions of the platform, and users also log in from different clients (thin client, mobile client ) and through a web client from different browsers. Thus, testing of different versions of the platform in different environments is carried out.
“Employee reports” is a time tracker for time tracking, which is used by employees of the 1C: Enterprise platform development department. It works on the latest build platform.
The standard solution "1C: Document Management" , which is used by all employees of our company, we also use with new, not yet released versions of the platform.
Along with automatic visual tests of popular application solutions (Enterprise Accounting, Management of Our Firm, Salary and Personnel Management, etc.), we conduct manual tests: scenario, visual, manual testing of the test cases of the main cases. After reaching a certain level of platform quality, we ask developers of application configurations to switch to development on a new version of the platform and test their products on the upcoming version.
Some of our partners are interested in using early, not yet released versions of the 1C: Enterprise platform. Such partners sign with NDA , 1C, get access to platform assemblies before the release of the test version and have the opportunity to use the latest version of the platform in real conditions. This allows partners at an early stage to detect problems in the platform and to be sure that these problems will no longer exist in the release version of the platform. We try to treat requests from such partners about the errors found with high priority. By the way, if someone from the readers of this article wants to take part in the beta testing of the 1C: Enterprise platform, write to CorpTechSupport@1c.ru .
The plans include switching to Continuous Delivery, a practice that assumes that the main assembly is constantly ready for release in order to shorten the time from the end of development to release. To achieve this, we want to expand our test coverage, develop functional and load testing.
The platform works on various OS and DB versions:
- OS: Windows, Linux, macOS
- DBMS: MS SQL, PostgreSQL, IBM DB2, Oracle, self-developed file DBMS
- Mobile OS: Android, iOS, Windows
Supports several types of clients:
')
- Thin client
- Fat client
- Web Client (Internet Explorer, Microsoft Edge, Chrome, Firefox, Safari)
- Mobile client
Considering that it is necessary to support a number of versions of the above operating systems, DBMS and browsers, platform testing becomes a non-trivial task.
Common automation tasks
The goals that we set for ourselves:
- Automate and speed up routine development and testing tasks to the maximum
- Continuous testing with minimal test effort
- Add only high quality code to the product version
- Do not break old functionality
- Increase the number of significant defects in the released platform to zero
- Detect problems early in order to minimize the cost of investigation and correction.
Simultaneous development of multiple platform versions
We use the practice of Continuous Integration (CI); The merging of working copies of the code into the general main branch occurs several times a day; after the merge, the automatic assembly and autotesting of the modified project is performed. If there are problems during assembly or testing, the modified code is returned for revision.
Development processes of one version of the platform
Tasks for CI:
- Assembly
- A series of assemblies of various types and subsequent testing of changeable versions as part of a continuous loop. To speed up the investigation of isolated changes in test results, we use incremental compilation — only what has changed and direct dependencies is compiled. For a full cycle of testing, assemblies are assembled completely. The necessity and sequence of additional assemblies is determined by the results of testing, the preliminary analysis of which is automated.
- Check "aside" significant changes (integration assembly). If the engineer considers the changes significant, he first merges them into a separate branch, collects it and runs all the tests. If all tests pass successfully, changes are made to the main branch.
- The fastest error detection, if possible in automatic mode
- Automation of routine actions (analysis of dumps, migration of changes between branches, error logging)
- Multi Level Testing
- Regression
- Unit tests
- Integration testing
- Load tests
- Visual tests
- Backward compatibility tests
- Scenario testing
- Progressive
- Basically functional
- Acceptance Testing
- Testing progress and change
- here we also assign manual testing
Automatic assembly with us are several times a day. A full cycle of automatic testing takes about a day, which for some tasks, unfortunately, is unacceptably long (balancing testing resources speeds up the process if there are free resources - if there are any at the moment). To neutralize this negative effect, we develop a “lightweight” version of the tests, which should be run in an hour and affect about 80% of the functionality. Thus, a general understanding of how efficient a build is is that we can get much faster. There may be occasions when an hour is not needed.
Now, when testing, the results of previous testing cycles are taken into account, and problem / new / corrected tests are launched with a higher priority, which allows you to see the progress of changes on the most modified functionality immediately at the beginning of testing.
For some type of builds, the rule “10 failures” is adopted, when a series of tests is automatically interrupted when 10 failures are reached within one series, in order to free up resources for testing other builds / other versions, etc.
About 70 physical servers and about 1500 virtual servers participate in our build and testing.
Instruments
Jenkins
We use Jenkins as a continuous integration system. During peak periods, it performs from 20 platform assemblies per day; It takes about 1.5 hours for one complete assembly, and 1 hour for testing. The build is carried out in parallel along architectures (Windows, Linux, macOS), each build is in hundreds of threads at the same time. A few years ago, this approach allowed us to reduce the build time of one version of the platform with all architectures from 8 hours to 80 minutes, and we are not going to stop there.
Through web services, Jenkins is integrated with our task tracker, Task Base (written on the 1C: Enterprise platform), and in case of problems, automatically initiates errors directly in the Task Base, putting links to test logs and artifacts. Jenkins also prepares the platform for publication, if necessary, filters and parses dumps.
Jenkins also manages testing, allowing you to implement arbitrarily complex scenarios on arbitrary hardware configurations, including a large number of virtual machines, and also does additional work, for example, delivering and installing a platform for 1,500 servers up to 70 times a day.
Apache jmeter
JMeter has a very valuable quality - it has low hardware requirements for emulating a large number of users. Also JMeter allows you to generate a mixed load in one test - HTTP, SOAP, JDBC, LDAP, SMTP, TCP.
In particular, we use JMeter to test the performance of an application cluster and its individual components, as well as for load testing an application cluster with a large number (up to 10,000) of users. For this test, one DB server, two 1C servers and one server load are sufficient.
We have 4 test benches where a single cluster is tested, a cluster in fault tolerant and non-fault tolerant configurations; to test these configurations, we need only two physical machines.
JMeter Performance Charts
Test center
For more complex testing, we use our product Test Center (part of the Corporate Tool Package ). The Test Center is a configuration on the 1C: Enterprise 8 platform; It allows you to describe multi-user test scripts, automatically run them and monitor the progress of their execution. We run the Test Center on the so-called conveyors; One pipeline consists of 2 powerful physical servers on which virtual machines are located:
- 1 application server 1C
- 1 database server
- 1 license server
- 40 servers with client sessions
We put a lot of effort into improving the accuracy of the conveyor; we now have, when running tests on the same platform versions and configurations, the scatter of results is less than 1.5%. On one conveyor, there are either 100 very fast clients (performing operations without pauses), or 1000 clients that are close to real users (emulating the work of an ordinary person, with pauses between actions).
Conveyors design stand types:
- small
- medium
- big
Conveyors can assemble 15 different work site configurations. Configurations vary in server composition, fault tolerance. Servers can be on Linux and Windows. The bases for testing (as well as test scenarios) are prepared in two versions:
- cloudy, for 1cfresh technology (base with a large number of relatively small data areas)
- KORP, for large implementations (large base)
Separated information bases (for testing work in 1cfresh technology) with configurations:
- 1c accounting
- Management of our company
- Salary and personnel management
In CORP options, the configurations are tested:
- Salary and Personnel Management
- 1C: ERP Enterprise Management 2
Load tests can involve: 1, 2, 4, 10 pipelines.
Load tests are in options for 100, 200, 400, 3000 and 10,000 users.
In different workplace configurations, the number of servers in a cluster varies from 1 to 6.
To run tests for 10,000 users in one database, two working 1C application servers are used. Each cluster configuration is configured automatically from hundreds of parameters at the beginning of each test. In fact, we can assume that the stand is fully prepared for operation automatically, because:
- platform is delivered
- scripts are delivered
- cluster is configured
- loading database
- configuration files are configured (by specified parameters)
- Information publications are being prepared.
Cluster configuration scripts, configuration files, OS, special processing are stored centrally in Git and delivered to the stands automatically when there are changes.
We also have scenarios for testing restructuring (product version updates, during which the database structure is changed). We are testing restructuring on the same stands. After the test is completed, the final result is checked - the data in the database must be updated correctly, and the database structure must correspond to the new version. Both the old and the new restructuring mechanism are being tested.
During the load tests, we automatically collect and analyze:
- all errors according to the Test Center
- platform technology journal exceptions
- all requests from the technology magazine platform
- all errors from the log
- all measurements of performed operations with technological information on their performance
- all equipment load data
All data are automatically generated reports (different depending on the types of tests), which are sent to the responsible. All data is stored and aggregated in a special database with statistics and test results.
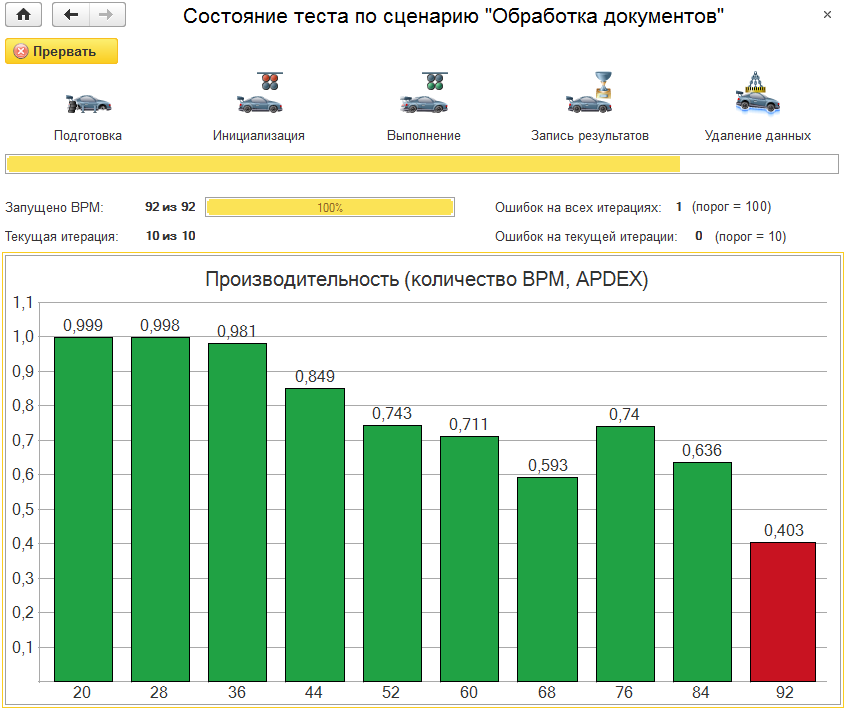
Test Center Screen
We also perform load testing of 10,000 users in the “1C: ERP Enterprise Management 2” configuration on a fault-tolerant cluster with simulation of equipment failures, network failures, insufficient memory, CPU resources, and disk space. This is a large test scenario in which the hang of 1C server processes is modeled alternately throughout the test, some processes are “killed” by the taskkill utility, the network is shut down and restored, etc. As part of testing, custom work scenarios are run in different subsystems — warehouse, purchasing, sales, mutual settlements, etc. In the ERP load test, about 400 key operations are performed, the test takes several hours.
One of the ERP test scenarios (running in parallel with other scenarios)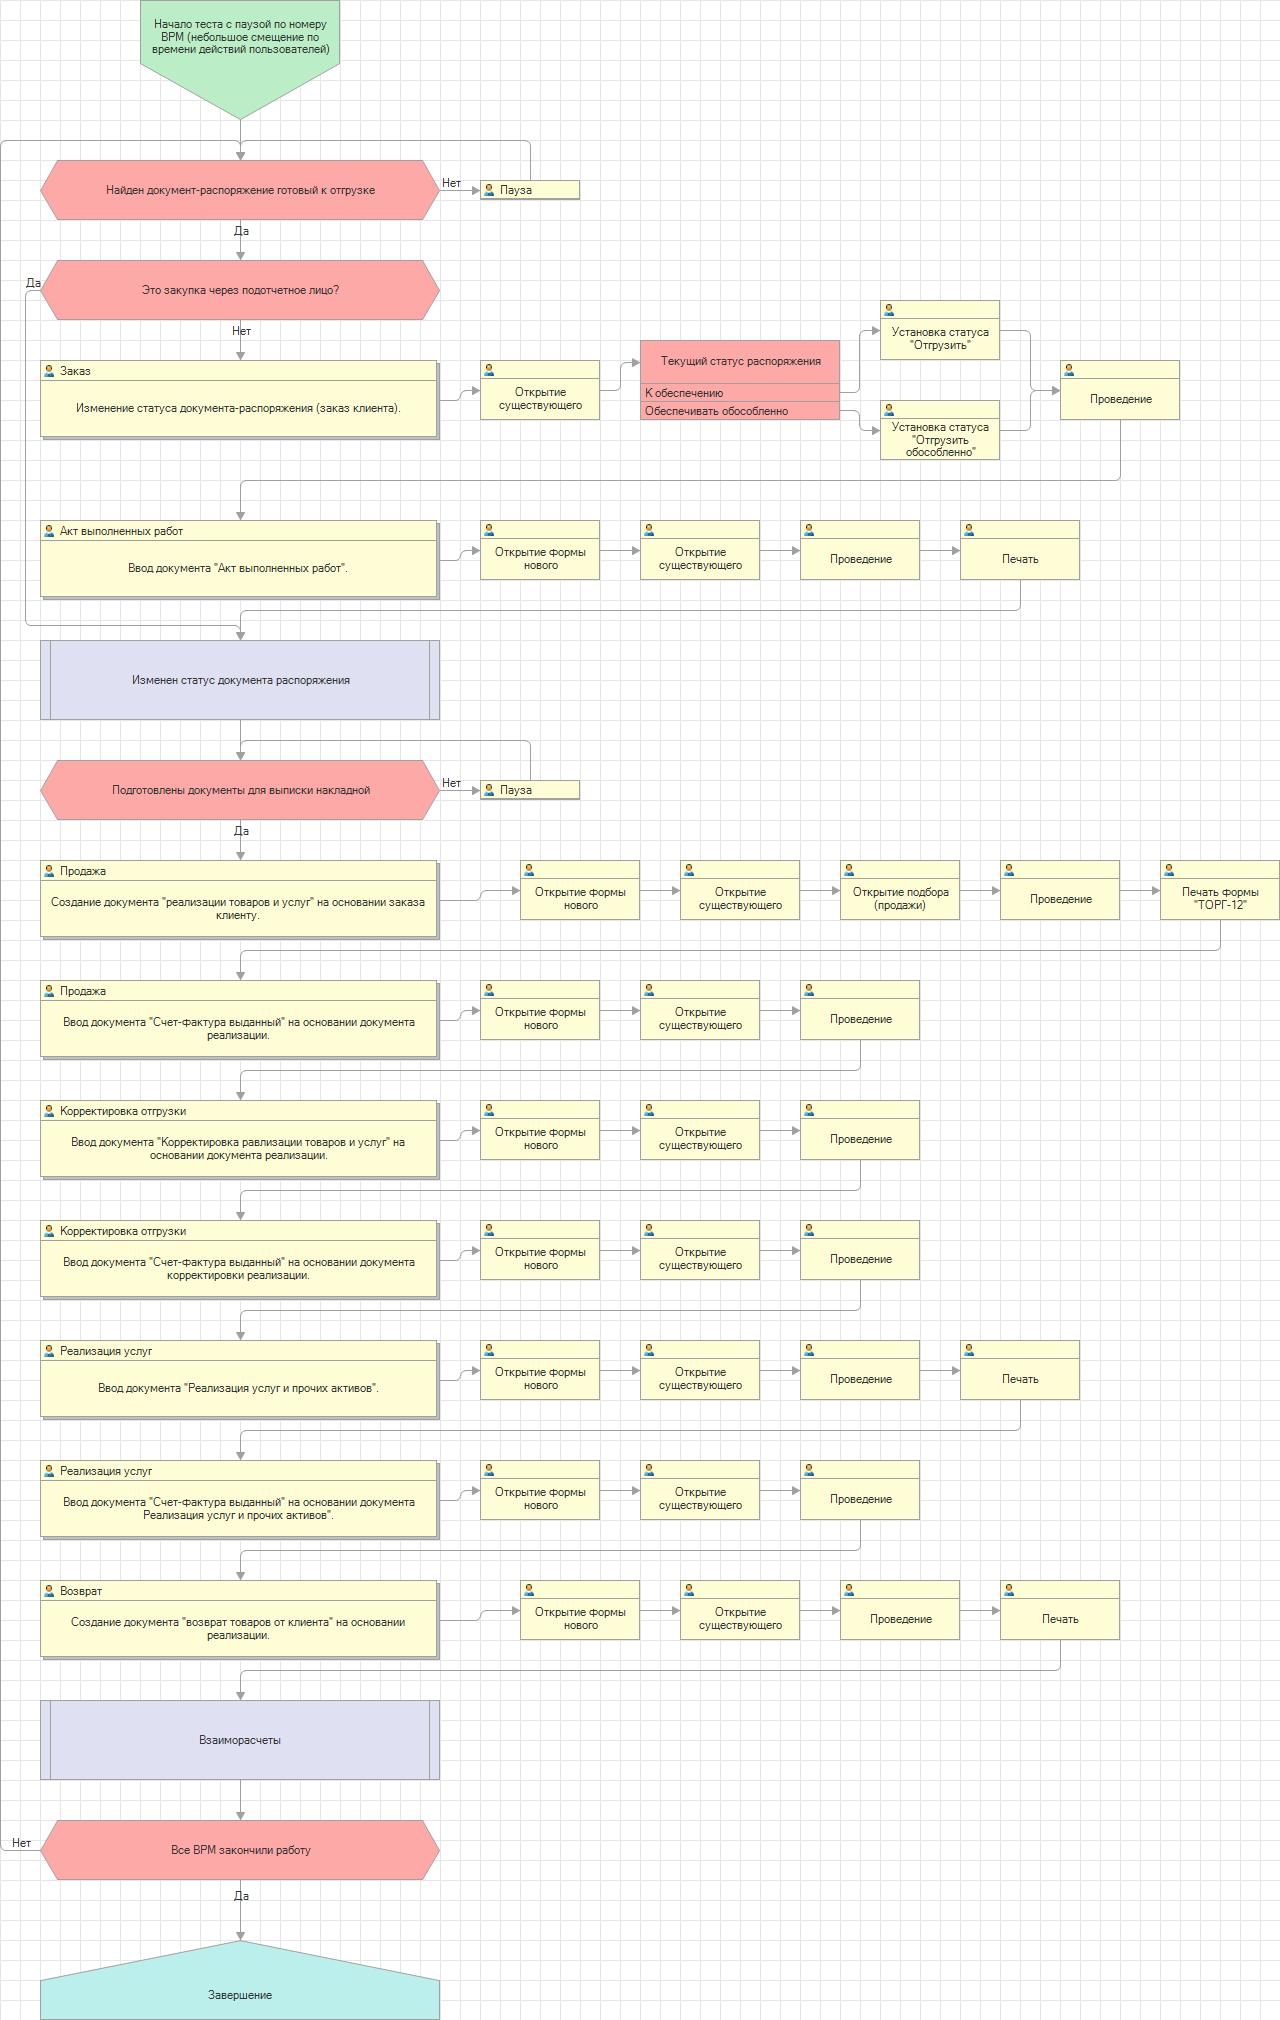
Configuration Performance Comparison
On top of the described systems, our internal tool works - “Configuration Performance Comparison” (SEC), which allows you to compare performance:
- different versions of the same configuration on the same platform
- two platform versions with the same configuration
- different DB / OS versions with the same platform / configuration
In the "Configuration Performance Comparison" system, all the same parameters are collected that are collected during normal load tests. The system allows you to automatically detect the appearance of an error, the change in the load on the servers, the change in the duration of requests (or the appearance of requests that were not there before).
We analyze both the deterioration of performance and improvement, which can be a symptom of a problem.
The system can be used for comparison.
- configuration versions
- platform versions
- versions of the DBMS,
- any settings
As a result, we get reports on passed load tests, with detailed information and a comparison of performance, load on equipment; the reports contain the time for the execution of queries to the DBMS, the facts of exceptions, etc.
Performance benchmarking refers to measuring the overall performance of the configurations, average runtime and average APDEX for each key operation.
Visual testing
All of the above tools emulate users, invoking the appropriate methods of embedded objects of the tested configurations, making calls to web and HTTP services, etc. But it is also extremely important to test exactly what the user actually sees, especially the user working through the web client (where it can take quite a while for the browser to draw the interface). We were faced with a situation where the performance in terms of automatic tests during the transition to the new version did not change, but when we put a person with a stopwatch, he got some numbers on the old version, and completely different ones on the new one. This is due, in particular, with the time of drawing the graphical interface, which in the new version could for some reason change.
We wrote our tool that allows you to do visual testing of almost any application. The tool records the actions of the user running the application in a script file. The tool also records the image of the working area of the screen. When monitoring new client versions, scripts are played without user participation. When playing a script, the tool, before simulating keystrokes or mouse buttons, expects the appearance of the same screen image (up to a pixel) as it was in the recorded script.
The tool also measures the performance of applications with an accuracy of 25 milliseconds, the results are written to the log for further automatic comparison. In some cases, we loop back parts of the script (for example, repeat order entry several times) to analyze the degradation of the runtime of the script. This testing, in addition to measuring performance, also allows us to be confident that in the new version of the platform the user will see the same screens in the thin client and browser as on the previous version of the application.
An example of launching a scenario for entering an order in the configuration “Management of Our Firm” - an order is entered 5 times; Here is the real speed of the 1C: Enterprise platform, if the user responds immediately to the availability of the interface:
Functional testing
We are also actively developing functional testing. We test combinations of major OS versions and databases, for each such combination we have our own set of virtual machines, the whole set of combinations forms one pipeline; Automated adding of new OS and DB combinations to this pipeline. Each functional test turns into a set of tasks that are executed on all possible combinations; tasks are performed by the first free stands. The Configurator (1C application development environment), the functions of the embedded language, the query language, etc. are tested.
When testing the Configurator, we check most of the commands available on the Configurator command line. In addition, we have a special library (we do not deliver it to the outside), which allows us to test the internal logic of the Configurator, which is available only through the user interface, without resorting to direct UI testing. Thus, most of the functions for working with configuration extensions, the comparison / merge functional and other Configurator functionality are tested.
For testing purposes, writing scripts in 1C is available in this mode. Within the script, special objects are available for testing purposes. The launch of the configurator in this mode can be combined in one test with the launch of the client application. This allows using this mode not only as a tool for testing the configurator, but also as a way to set up a test environment.
Eating your own dogfood
There are a number of our internal tools written on the 1C: Enterprise platform that we use in our daily work. They work on the latest build platform. Below we will talk about two of them - the “Task Base” and “Employee Reports”.
Task Database
Our internal task tracker, “Task database” is a configuration written on the 1C: Enterprise platform. These are 21 independent bases (part of the bases are workers, part are test ones) on different versions of the platform, with different operating systems and DBMS, the bases are synchronized via the platform data exchange mechanism ; Platform versions are updated daily, on some servers experimental versions of the platform are installed with separate new features. The newly built platform functionality can be tested on the “Task Base” the very next day. Different database instances work with different server environments (OS, DBMS) and with different versions of the platform, and users also log in from different clients (thin client, mobile client ) and through a web client from different browsers. Thus, testing of different versions of the platform in different environments is carried out.
Employee reports
“Employee reports” is a time tracker for time tracking, which is used by employees of the 1C: Enterprise platform development department. It works on the latest build platform.
"1C: Document"
The standard solution "1C: Document Management" , which is used by all employees of our company, we also use with new, not yet released versions of the platform.
Platform Tests in Application Solutions
Along with automatic visual tests of popular application solutions (Enterprise Accounting, Management of Our Firm, Salary and Personnel Management, etc.), we conduct manual tests: scenario, visual, manual testing of the test cases of the main cases. After reaching a certain level of platform quality, we ask developers of application configurations to switch to development on a new version of the platform and test their products on the upcoming version.
Beta testing platform partners
Some of our partners are interested in using early, not yet released versions of the 1C: Enterprise platform. Such partners sign with NDA , 1C, get access to platform assemblies before the release of the test version and have the opportunity to use the latest version of the platform in real conditions. This allows partners at an early stage to detect problems in the platform and to be sure that these problems will no longer exist in the release version of the platform. We try to treat requests from such partners about the errors found with high priority. By the way, if someone from the readers of this article wants to take part in the beta testing of the 1C: Enterprise platform, write to CorpTechSupport@1c.ru .
Plans
The plans include switching to Continuous Delivery, a practice that assumes that the main assembly is constantly ready for release in order to shorten the time from the end of development to release. To achieve this, we want to expand our test coverage, develop functional and load testing.
Source: https://habr.com/ru/post/352210/
All Articles