SOA: send a request to the server? What could be easier?
You may have heard about Booking.com, that they are experimenting a lot and often deploy without testing . And also that there is one large repository for 4 GB, it has 4 million lines of pearl-barley code, and generally a monolithic architecture.
At the same time, Booking.com is changing. This is not to say that this is a cardinal change in leaps and bounds, but a slow and confident transformation. The stack is changing, Java is gradually being introduced in those places where this is relevant. Including the term service-oriented architecture (SOA) is heard more and more often in internal discussions.
Further, Ivan Kruglov's story ( @vian ) about these changes in terms of the interaction of internal components at Highload Junior ++ 2017 . Having fallen into the trap of cyclically dependent workers, it was necessary to qualitatively figure out what was happening, and by what means you could fix it all.
')
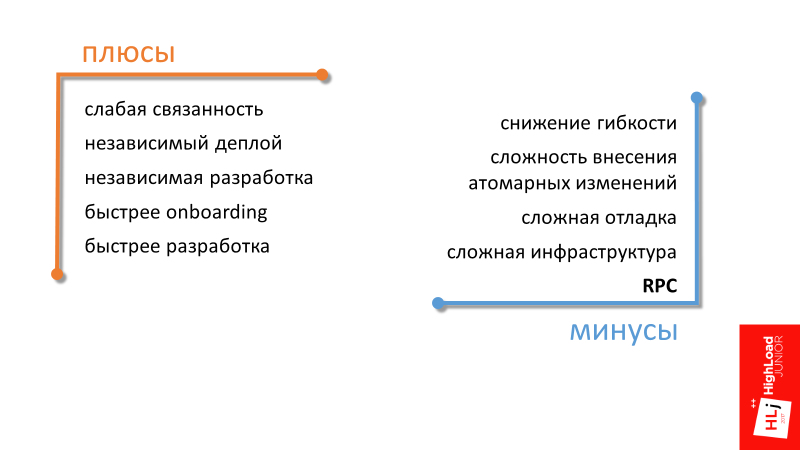
The first 3 advantages of service-oriented architecture — weak connectivity, independent deployment, independent development — are generally understood, I will not dwell on them in detail. Let's go straight to the next one.
Faster onboarding
In a company that is in the phase of intensive growth, a lot of attention is paid to the topic of quickly incorporating a new employee into the workflow. Service-oriented architecture here can help by focusing a new employee on a specific small area. It is easier for him to get knowledge about a separate part of the entire system.
Faster development
The last point summarizes the rest. From the transition to a service-oriented architecture, we, if we are not able to significantly speed up the development, then at least maintain the current pace at the expense of less connected components.
Reduced flexibility
By flexibility, I mean flexibility in the redistribution of human resources. For example, in a monolithic architecture, in order to make some change in the code and break anything, you need to have knowledge of how a large area works. With this approach, it turns out that it becomes easy to transfer a person between projects, because with a high degree of probability this person in the new project will already know a fairly large area. From a management point of view, the system is more flexible.
In a service-oriented architecture, everything is a little different. If your teams use different technological stacks in different teams, then switching between teams may be equivalent to switching to another company, where everything can be completely different.
This is a managerial minus, the remaining minuses are technical.
The complexity of making atomic changes (not only in the data)
In a distributed system, we lose the possibility of transactions and atomic changes to the code. One commit to several repositories will not stretch.
Difficult debugging
A distributed system is fundamentally more difficult to debug. Elementary, we have no debugger in which it would be possible to see where we will go further, where the data will go in the next step. Even in the elementary task of analyzing logs, when there are 2 servers, each of which has its own logs, it is difficult to understand what it is related to.
It turns out that in the service-oriented architecture, the infrastructure as a whole is more complicated . Many supporting components appear, for example, a distributed logging system and a distributed tracing system are needed.
This article will focus on another drawback.
Remote Procedure Call (RPC)
It results from the fact that, if in a monolithic architecture, in order to do some operation, it is enough to call the desired function, then in SOA you will have to make a remote call.
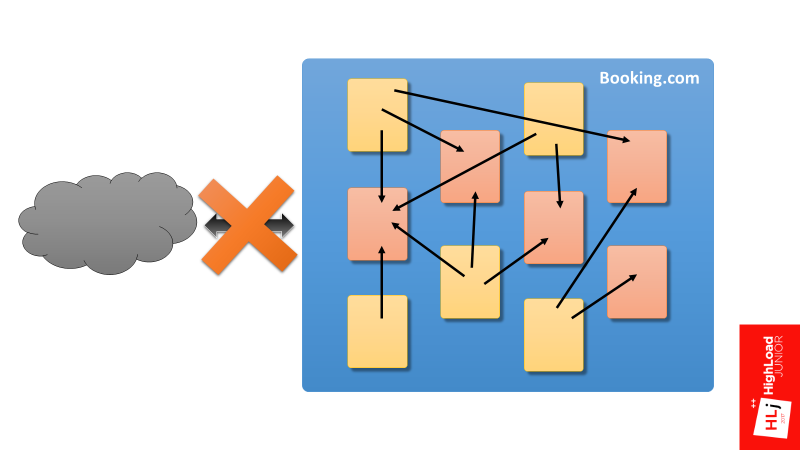
Just want to say what I will and will not talk about. I will not talk about the interaction of Booking.com with the outside world. My report focuses on the internal components of Booking.com and their interaction.
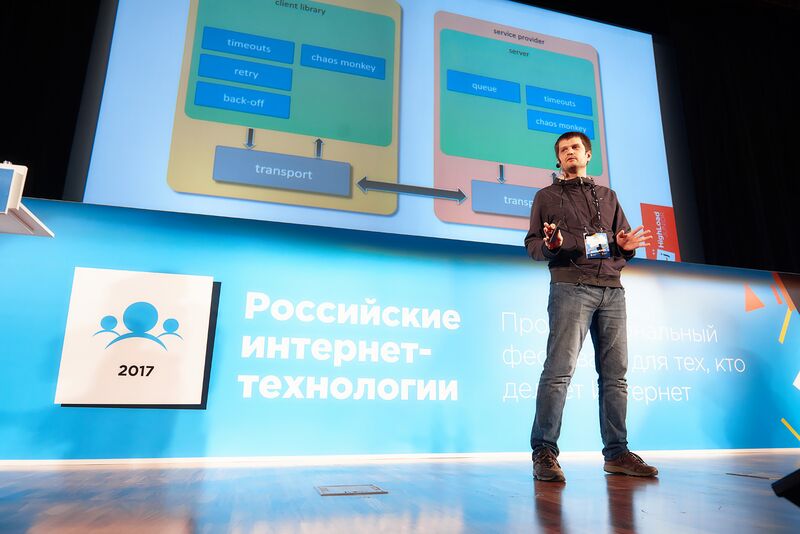
Moreover, if we take a hypothetical service consumer, in which the application through the client library and transport interacts with the server at the service provider and back, my focus is the framework that provides the interaction of these two components.

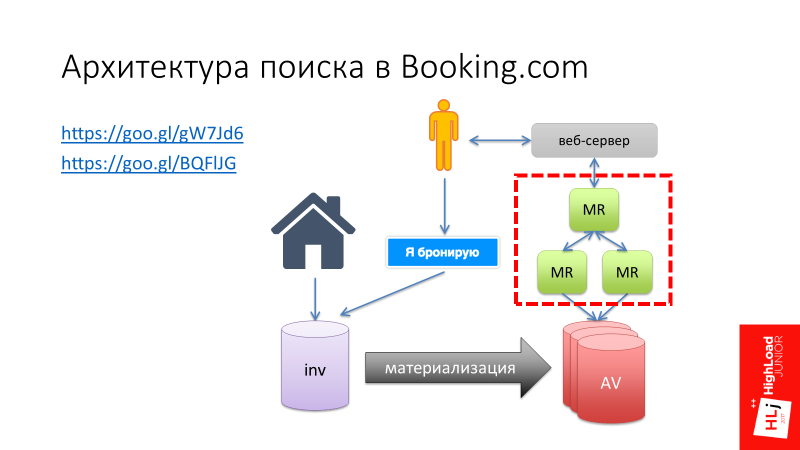
I want to tell one story. Here I refer to my report “ Search architecture on Booking.com ”, in which I talked about how the search developed on Booking.com, and at one of the stages we decided to create our own samopisny Map-Reduce framework (highlighted in red in the figure below) .
This Map-Reduce framework should work as follows (see the diagram below). At the entrance there had to be a search query that arrives at the master node, which divides this request into several subqueries and sends them to the workers. A worker performs his work, forms the result and sends it back to the master. The classical scheme: on the Master - the reduce function, on the Worker - the Map phase. So it was supposed to work in theory.
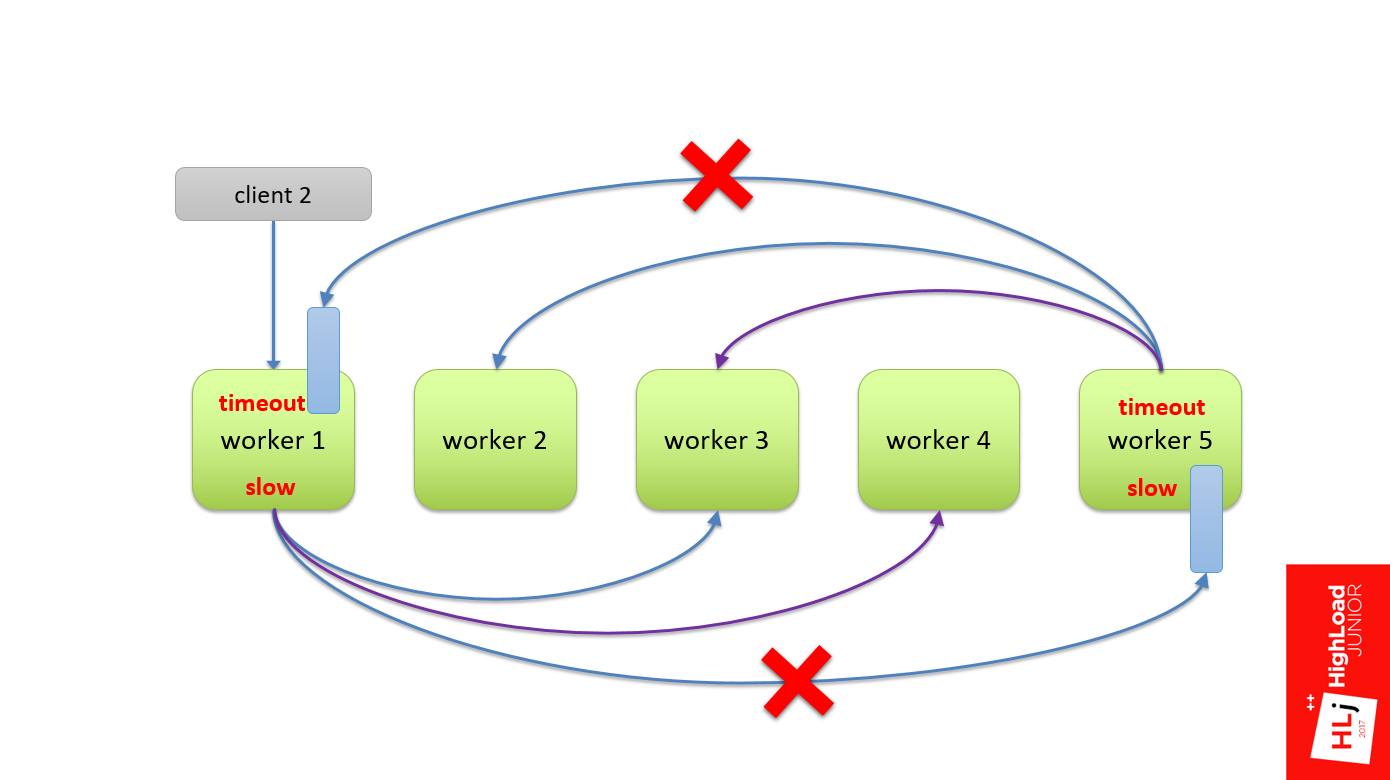
In practice, we did not have a hierarchy, that is, all the workers were equivalent. When a client flew in, he randomly chose a worker (in Fig. This is worker 4). Within the framework of the request, this worker became a master and divided this request into subqueries and also randomly chose his 2nd and 5th worker for himself as an apprentice.
With the second query, the same thing: randomly select the 1st worker, he divides it and sends it to the 3rd and 5th.
But there was such a feature that this query tree was multilevel, and the 5th worker could also decide to divide his query into several subqueries. He also chose some nodes from the same cluster as an apprentice.
Since the nodes are chosen randomly, it could turn out that he takes and selects the first node and the second node as his sub-apprentice. The figure shows that between the 1st and 5th workers there is a cyclical relationship, when the 1st worker needs the resources from the 5th to fulfill the request, and the 5th needs the resources from the 1st, which not to be.
So do not. This is a recipe for a disaster that has happened here.

At a certain point in the cluster, a chain reaction was started, due to which all the machines left the cluster within 5-10 seconds. The cluster fell into a deadlock . Even if we removed all incoming traffic to it, it remained in a blocked state.
In order to bring it out of this state, we needed to restart all the machines in the cluster. It was the only way. We did it lively, because we did not know the reason for our problem. We were afraid to switch traffic to another cluster, to another data center, because we were afraid to launch the same chain reaction. The choice was between the loss of 50% and 100% of traffic , we chose the first.
It is easiest to explain what happened through a demonstration. Just want to say that this demonstration does not 100% reflect what was in that system, because it is no longer there. We refused it, including due to architectural problems. In my example, the key points are reflected, but it does not emulate the situation completely.
Two parameters are backlog = 2048 and listen = 2048 while you take as data, then understand why they are important here.
Scenario
All my demos will take place under the same scenario. The graph shows a plan of action.
There are 3 phases here:
I will demonstrate this all with the help of a samopisny tool that can be found on my GitHub. This is how it looks.

Explanation:
Go!
We started with 2500 requests per second, the number is growing - 2800, 2900. One can see the normal distribution somewhere around 5 ms.
When the server comes to a saturation zone , requests become slower. They flow, flow, flow, and then at some point there is a sharp degradation of the quality of service. All requests have become erroneous. Everything became bad, the system fell.
In the resulting state, 100% of the requests failed , and they were clearly divided into 2 categories: slow failures , which take ~ 0.5 s, and very fast (~ 1 ms).
Query graphs look something like the figure below. At a certain point, a qualitative change occurred, all positive requests were replaced with negative ones, and the 99th percentile of response time significantly degraded.

Steps
To begin with, the system processes requests in a normal state when it is not under load. Once again, the explanation is simplified.
Let's look closely at the degradation zone, in which requests flow into slower ones. The pause is set in an interesting moment, because if you pay attention to the number of in-flight requests (requests that are happening right now), there are 94 of them. Let me remind you that we have 96 uWSGI workers.

It is at this point that a significant degradation of quality service occurs. That is, all requests abruptly become very slow, and everything ends up with an error.
We return to the chart.
The total request time is made up of these 4 components.
There is a feature here. nginx is great fast software . In addition, nginx workers are asynchronous, so nginx is able to process the queue very quickly, which is in the TCP socket.
The uWSGI workers are synchronous, on the contrary. In fact, these are barley-based processes, and when the number of requests that arrive in the system begins to exceed the number of available workers, a queue begins to form in the Unix socket.
In Setup, I focused on 2 parameters: backlog = 2048 and listen = 2048. They determine the length of this queue, which in this case will be up to 2048 long.
The request begins to spend significant time in the unix socket, just sitting in a queue and waiting for its chance that the worker at uWSGI will be released and start processing it. At this point, a timeout of 500 ms occurs. The client side tears up the connection, but tears it up only to nginx .
From the point of view of uWSGI, nothing happens. For him, this is a fully established connection , since the requests are small, they all lie in the buffer. When the worker is released and takes the record, from his point of view, this is an absolutely valid request that he continues to execute.
This is not the case in the figure, but if at this moment you look at the server, it will be 100% loaded , it will continue to process these dangling connections, dangling requests.
That is, it turns out that the client does the work, sends requests, but receives 100% errors. The server, for its part, receives requests, honestly processes them, but when it tries to send back the data, nginx says to him: “No one needs this answer!”
That is, the client and the server are trying to talk, but do not hear each other .
Next stage
All requests degraded into erroneous, their number per second continues to grow. At this moment, the nginx worker, trying to connect to socket uWSGI, gets error 502 (Bad Gateway), since the queue is full.
Since in this case the request time is limited only by processing in nginx, the answer is very, very fast. In fact, nginx only needs to parse the HTTP protocol, make a connection to the unix socket and that's it.
Here I want to return you to the original problem and tell you in more detail what is happening there.
The following happens. For some reason, some workers have become slow, we will not dwell on why, take it as given. Because of this, the uWSGI workers start to end and form a queue in front of them.
When a client request arrives, the 1st worker sends the request to the 5th one, and this request must defend its turn. After he defended his turn and began to be processed by the 5th worker, the 5th worker in turn also divided his request into subqueries. The subquery arrives at the first worker, in which he must also defend the queue.
Now there is a timeout on the side of the 1st worker. At the same time the request is broken, but the 5th worker does not know anything about it. He successfully continues to process the original request. And the 1st worker takes Retry to the same request.
In turn, the 5th worker continues to process, there also happens a timeout, because we have defended a queue in the 1st. It terminates its request and also makes Retry.
I think it is clear that if the process continues, spinning this flywheel, in the end the whole system will be crammed with requests that are not needed by anyone. In fact, it turned out a system with positive feedback . This put our system.
When we analyzed this case, which, by the way, took a lot of time, because it was completely incomprehensible what was happening, we thought: since we spend a lot of time in the unix socket (we have a very long 2048 items), let's try it is less, so that each worker has only 1 element.
Let's now see how an absolutely same system behaves with a single changed parameter - the queue length.
The scenario is the same as last time: starting with 2500, we also raise requests: 2900, 3000, 3100, 3200. We enter the zone when the system is not stable. Inquiries are slowly falling down, but not degrading so fundamentally. This system is stabilized literally in the region of 45 ms. It continues to successfully process requests, but at the same time some part of them leads to errors.
On the graph it looks like this.
At a certain point in time, the system has stabilized the number of requests that it can successfully process. At the same time, at the time of stabilization, erroneous requests began to form. This is the number of requests that the system is not able to process at the moment.
It turns out that due to the length of the queue, the system will always take only the request that is most likely to be successfully executed. According to statistics, this volume of requests is always fixed. The rest of the system simply ignores and gives error 502.
In the third phase, when the number of requests sharply bullying, the system still retains its performance. Moreover, it retains its quality of service, that is, the p99 response time does not grow, it has stabilized.
This is what we started in production with, I will tell you more about this. I experimented with the queue length and it turned out that the queue length determines, at least in our system, the worst response time.
The system has stabilized at a slightly higher response time, but it is still stabilized. If you try to limit the queue literally at 20, then the response time does not practically grow at all, changing only by a few milliseconds.
In the short term:
Reducing the queue length, first of all, conditionally broke the cycle . Conventionally, then the cyclic dependence is still present, but the properties have changed. The fact is that a particular server, if it does not have enough resources to process an incoming request, will simply reject the request. And this will be done very quickly, with a minimum of overhead. If there are enough resources in this server, the request will be accepted. As a result, the cycle, if this particular server is loaded, breaks.
Moreover, there is one more nuance. In the first example, there were 2 error classes — very fast (~ 1 ms) and very slow (~ 500 ms). By reducing the length of the queue, all slow errors were translated into a series of cheap ones, that is, we made them very fast. Thanks to this, we have become cheap replays . The situation has ceased to repeat, when we, by doing Retry, in fact once again load some second component.
In the long run, of course, we had to switch to a 2-step architecture, which would coincide with the logical architecture. This we did in the next iteration, when we developed a replacement for the search service.
Now let's talk about what components you need and what you need to keep if you want to build a predictable RPC system - a framework with predictable system behavior in boundary conditions. I'll tell you about what we have, what approaches we use, without reference to a specific service.
Returning to the first diagram (the interaction between the client and server), we have already touched the first 2 bricks that need to be properly configured:
We have already dealt with slow errors - we transferred them to the category of fast ones, what to do with fast errors?
It is necessary to consider 2 different cases.
First, what to do when the system is in the saturation phase ?
Here, in fact, nothing can be done! When the system is in the saturation phase, it has run out of resources, and it cannot process anything new. For example, I can carry 100 kg, but give me 101 kg, and I will fall.
This is a very good feature, because here it is, in fact, about 2 very important, in my opinion, component of any framework:
Secondly, what to do if the queue overflows briefly ?
This is possible if, for example, there was some kind of delay in the network, requests accumulated in it, and some of them arrive at the server at once, briefly filling the queue.
In this case, a very simple and reliable mechanism is to take and repeat (Retry). One more brick falls on our diagram.
In my practice, Retry is a powerful mechanism that allows in many cases to get off the water. For example, on the chart above, this is the number of errors on the server side, and below is the number of errors on the client side. It can be seen that for some reason the server constantly generates errors, but on the client side nothing is visible.
Quite often it happens that even if we have any problems on the server side for any reason, they don’t reach the client due to competent Retry.
When we talk about Retry, it is important to keep in mind:
When we send an HTTP request, everything that happened until the moment when we sent data to the server, that is, in fact, was written to the socket - this is a safe operation, because we haven't sent anything to the server yet. For example, if you had some kind of error when you tried to convert a DNS address, or simply the server is not available, then this is normal.
Everything that happened after that is questionable, because the HTTP standard for read operations performed by the GET method are idempotent by default, which is not the case for POST.
This is in theory, but in practice it comes out in different ways, depending on the system. For example, there are a number of systems that write: “Sending GET requests somewhere there.” Therefore, we must look at a specific system.
Imagine that a short-term problem has occurred on the network, for example, a route is being rebuilt, some host has become unavailable for a short period of time. If you repeat it once, after the second, third, then you will burn your budget in just a few milliseconds. It is not effective. You have not given any chance for the system to recover.
We’ll put another brick on the diagram into the service consumer block - back-off.
The main idea behind the back-off is to insert a pause between attempts in order to increase the chances of success. So we give the system a chance, and wait on our side, hoping that the system will recover itself.
I know several back-off algorithms:
Another important factor when we talk about back-offs is the randomization of indentation intervals - jitter.
Imagine that 100 requests are flying to you that arrive at one moment and briefly overload the server. All requests receive an error. Now we indent for 100 ms, and the same requests again go to the server. The situation, in fact, repeats itself - they just overload the server.
If the server locally add some randomized delta to the indent, it turns out that all the second requests will be spread out over time and arrive at the server more than once. The server will have much more chances to process them.
We use an exponential randomized interval in Booking.com (see example). For example, the first indent is 53 ms, then 129 ms, 555 ms, etc.
The next brick is server-side timeouts, more precisely, timeout consistency on the client and server sides.
I have already touched on this topic. It is important that when the client falls off, the server does not continue to process that request.
In modern frameworks there is such a mechanism as cancellation of the request - request cancellation . Our framework, unfortunately, does not have such properties, so we had to work around this problem.
When our client flies to the server, it sets the HTTP header - X-Booking-Timeout-Ms , which says what its timeout is. After that, the server takes this data and sets its local server timeout based on the client and some delta to allow the request to fly to the server:
server timeout = client timeout + delta
It turns out that when a client falls off after 100 ms, the server will fall off, for example, literally after 110 ms. That is, the request is canceled.
The diagram already has 5 elements that are not needed when the system is stable. They are required when everything is bad, in fact, as backups. These components are not needed in normal life, but when they are needed, they are really needed .
There are people who still do not make backups. But those who have had negative experience, periodically restore backups. We are essentially for these purposes, that is, in order to test our entire stack, we use Chaos Monkey.
Initially, the idea of Chaos Monkey was that we turn off the data center and see how our system responds. We have not yet reached such a scale - our scale is more modest. But there are interesting things you want to talk about.

We have 3 types of Chaos Monkey.
1. HTTP client verification
We expect a special behavior from the client when, for example, 502 responses from nginx arrive to it. We know that this is a cheap answer, so the client automatically repeats it. To test this logic, a certain percentage of requests take and artificially eject 502 responses. In my opinion, we have this 1% artificially created errors in production.
That is, Chaos Monkey really spoils 1% of internal requests in order to make sure that when real requests come, the system will correctly process them.
2. Mild degradation of applications
The second type of Chaos Monkey is more interesting. What does soft degradation of applications mean?
Imagine that there is a search page, it has the main search functionality, which is our main business. This functionality is bound by minor components that also make remote calls.
If this minor component falls, we don’t want the entire page to fall. We expect from a developer who writes minor components that he will develop the system so that when an error from a minor request arrives, we do not generate a 500th answer for our client. To do this, our servers periodically generate 400th responses that mean that the request was incorrectly formed, and therefore the HTTP client forwards it to the topmost stack into the application, which is visible to the developer.
This mechanism Chaos Monkey works for us only within the company. It is clear that if we run this in business, we can lower the conversion, which is not good.
Since we are really talking about the failure of part of the functionality, we always have a list of critical queries, for example, the same basic search query, which does not participate in this logic.
3. Readiness for delays in replication
The last kind of Chaos Monkey stands a little apart. We have a data retrieval system, to which the client comes and says: “I have 1000 records, give me all of them!” But this system uses MySQL for data storage and it may turn out that some of these records have only been recorded and the master record did not have time to fly to the slave. Therefore, from time to time it happens that the system responds that it has 900 and 100 does not yet, because they did not have time to fly to the slave and appear later.
With the Chaos Monkey mechanism, we test this functionality. The system generates the correct 200th answer, but emulates the logical error that some of the records are simply missing. This also works in production.
We return to the chart.
In fact, the components are much larger. Only from what I know:
This is if we talk only about the stack above the transport, and there is still a lot of everything inside the transport that needs to be properly configured in order for the system to work predictably.
Predictable HTTP request sending is a difficult task! There are so many components that need to be properly configured. All systems are different, there are no silver bullets.
In short, test and test ! In my opinion, the only way to make the system work is to put it in boundary conditions and see how it will react.
In Booking, we had to slightly reinvent the wheel and write our own framework. Most likely, you do not work with Perl, so you are lucky a little more.
Look at frameworks such as gRPC and Finagle. If you prefer proxy servers, then Linkerd and Envoy. I’ll say right away that I don’t have any experience with production systems, I cannot recommend anything concrete.
Last - experiment with the queues . In our experience, we realized that the length of the queue can drastically change the behavior of the system, which happened to us. So put a note - try to play.
But please do not copy my example - take and check.
There is an important point - if you want to experiment, control over the client is important, because your system behavior is changing, and it is important that your client adapt as well.
What I showed only works when there is a web server behind nginx that works through a unix socket. TCP socket behaves differently.
That's all for today, and below are links that can help sort out the details:
At the same time, Booking.com is changing. This is not to say that this is a cardinal change in leaps and bounds, but a slow and confident transformation. The stack is changing, Java is gradually being introduced in those places where this is relevant. Including the term service-oriented architecture (SOA) is heard more and more often in internal discussions.
Further, Ivan Kruglov's story ( @vian ) about these changes in terms of the interaction of internal components at Highload Junior ++ 2017 . Having fallen into the trap of cyclically dependent workers, it was necessary to qualitatively figure out what was happening, and by what means you could fix it all.
')
Advantages of the transition to service-oriented architecture
The first 3 advantages of service-oriented architecture — weak connectivity, independent deployment, independent development — are generally understood, I will not dwell on them in detail. Let's go straight to the next one.
Faster onboarding
In a company that is in the phase of intensive growth, a lot of attention is paid to the topic of quickly incorporating a new employee into the workflow. Service-oriented architecture here can help by focusing a new employee on a specific small area. It is easier for him to get knowledge about a separate part of the entire system.
Faster development
The last point summarizes the rest. From the transition to a service-oriented architecture, we, if we are not able to significantly speed up the development, then at least maintain the current pace at the expense of less connected components.
Cons transition to service-oriented architecture
Reduced flexibility
By flexibility, I mean flexibility in the redistribution of human resources. For example, in a monolithic architecture, in order to make some change in the code and break anything, you need to have knowledge of how a large area works. With this approach, it turns out that it becomes easy to transfer a person between projects, because with a high degree of probability this person in the new project will already know a fairly large area. From a management point of view, the system is more flexible.
In a service-oriented architecture, everything is a little different. If your teams use different technological stacks in different teams, then switching between teams may be equivalent to switching to another company, where everything can be completely different.
This is a managerial minus, the remaining minuses are technical.
The complexity of making atomic changes (not only in the data)
In a distributed system, we lose the possibility of transactions and atomic changes to the code. One commit to several repositories will not stretch.
Difficult debugging
A distributed system is fundamentally more difficult to debug. Elementary, we have no debugger in which it would be possible to see where we will go further, where the data will go in the next step. Even in the elementary task of analyzing logs, when there are 2 servers, each of which has its own logs, it is difficult to understand what it is related to.
It turns out that in the service-oriented architecture, the infrastructure as a whole is more complicated . Many supporting components appear, for example, a distributed logging system and a distributed tracing system are needed.
This article will focus on another drawback.
Remote Procedure Call (RPC)
It results from the fact that, if in a monolithic architecture, in order to do some operation, it is enough to call the desired function, then in SOA you will have to make a remote call.
Just want to say what I will and will not talk about. I will not talk about the interaction of Booking.com with the outside world. My report focuses on the internal components of Booking.com and their interaction.
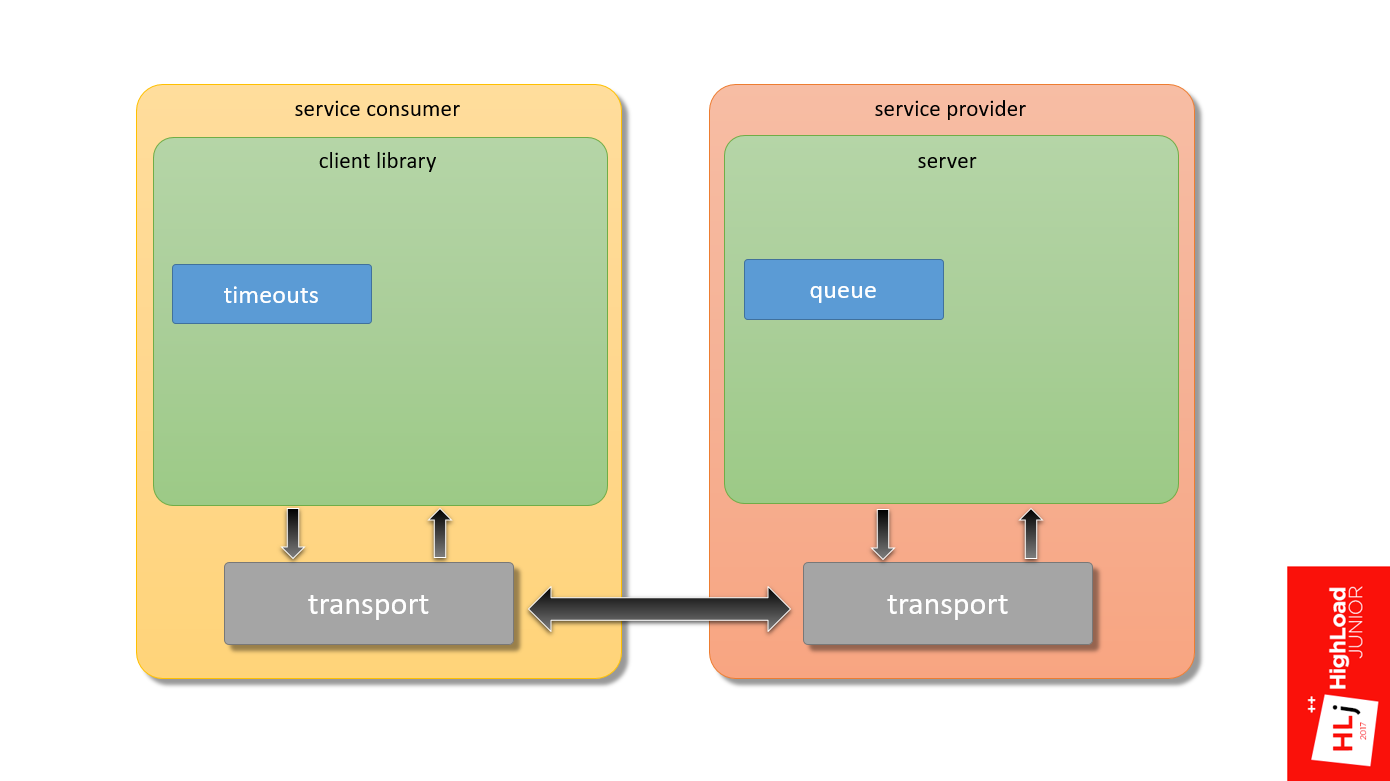
Moreover, if we take a hypothetical service consumer, in which the application through the client library and transport interacts with the server at the service provider and back, my focus is the framework that provides the interaction of these two components.
The story of one problem
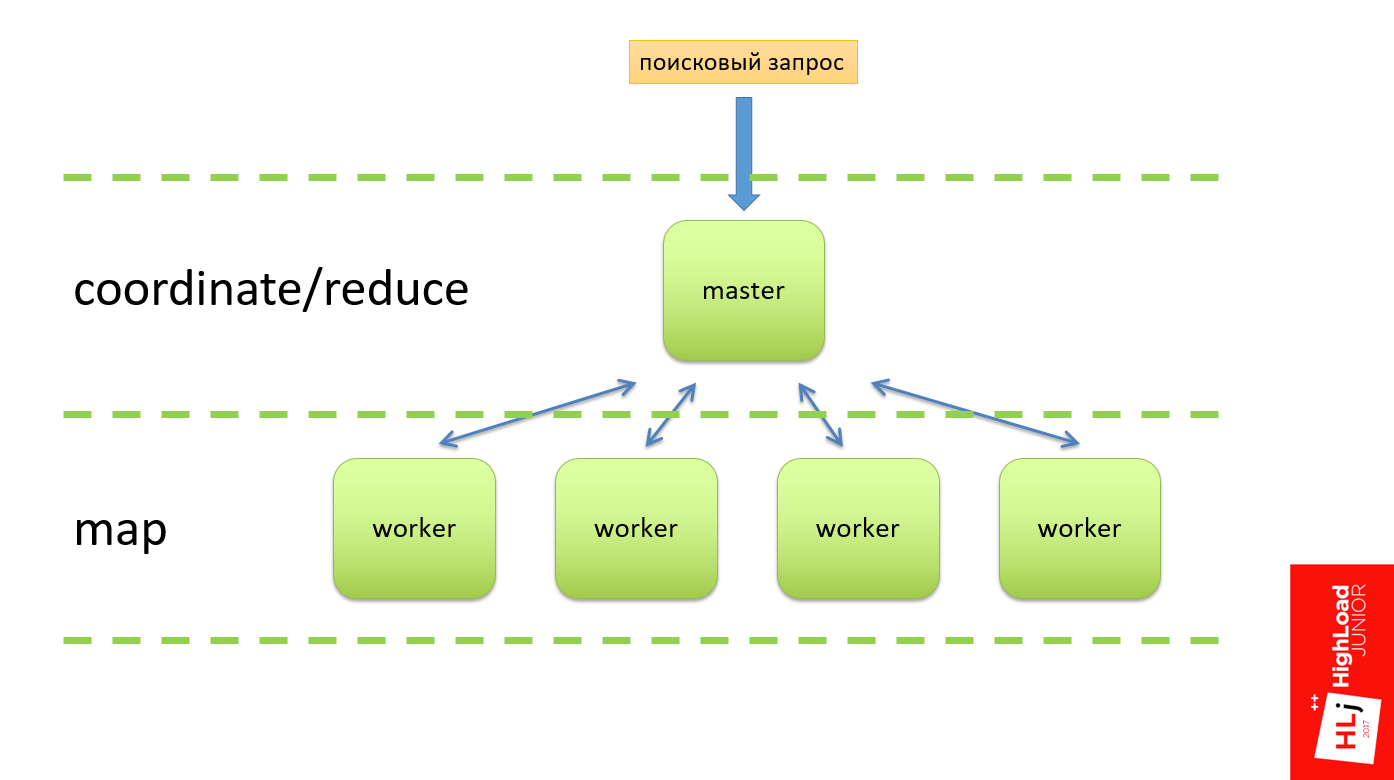
I want to tell one story. Here I refer to my report “ Search architecture on Booking.com ”, in which I talked about how the search developed on Booking.com, and at one of the stages we decided to create our own samopisny Map-Reduce framework (highlighted in red in the figure below) .
This Map-Reduce framework should work as follows (see the diagram below). At the entrance there had to be a search query that arrives at the master node, which divides this request into several subqueries and sends them to the workers. A worker performs his work, forms the result and sends it back to the master. The classical scheme: on the Master - the reduce function, on the Worker - the Map phase. So it was supposed to work in theory.
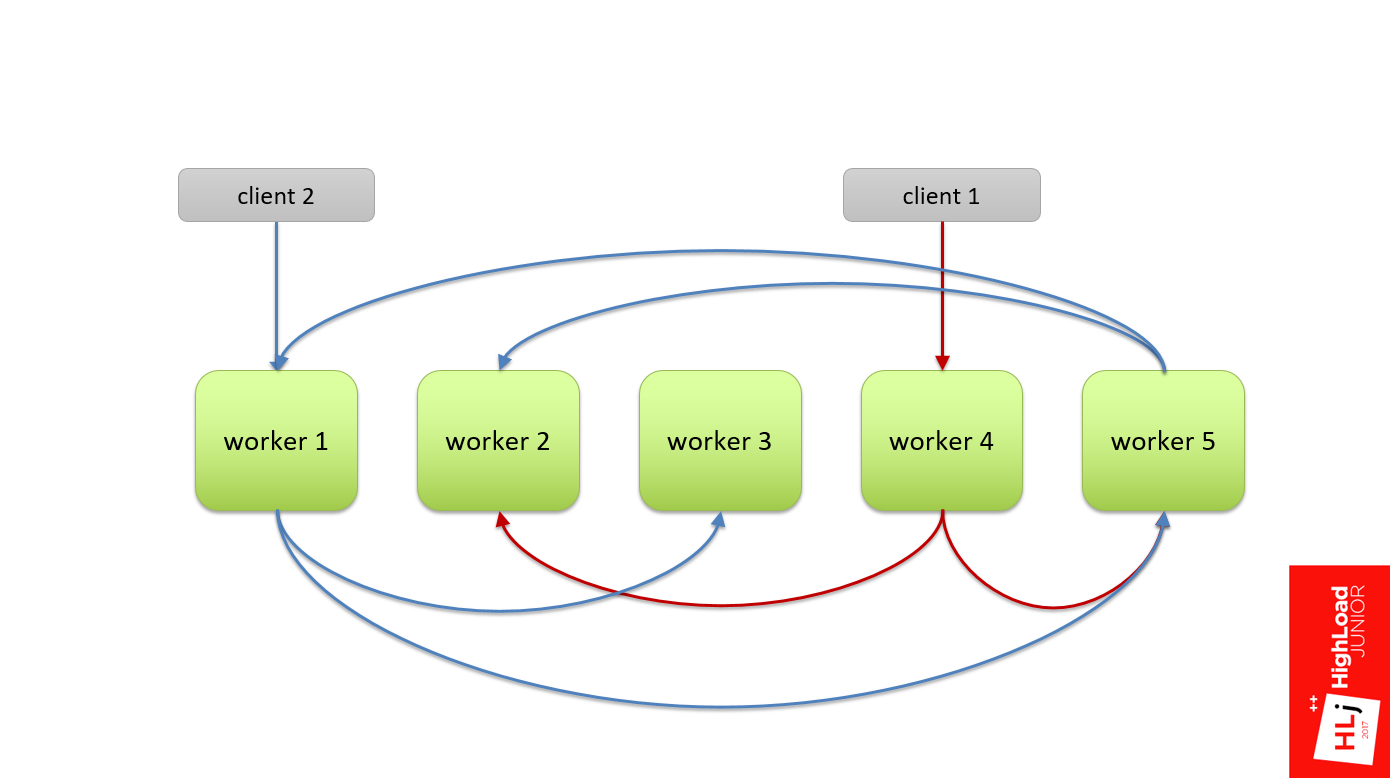
In practice, we did not have a hierarchy, that is, all the workers were equivalent. When a client flew in, he randomly chose a worker (in Fig. This is worker 4). Within the framework of the request, this worker became a master and divided this request into subqueries and also randomly chose his 2nd and 5th worker for himself as an apprentice.
With the second query, the same thing: randomly select the 1st worker, he divides it and sends it to the 3rd and 5th.
But there was such a feature that this query tree was multilevel, and the 5th worker could also decide to divide his query into several subqueries. He also chose some nodes from the same cluster as an apprentice.
Since the nodes are chosen randomly, it could turn out that he takes and selects the first node and the second node as his sub-apprentice. The figure shows that between the 1st and 5th workers there is a cyclical relationship, when the 1st worker needs the resources from the 5th to fulfill the request, and the 5th needs the resources from the 1st, which not to be.
So do not. This is a recipe for a disaster that has happened here.
At a certain point in the cluster, a chain reaction was started, due to which all the machines left the cluster within 5-10 seconds. The cluster fell into a deadlock . Even if we removed all incoming traffic to it, it remained in a blocked state.
In order to bring it out of this state, we needed to restart all the machines in the cluster. It was the only way. We did it lively, because we did not know the reason for our problem. We were afraid to switch traffic to another cluster, to another data center, because we were afraid to launch the same chain reaction. The choice was between the loss of 50% and 100% of traffic , we chose the first.
Demo
It is easiest to explain what happened through a demonstration. Just want to say that this demonstration does not 100% reflect what was in that system, because it is no longer there. We refused it, including due to architectural problems. In my example, the key points are reflected, but it does not emulate the situation completely.
Two parameters are backlog = 2048 and listen = 2048 while you take as data, then understand why they are important here.
Scenario
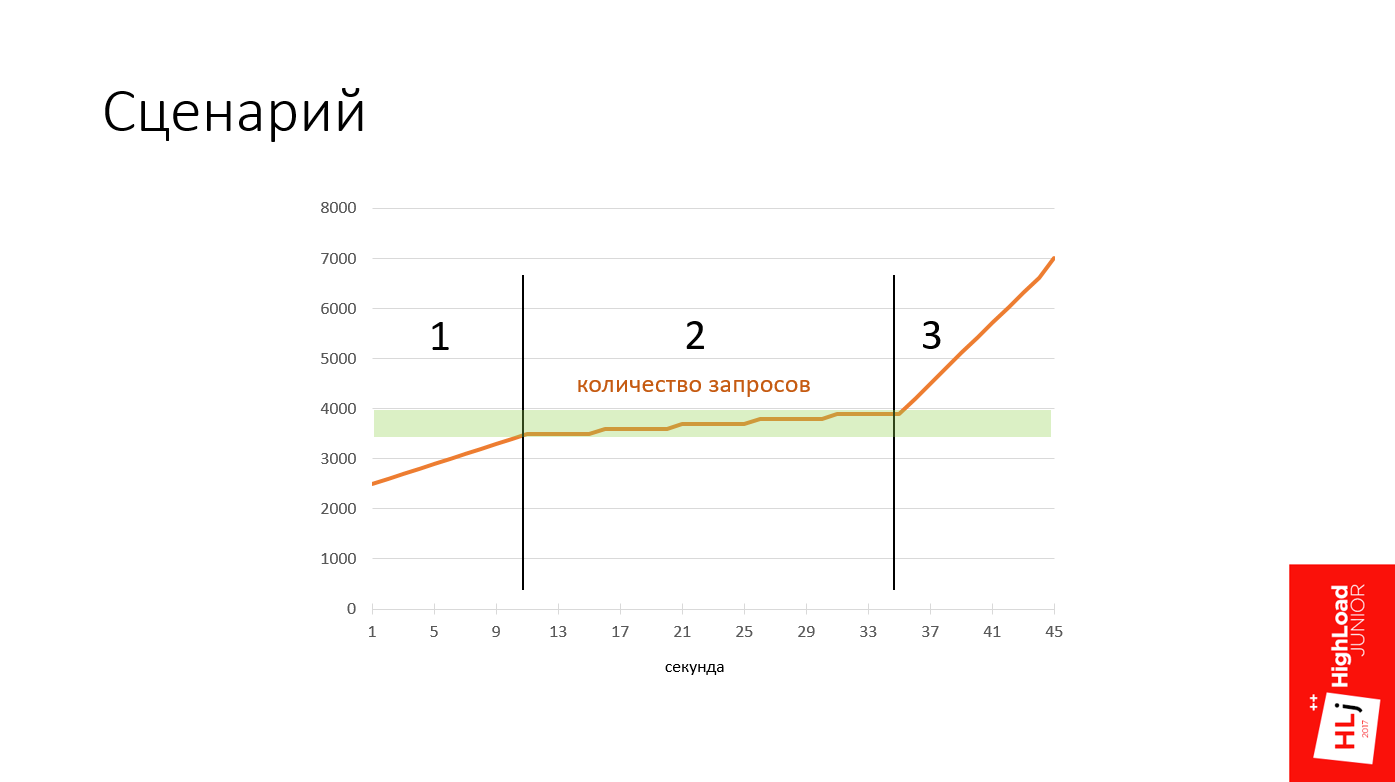
All my demos will take place under the same scenario. The graph shows a plan of action.
There are 3 phases here:
- From 0 to 3500 requests per second;
- From 3500 to 4500 requests per second.
In the second phase, the zone is highlighted in green when the server reaches the saturation point. It is interesting to see how he reacts at this moment. - Server response after the saturation point, when the number of requests per second increases to 7000.
I will demonstrate this all with the help of a samopisny tool that can be found on my GitHub. This is how it looks.
Explanation:
- Histogram of query results for the last 10 seconds:
- * means that some number of requests completed successfully;
- E - requests completed with an error.
- On the left are time intervals from 0 to ~ 1 s on a logarithmic scale.
- The current RPS and the desired RPS are highlighted in yellow.
Go!
We started with 2500 requests per second, the number is growing - 2800, 2900. One can see the normal distribution somewhere around 5 ms.
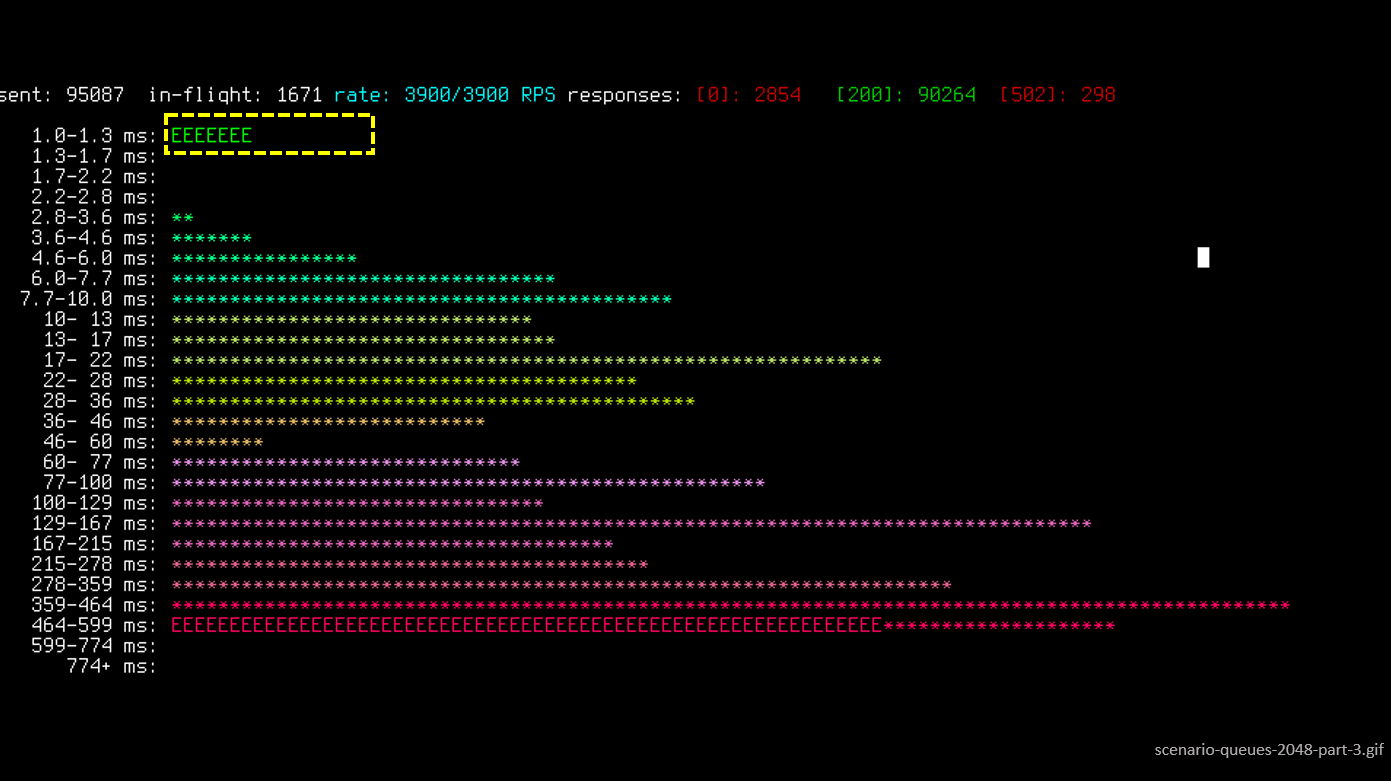
When the server comes to a saturation zone , requests become slower. They flow, flow, flow, and then at some point there is a sharp degradation of the quality of service. All requests have become erroneous. Everything became bad, the system fell.
In the resulting state, 100% of the requests failed , and they were clearly divided into 2 categories: slow failures , which take ~ 0.5 s, and very fast (~ 1 ms).
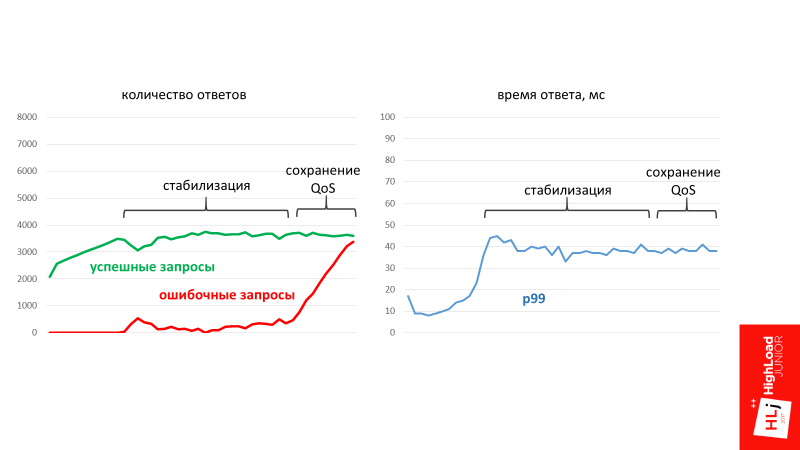
Query graphs look something like the figure below. At a certain point, a qualitative change occurred, all positive requests were replaced with negative ones, and the 99th percentile of response time significantly degraded.
Steps
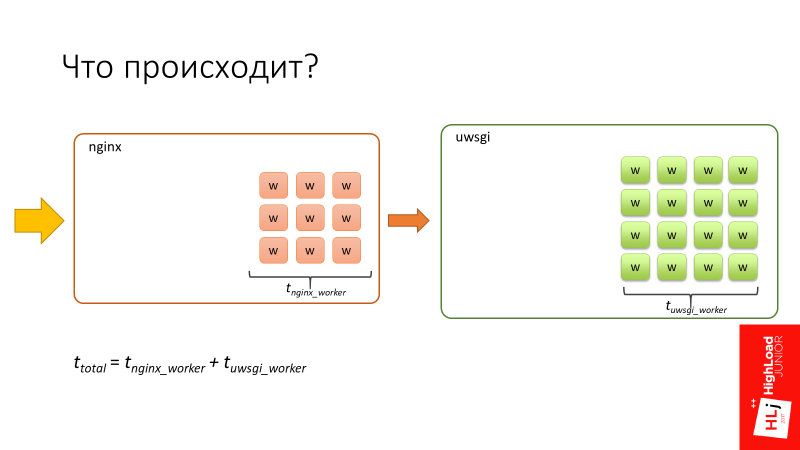
To begin with, the system processes requests in a normal state when it is not under load. Once again, the explanation is simplified.
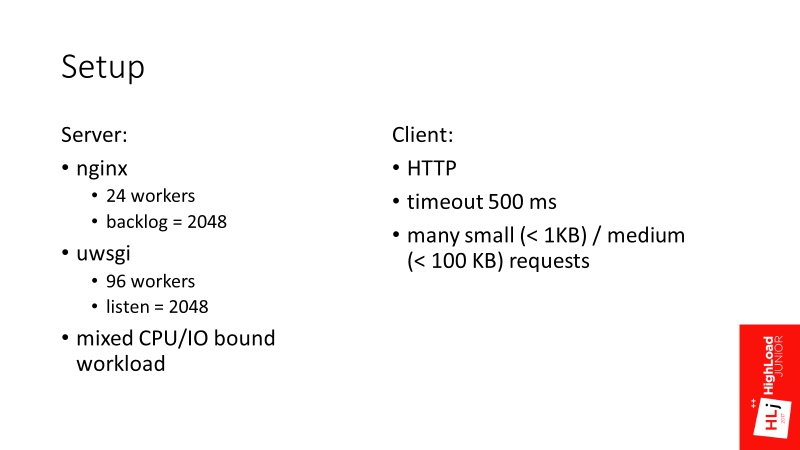
- Nginx at the entrance receives a request.
- In nginx there are 24 workers.
- The request is being processed for some time in nginx.
- Nginx redirects the request to uWSGI.
- 96 uWSGI workers are Perl processes that also take some time.
- The sum of the time that the request spent in nginx and in uwsgi is
Let's look closely at the degradation zone, in which requests flow into slower ones. The pause is set in an interesting moment, because if you pay attention to the number of in-flight requests (requests that are happening right now), there are 94 of them. Let me remind you that we have 96 uWSGI workers.
It is at this point that a significant degradation of quality service occurs. That is, all requests abruptly become very slow, and everything ends up with an error.
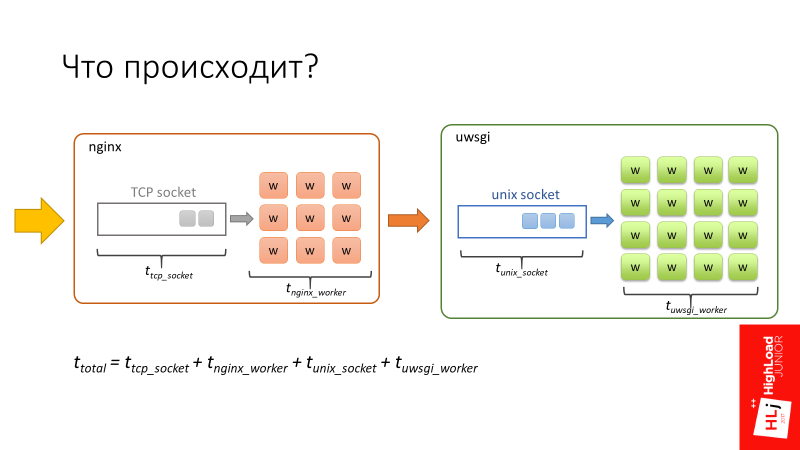
We return to the chart.
- When a request enters nginx, it first enters the queue, which is associated with
TCP socket , which is at the input of nginx. - Further, when the nginx worker connects to uWSGI, the request also spends some time in the queue associated with
Unix socket uWSGI.
The total request time is made up of these 4 components.
There is a feature here. nginx is great fast software . In addition, nginx workers are asynchronous, so nginx is able to process the queue very quickly, which is in the TCP socket.
The uWSGI workers are synchronous, on the contrary. In fact, these are barley-based processes, and when the number of requests that arrive in the system begins to exceed the number of available workers, a queue begins to form in the Unix socket.
In Setup, I focused on 2 parameters: backlog = 2048 and listen = 2048. They determine the length of this queue, which in this case will be up to 2048 long.
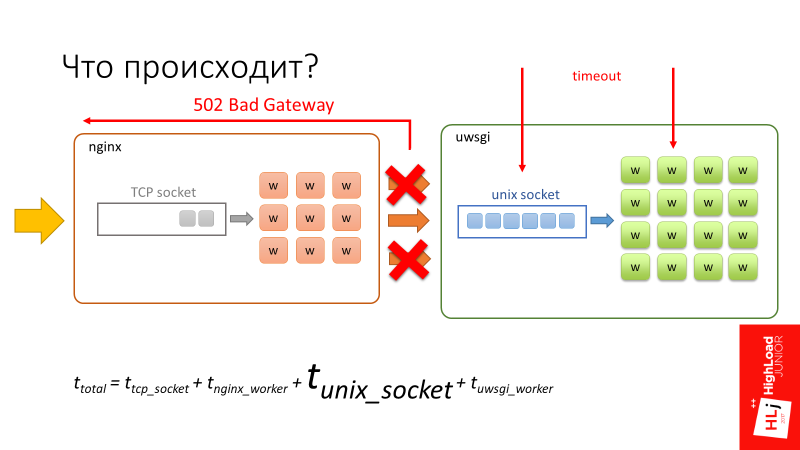
The request begins to spend significant time in the unix socket, just sitting in a queue and waiting for its chance that the worker at uWSGI will be released and start processing it. At this point, a timeout of 500 ms occurs. The client side tears up the connection, but tears it up only to nginx .
From the point of view of uWSGI, nothing happens. For him, this is a fully established connection , since the requests are small, they all lie in the buffer. When the worker is released and takes the record, from his point of view, this is an absolutely valid request that he continues to execute.
This is not the case in the figure, but if at this moment you look at the server, it will be 100% loaded , it will continue to process these dangling connections, dangling requests.
That is, it turns out that the client does the work, sends requests, but receives 100% errors. The server, for its part, receives requests, honestly processes them, but when it tries to send back the data, nginx says to him: “No one needs this answer!”
That is, the client and the server are trying to talk, but do not hear each other .
Next stage
All requests degraded into erroneous, their number per second continues to grow. At this moment, the nginx worker, trying to connect to socket uWSGI, gets error 502 (Bad Gateway), since the queue is full.
Since in this case the request time is limited only by processing in nginx, the answer is very, very fast. In fact, nginx only needs to parse the HTTP protocol, make a connection to the unix socket and that's it.
Here I want to return you to the original problem and tell you in more detail what is happening there.
The following happens. For some reason, some workers have become slow, we will not dwell on why, take it as given. Because of this, the uWSGI workers start to end and form a queue in front of them.
When a client request arrives, the 1st worker sends the request to the 5th one, and this request must defend its turn. After he defended his turn and began to be processed by the 5th worker, the 5th worker in turn also divided his request into subqueries. The subquery arrives at the first worker, in which he must also defend the queue.
Now there is a timeout on the side of the 1st worker. At the same time the request is broken, but the 5th worker does not know anything about it. He successfully continues to process the original request. And the 1st worker takes Retry to the same request.
In turn, the 5th worker continues to process, there also happens a timeout, because we have defended a queue in the 1st. It terminates its request and also makes Retry.
I think it is clear that if the process continues, spinning this flywheel, in the end the whole system will be crammed with requests that are not needed by anyone. In fact, it turned out a system with positive feedback . This put our system.
When we analyzed this case, which, by the way, took a lot of time, because it was completely incomprehensible what was happening, we thought: since we spend a lot of time in the unix socket (we have a very long 2048 items), let's try it is less, so that each worker has only 1 element.
Let's now see how an absolutely same system behaves with a single changed parameter - the queue length.
The scenario is the same as last time: starting with 2500, we also raise requests: 2900, 3000, 3100, 3200. We enter the zone when the system is not stable. Inquiries are slowly falling down, but not degrading so fundamentally. This system is stabilized literally in the region of 45 ms. It continues to successfully process requests, but at the same time some part of them leads to errors.
On the graph it looks like this.
At a certain point in time, the system has stabilized the number of requests that it can successfully process. At the same time, at the time of stabilization, erroneous requests began to form. This is the number of requests that the system is not able to process at the moment.
It turns out that due to the length of the queue, the system will always take only the request that is most likely to be successfully executed. According to statistics, this volume of requests is always fixed. The rest of the system simply ignores and gives error 502.
In the third phase, when the number of requests sharply bullying, the system still retains its performance. Moreover, it retains its quality of service, that is, the p99 response time does not grow, it has stabilized.
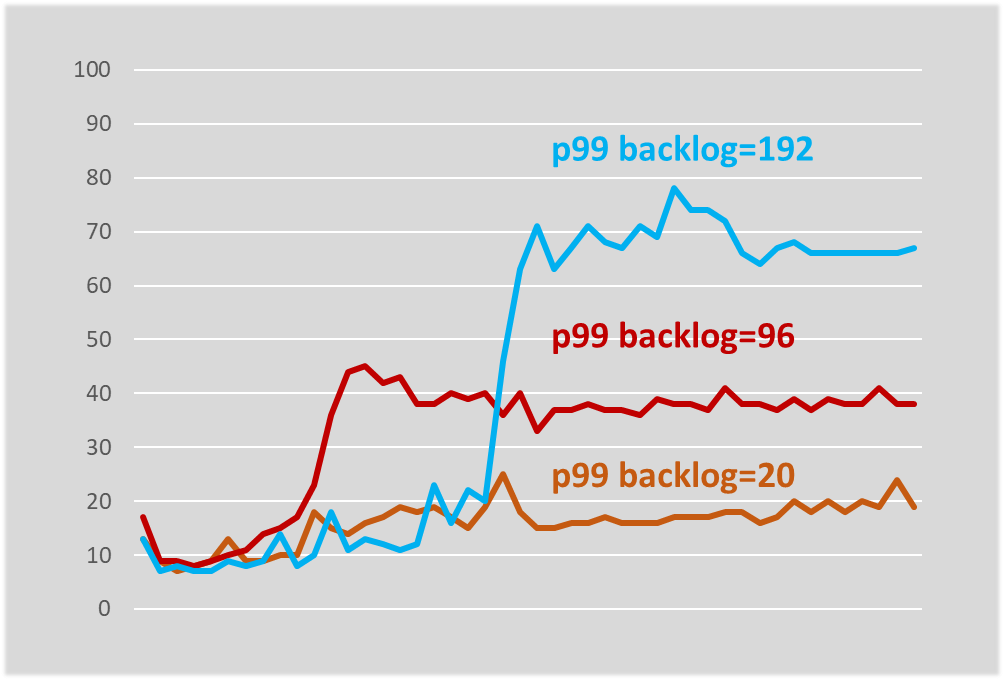
This is what we started in production with, I will tell you more about this. I experimented with the queue length and it turned out that the queue length determines, at least in our system, the worst response time.
The system has stabilized at a slightly higher response time, but it is still stabilized. If you try to limit the queue literally at 20, then the response time does not practically grow at all, changing only by a few milliseconds.
How we solved our problem
In the short term:
Reducing the queue length, first of all, conditionally broke the cycle . Conventionally, then the cyclic dependence is still present, but the properties have changed. The fact is that a particular server, if it does not have enough resources to process an incoming request, will simply reject the request. And this will be done very quickly, with a minimum of overhead. If there are enough resources in this server, the request will be accepted. As a result, the cycle, if this particular server is loaded, breaks.
Moreover, there is one more nuance. In the first example, there were 2 error classes — very fast (~ 1 ms) and very slow (~ 500 ms). By reducing the length of the queue, all slow errors were translated into a series of cheap ones, that is, we made them very fast. Thanks to this, we have become cheap replays . The situation has ceased to repeat, when we, by doing Retry, in fact once again load some second component.
In the long run, of course, we had to switch to a 2-step architecture, which would coincide with the logical architecture. This we did in the next iteration, when we developed a replacement for the search service.
Build a predictable RPC system
Now let's talk about what components you need and what you need to keep if you want to build a predictable RPC system - a framework with predictable system behavior in boundary conditions. I'll tell you about what we have, what approaches we use, without reference to a specific service.
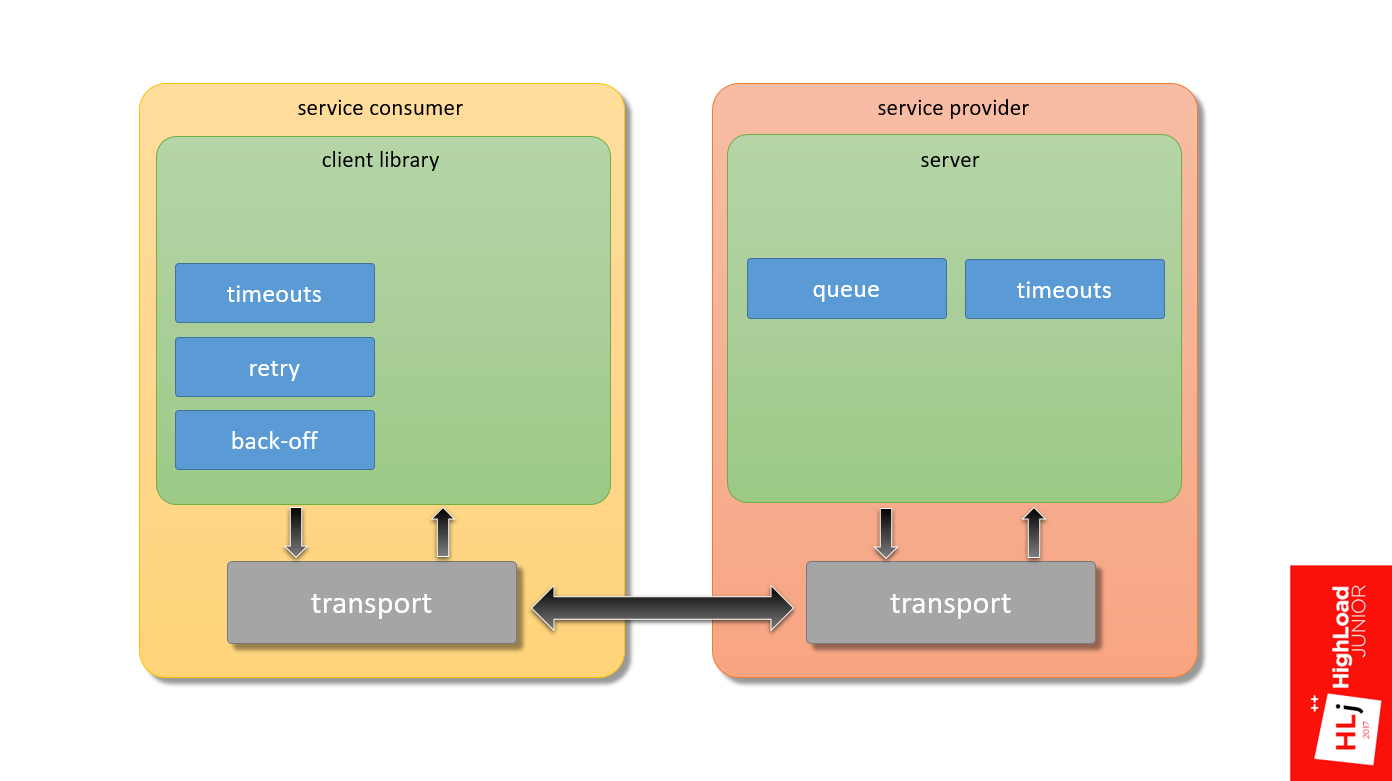
Returning to the first diagram (the interaction between the client and server), we have already touched the first 2 bricks that need to be properly configured:
- Queues on the server side;
- Timeouts on the client side.
We have already dealt with slow errors - we transferred them to the category of fast ones, what to do with fast errors?
It is necessary to consider 2 different cases.
First, what to do when the system is in the saturation phase ?
Here, in fact, nothing can be done! When the system is in the saturation phase, it has run out of resources, and it cannot process anything new. For example, I can carry 100 kg, but give me 101 kg, and I will fall.
This is a very good feature, because here it is, in fact, about 2 very important, in my opinion, component of any framework:
- Fail fast. That is, if some kind of error occurs, we do it very quickly.
- Mild degradation ( Graceful degradation ). If there is a significant load, the system will always consistently successfully handle a certain percentage of requests, instead of completely dropping.
Secondly, what to do if the queue overflows briefly ?
This is possible if, for example, there was some kind of delay in the network, requests accumulated in it, and some of them arrive at the server at once, briefly filling the queue.
In this case, a very simple and reliable mechanism is to take and repeat (Retry). One more brick falls on our diagram.
Retry
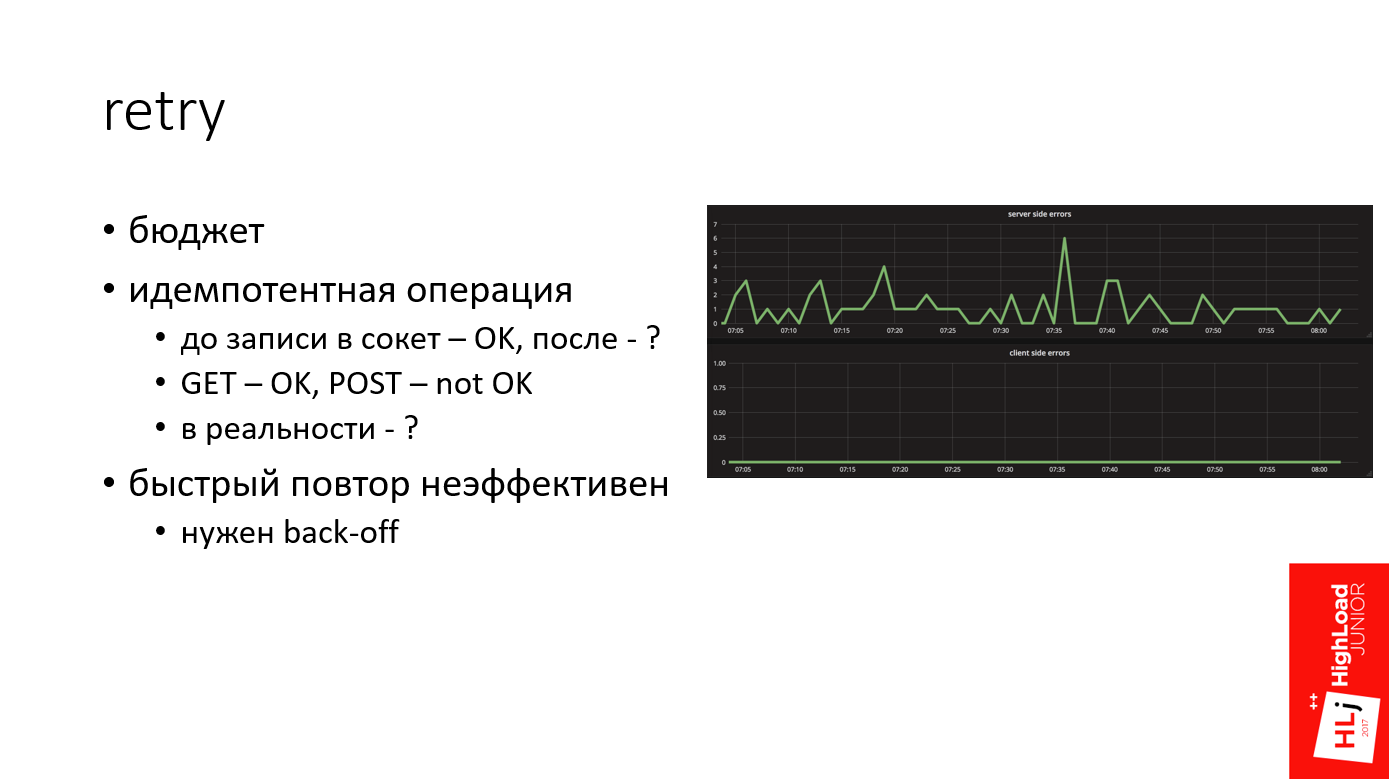
In my practice, Retry is a powerful mechanism that allows in many cases to get off the water. For example, on the chart above, this is the number of errors on the server side, and below is the number of errors on the client side. It can be seen that for some reason the server constantly generates errors, but on the client side nothing is visible.
Quite often it happens that even if we have any problems on the server side for any reason, they don’t reach the client due to competent Retry.
When we talk about Retry, it is important to keep in mind:
- Retry should not be infinite. It should always be limited to the budget . We usually use 3 attempts.
- It is safe to repeat only idempotent operation . This is the operation that no matter how many times you use it, the result will be the same.
When we send an HTTP request, everything that happened until the moment when we sent data to the server, that is, in fact, was written to the socket - this is a safe operation, because we haven't sent anything to the server yet. For example, if you had some kind of error when you tried to convert a DNS address, or simply the server is not available, then this is normal.
Everything that happened after that is questionable, because the HTTP standard for read operations performed by the GET method are idempotent by default, which is not the case for POST.
This is in theory, but in practice it comes out in different ways, depending on the system. For example, there are a number of systems that write: “Sending GET requests somewhere there.” Therefore, we must look at a specific system.
- Another important point - fast replay is not effective (in my practice).
Imagine that a short-term problem has occurred on the network, for example, a route is being rebuilt, some host has become unavailable for a short period of time. If you repeat it once, after the second, third, then you will burn your budget in just a few milliseconds. It is not effective. You have not given any chance for the system to recover.
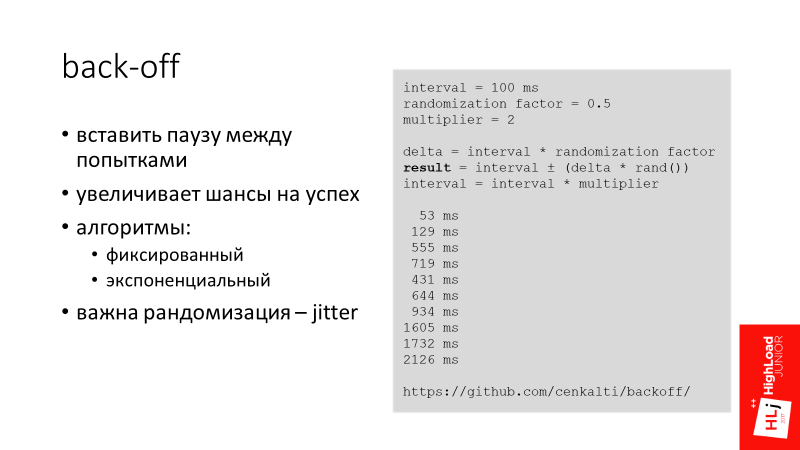
Back-off
We’ll put another brick on the diagram into the service consumer block - back-off.
The main idea behind the back-off is to insert a pause between attempts in order to increase the chances of success. So we give the system a chance, and wait on our side, hoping that the system will recover itself.
I know several back-off algorithms:
- Fixed - when between attempts an equivalent interval. For example, the first request failed, we retreated for 100 ms, tried the second, again did not work, again miss 100 ms.
- Exponential. For example, the first time we indent by 10 ms, then by 20, 40, etc.
Another important factor when we talk about back-offs is the randomization of indentation intervals - jitter.
Imagine that 100 requests are flying to you that arrive at one moment and briefly overload the server. All requests receive an error. Now we indent for 100 ms, and the same requests again go to the server. The situation, in fact, repeats itself - they just overload the server.
If the server locally add some randomized delta to the indent, it turns out that all the second requests will be spread out over time and arrive at the server more than once. The server will have much more chances to process them.
We use an exponential randomized interval in Booking.com (see example). For example, the first indent is 53 ms, then 129 ms, 555 ms, etc.
Timeout
The next brick is server-side timeouts, more precisely, timeout consistency on the client and server sides.
I have already touched on this topic. It is important that when the client falls off, the server does not continue to process that request.
In modern frameworks there is such a mechanism as cancellation of the request - request cancellation . Our framework, unfortunately, does not have such properties, so we had to work around this problem.
When our client flies to the server, it sets the HTTP header - X-Booking-Timeout-Ms , which says what its timeout is. After that, the server takes this data and sets its local server timeout based on the client and some delta to allow the request to fly to the server:
server timeout = client timeout + delta
It turns out that when a client falls off after 100 ms, the server will fall off, for example, literally after 110 ms. That is, the request is canceled.
The diagram already has 5 elements that are not needed when the system is stable. They are required when everything is bad, in fact, as backups. These components are not needed in normal life, but when they are needed, they are really needed .
There are people who still do not make backups. But those who have had negative experience, periodically restore backups. We are essentially for these purposes, that is, in order to test our entire stack, we use Chaos Monkey.
Chaos monkey
Initially, the idea of Chaos Monkey was that we turn off the data center and see how our system responds. We have not yet reached such a scale - our scale is more modest. But there are interesting things you want to talk about.
We have 3 types of Chaos Monkey.
1. HTTP client verification
We expect a special behavior from the client when, for example, 502 responses from nginx arrive to it. We know that this is a cheap answer, so the client automatically repeats it. To test this logic, a certain percentage of requests take and artificially eject 502 responses. In my opinion, we have this 1% artificially created errors in production.
That is, Chaos Monkey really spoils 1% of internal requests in order to make sure that when real requests come, the system will correctly process them.
2. Mild degradation of applications
The second type of Chaos Monkey is more interesting. What does soft degradation of applications mean?
Imagine that there is a search page, it has the main search functionality, which is our main business. This functionality is bound by minor components that also make remote calls.
If this minor component falls, we don’t want the entire page to fall. We expect from a developer who writes minor components that he will develop the system so that when an error from a minor request arrives, we do not generate a 500th answer for our client. To do this, our servers periodically generate 400th responses that mean that the request was incorrectly formed, and therefore the HTTP client forwards it to the topmost stack into the application, which is visible to the developer.
This mechanism Chaos Monkey works for us only within the company. It is clear that if we run this in business, we can lower the conversion, which is not good.
Since we are really talking about the failure of part of the functionality, we always have a list of critical queries, for example, the same basic search query, which does not participate in this logic.
3. Readiness for delays in replication
The last kind of Chaos Monkey stands a little apart. We have a data retrieval system, to which the client comes and says: “I have 1000 records, give me all of them!” But this system uses MySQL for data storage and it may turn out that some of these records have only been recorded and the master record did not have time to fly to the slave. Therefore, from time to time it happens that the system responds that it has 900 and 100 does not yet, because they did not have time to fly to the slave and appear later.
With the Chaos Monkey mechanism, we test this functionality. The system generates the correct 200th answer, but emulates the logical error that some of the records are simply missing. This also works in production.
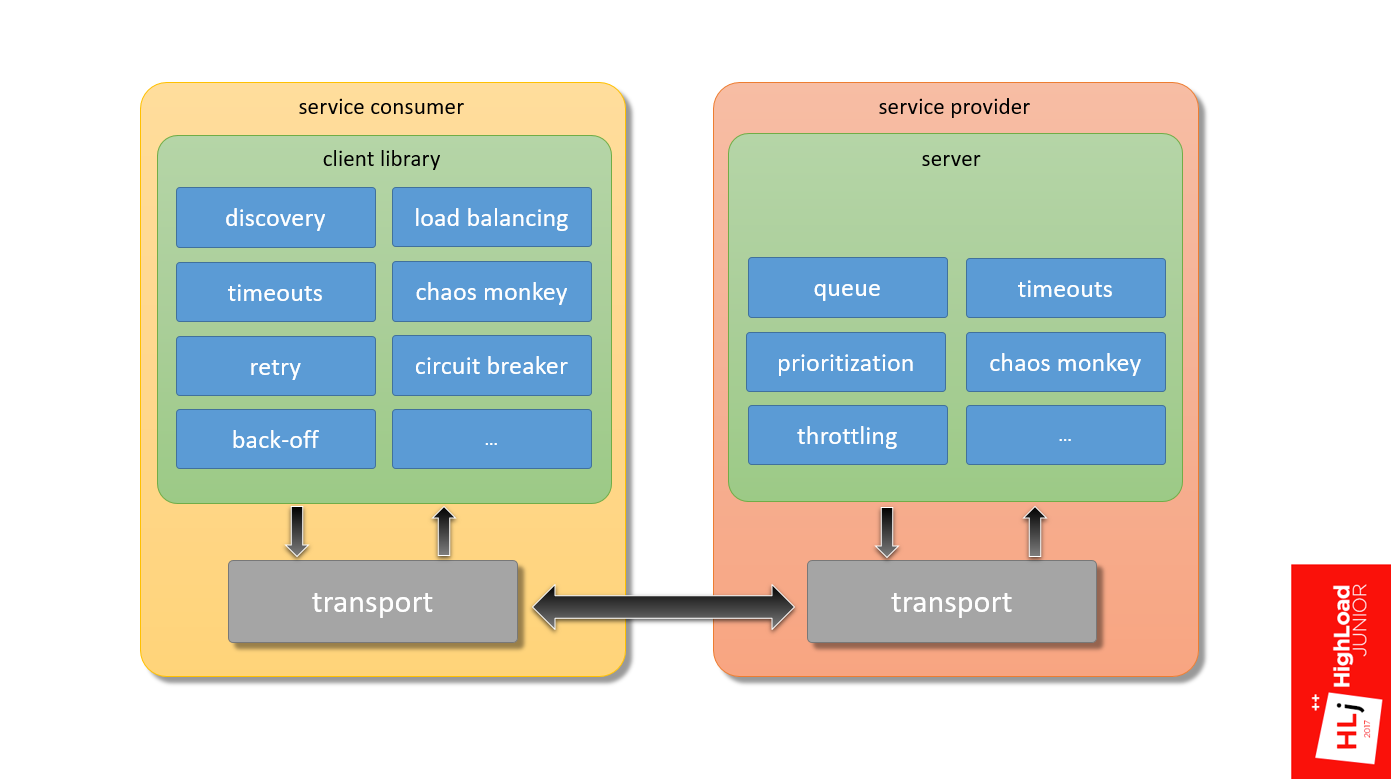
We return to the chart.
In fact, the components are much larger. Only from what I know:
- On the server side, prioritization of requests and throttling is needed .
- On the client side, there is such an interesting thing as a circuit breaker , when the client locally decides not to send a request to the server so that just the service consumer knows who he is talking to.
- We need discovery logic , smart load balancing and much more.
This is if we talk only about the stack above the transport, and there is still a lot of everything inside the transport that needs to be properly configured in order for the system to work predictably.
Conclusion
Predictable HTTP request sending is a difficult task! There are so many components that need to be properly configured. All systems are different, there are no silver bullets.
In short, test and test ! In my opinion, the only way to make the system work is to put it in boundary conditions and see how it will react.
In Booking, we had to slightly reinvent the wheel and write our own framework. Most likely, you do not work with Perl, so you are lucky a little more.
Look at frameworks such as gRPC and Finagle. If you prefer proxy servers, then Linkerd and Envoy. I’ll say right away that I don’t have any experience with production systems, I cannot recommend anything concrete.
Last - experiment with the queues . In our experience, we realized that the length of the queue can drastically change the behavior of the system, which happened to us. So put a note - try to play.
But please do not copy my example - take and check.
There is an important point - if you want to experiment, control over the client is important, because your system behavior is changing, and it is important that your client adapt as well.
What I showed only works when there is a web server behind nginx that works through a unix socket. TCP socket behaves differently.
That's all for today, and below are links that can help sort out the details:
- https://github.com/ikruglov/slapper
- SRE book
- resiliency patterns
- circuit breaker
- back-off
- tcp_abort_on_overflow
This year we decided to combine the HighLoad ++ Junior and Backend Conf programs - now the topics of both conferences will be considered as part of the Backend Conf RIT ++ . So do not worry, nothing is missing and we still look forward to your requests for reports. And the impatience is growing, registration in the speakers is open only until April 9 .
Source: https://habr.com/ru/post/352132/
All Articles