How do we predict the end date and project evaluation using a neural network?
In the fall of 2017, an internal hackathon on machine learning was held in Sbertech. One of the winners, Nikolay Zheltovsky, presented a project of a neural network that predicts the dates of completion of production tasks. After that, we decided to try it on other tasks - to predict the closing date and the internal final assessment of the project based on the analysis of data on closed projects. Now this system grows into a virtual assistant, which will help managers find potential problems in projects and the best ways to solve them. In this post we will talk about the technical implementation.

All project information is replicated to the reporting database from the HP Project and Portfolio Management. In order for our neural network at Tensorflow to be trained and make predictions, we need to turn the project data into something that is understandable for this API — into vectors.
We start by importing data from the reporting database. Data on closed projects are used to train the neural network, data on active projects are needed for making forecasts. First, once unloaded data for all projects, then the timer is unloaded only the changes. The upload format is * .csv.
')
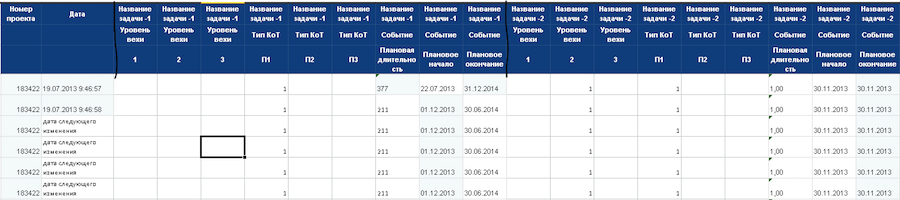
In summary, we get the following table:

In the next step, all this is loaded into MongoDB. Projects that do not have enough data or are not suitable for analysis for other reasons are excluded from processing.
Next, we identify project tasks by comparing them with a list of typical tasks. Tasks in projects are not reduced to a single formulation, the names of similar tasks may differ. Therefore, for recognition, we have compiled a vocabulary directory with synonyms. Same tasks in different projects get a unique identifier. Recognition works so far only in Russian. We exclude projects where it was possible to recognize less than 20% of the tasks, and projects that for any reason have no closing task.
At this stage it becomes clear which project will go to which neural network. We have two neural networks: one predicts the assessment of the project at the close, the other the project closing date. For the training of the first, projects closed with assessment are used, for the second - all closed projects.
On the basis of the columns "Milestone level", "Type of control point" and "Event" create event directories. Then events are tied to the timeline to restore the change history in one-day increments. The first line contains events for one day. Each new line contains previous events + new day events.
We translate values in the range from 0 to 1. Timelines for projects are created on the same identified events, this approach allows you to compare projects of different duration.
We do not take the planned project end date as the end point - we count with a margin. For example, if the project is a year, then the scale for it will be for five years. This is done in order to predict events that are beyond the time frame of the project.

Now all data have the desired format. You can prepare incoming vectors for a neural network. Each column in the table is a neuron, a combination of three elements: a project task, an event, and an event value. Now we have about 25 thousand neurons.
To increase the amount of data used in training, we generate synthetic data with different distortions:
To teach our neural network, we use a set of control vectors that allow it to compare data about a project with an end result. The first network is learning to forecast project estimates, the second one predicts the project closing date.
Below are examples of control vectors for each of the networks.
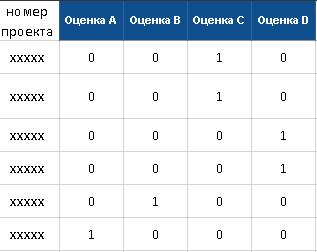
Control vector for a neural network predicting project evaluation
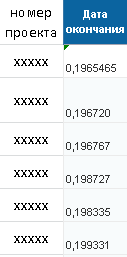
Control vector for a neural network predicting the project end date
After loading, learning begins with standard Tensorflow tools. The learning vectors are input, and the output is compared with the control vectors. The result of the comparison is sent back to the neural network to adjust the training. The process can be monitored through a graphical interface. After the network is trained, the vectors of projects for which you need to build a forecast are fed to the input. The forecast has the format of the control vector, on the basis of which a report is generated for all current projects.
Now we are completing work on automating all stages of data preparation and neural network learning process using Jenkins. It is usually used for assemblies, but here we have expanded the scope of application. Created tasks on data import, training of training vectors and neural network training. Made the ability to customize the task of building a forecast.
This system has two main directions of development. We are working on connecting new data sources - these are various accounting systems of Sberbank related to project management. We also develop an algorithm for issuing recommendations for improving the management of problem projects. So that the neural network could, for example, advise which specialists need to be connected to the project in order to complete it in time. A huge number of different ideas appear here, since the neural network should explain why it should be done exactly as it recommends. This is called Explainable Artificial Intelligence (XAI) Explainable Artificial Intelligence.
In addition to us, there are several other teams in Sberbank and Sbertech that start Machine Learning startups to predict the number of errors in releases, incidents based on user feedback and data from monitoring systems. Colleagues are sure to share their cases.
All project information is replicated to the reporting database from the HP Project and Portfolio Management. In order for our neural network at Tensorflow to be trained and make predictions, we need to turn the project data into something that is understandable for this API — into vectors.
Preparing vectors for Tensorflow
We start by importing data from the reporting database. Data on closed projects are used to train the neural network, data on active projects are needed for making forecasts. First, once unloaded data for all projects, then the timer is unloaded only the changes. The upload format is * .csv.
')
In summary, we get the following table:
In the next step, all this is loaded into MongoDB. Projects that do not have enough data or are not suitable for analysis for other reasons are excluded from processing.
Next, we identify project tasks by comparing them with a list of typical tasks. Tasks in projects are not reduced to a single formulation, the names of similar tasks may differ. Therefore, for recognition, we have compiled a vocabulary directory with synonyms. Same tasks in different projects get a unique identifier. Recognition works so far only in Russian. We exclude projects where it was possible to recognize less than 20% of the tasks, and projects that for any reason have no closing task.
At this stage it becomes clear which project will go to which neural network. We have two neural networks: one predicts the assessment of the project at the close, the other the project closing date. For the training of the first, projects closed with assessment are used, for the second - all closed projects.
On the basis of the columns "Milestone level", "Type of control point" and "Event" create event directories. Then events are tied to the timeline to restore the change history in one-day increments. The first line contains events for one day. Each new line contains previous events + new day events.
We translate values in the range from 0 to 1. Timelines for projects are created on the same identified events, this approach allows you to compare projects of different duration.
We do not take the planned project end date as the end point - we count with a margin. For example, if the project is a year, then the scale for it will be for five years. This is done in order to predict events that are beyond the time frame of the project.
Now all data have the desired format. You can prepare incoming vectors for a neural network. Each column in the table is a neuron, a combination of three elements: a project task, an event, and an event value. Now we have about 25 thousand neurons.
Synthetic data for training
To increase the amount of data used in training, we generate synthetic data with different distortions:
- Recovery of neighboring tasks . In the absence of a neighboring task, the values of the current task are copied into it with an offset from 0% to 0.005%.
- Blur . From the values of the neurons of the current task is subtracted from 0% to 0.005%. This value is divided in half and added to the neurons of the neighboring task.
- Noises The values of the neurons of the current task are adjusted in the range of 0.005%.
- Zanulenie . The values of the neurons of the current task are zeroed out, that is, we assume that such a task may be absent in another project.
- Confusion A combination of previous distortions is used.
Tensorflow work
To teach our neural network, we use a set of control vectors that allow it to compare data about a project with an end result. The first network is learning to forecast project estimates, the second one predicts the project closing date.
Below are examples of control vectors for each of the networks.
Control vector for a neural network predicting project evaluation
Control vector for a neural network predicting the project end date
After loading, learning begins with standard Tensorflow tools. The learning vectors are input, and the output is compared with the control vectors. The result of the comparison is sent back to the neural network to adjust the training. The process can be monitored through a graphical interface. After the network is trained, the vectors of projects for which you need to build a forecast are fed to the input. The forecast has the format of the control vector, on the basis of which a report is generated for all current projects.
What's next?
Now we are completing work on automating all stages of data preparation and neural network learning process using Jenkins. It is usually used for assemblies, but here we have expanded the scope of application. Created tasks on data import, training of training vectors and neural network training. Made the ability to customize the task of building a forecast.
This system has two main directions of development. We are working on connecting new data sources - these are various accounting systems of Sberbank related to project management. We also develop an algorithm for issuing recommendations for improving the management of problem projects. So that the neural network could, for example, advise which specialists need to be connected to the project in order to complete it in time. A huge number of different ideas appear here, since the neural network should explain why it should be done exactly as it recommends. This is called Explainable Artificial Intelligence (XAI) Explainable Artificial Intelligence.
In addition to us, there are several other teams in Sberbank and Sbertech that start Machine Learning startups to predict the number of errors in releases, incidents based on user feedback and data from monitoring systems. Colleagues are sure to share their cases.
Source: https://habr.com/ru/post/352054/
All Articles