New Aether Cloud Console for Enterprise Security Management

Panda Security launches the new Aether cloud console for centralized management of enterprise information security. The implemented changes provide significant advantages in managing and promptly responding to critical incidents, especially for medium and large enterprises. Let's look at them.
In recent years, Panda Security has actively developed the functionality of its cloud-based corporate solutions. The most significant event was the release of Panda Adaptive Defense 360's cloud-based security solution in 2015, which was the first cloud-based product that combines next-generation endpoint protection (NG EPP) technologies with end-device attack detection and response technologies (EDR). After that, the product constantly acquired new functions: improved EDR technologies, a new anti-exploitation technology was introduced, a computer remote control system was integrated, a simplified SIEM system was integrated for in-depth analysis of all IT processes. On the way: a new personal data control module and integration of the patch and update management system.
')
Of course, all this has significantly improved the efficiency of these solutions and become a leader in protecting against unknown threats, exploits, cryptographers, fileless attacks and attacks that are not used by malicious programs. But, to admit, the products lacked a new management console that would allow many issues and tasks to be solved faster, easier and more efficiently.
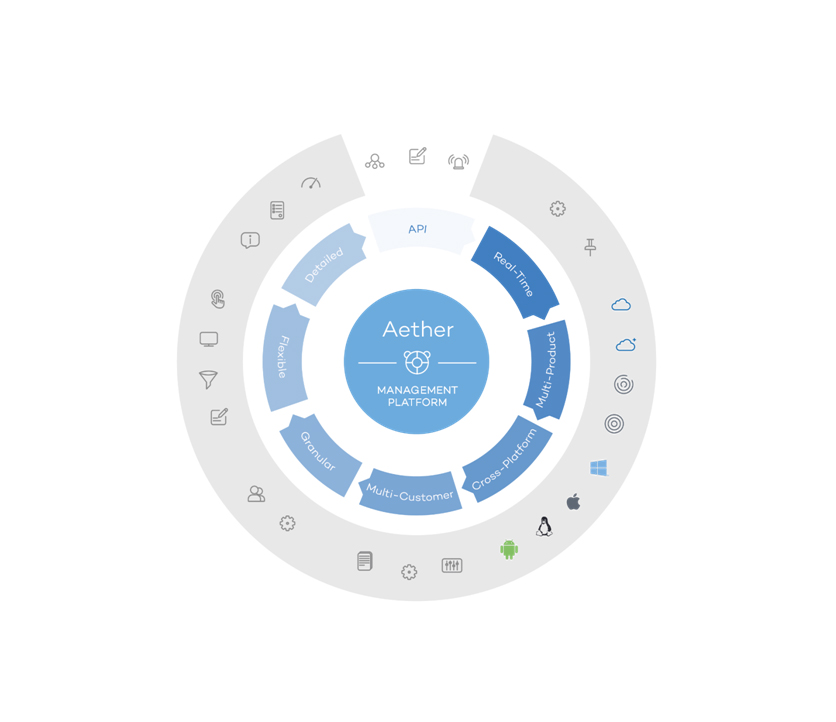
What is Aether?
With the release of the new version of the cloud management console Aether, this gap is eliminated.
Aether is a new, efficient, scalable and extensible platform for centralized management of Panda corporate solutions. And within the framework of a single console with a single agent, centralized protection of devices with Windows, Android, Mac and Linux is provided.
Aether is the management console for the following Panda enterprise products:
• Panda Adaptive Defense
• Panda Adaptive Defense 360
• Panda Endpoint Protection
• Panda Endpoint Protection Plus
The new console, primarily designed to meet the needs of medium and large enterprises, as well as providers of managed security services, was created to solve the following tasks:
1. Translate management processes in real time
2. Simplify the management of protected and unprotected devices
3. Increase transparency and control over user activity.
4. Provide more detailed settings.
Let's go over the new console and see what happened.
Console access:
URL: aetherdemo.pandasecurity.com
Login: DRUSSIAN_FEDERATION_C14@panda.com
Password: DRUSSIAN # 123
After logging in, on the account selection page, select the topmost one from the list with the Panda Adaptive Defense 360 with Advanced Reporting Tool product, and then agree to the license agreement.
Design

The first thing that immediately catches the eye of those who are familiar with the previous (traditional) version of the console - this is a change in design. The product menu is divided into two parts: the main menu is horizontal at the top, and on the left is the context menu, depending on the section selected in the main menu. In addition, the console design is now optimized for use on mobile devices: indeed, depending on the screen size, the appearance and arrangement of the console elements is changed so that all the most significant and necessary things are at hand. Plus, quite conveniently thought out transitions between sections and contextual functions, which allows you to find the required information and options in a few clicks.
In general, the design has become more stringent, but at the same time light and not distracting from work.
Security status
As in the previous version, the main page of the console is the Status section, where you can at a glance evaluate the security status of an enterprise and the status of licenses.
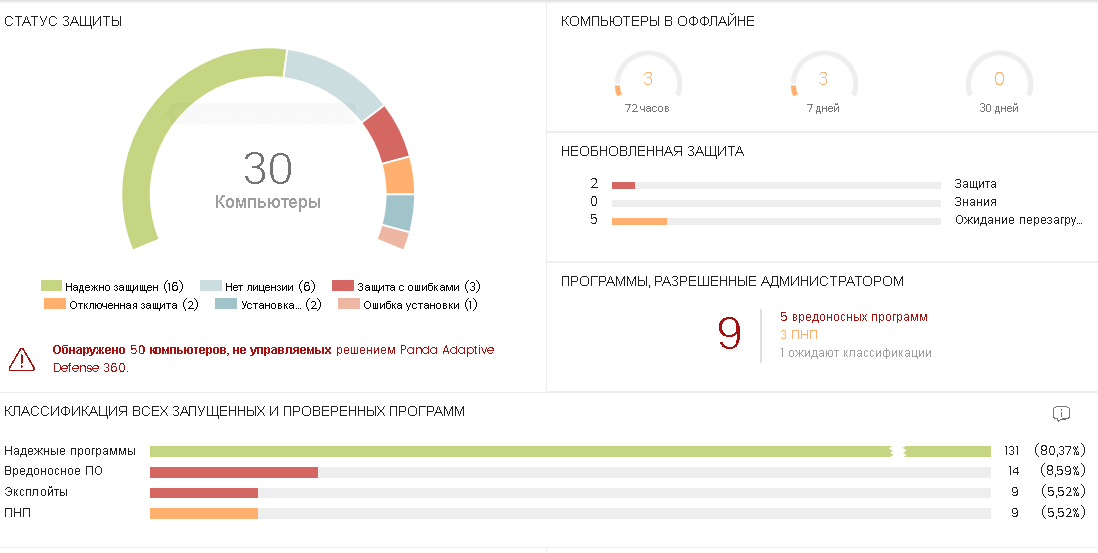
The Security subsection provides general information on security and threats in the form of the following widgets:
• Protection status on all managed devices
• Statistics on offline computers for the last 72 hours, 7 days and 30 days, for devices with non-updated protection or knowledge, as well as requiring a reboot
• Programs allowed by the administrator , depending on their classification (malware, PNP or pending classification in PandaLabs)
• Classification of all launched or checked programs with distribution by type of classification (reliable program, malware, exploits and PNP)
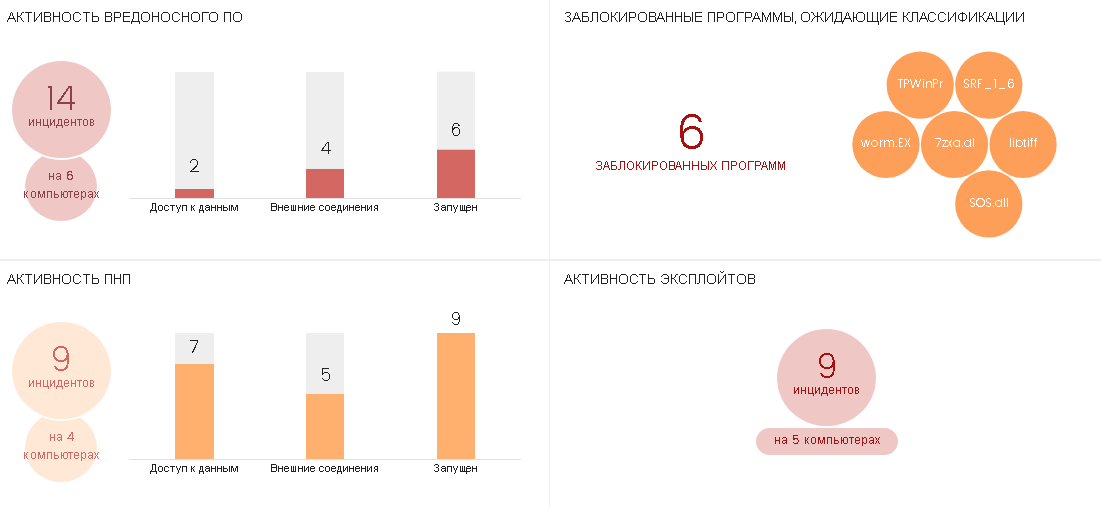
• Automatically unclassified objects belong to blocked programs that are awaiting classification, statistics for which are displayed in the widget of the same name. The stated classification speed is up to 3 days, although as practice shows, in most cases this time period is limited to a few hours.
• Widgets Malware activity, LNG activity and Exploit activity show information on the activity of the respective types of threats.
• Below - distribution by type of threats detected by the antivirus for a selected period of time and statistics on the content filter for Exchange servers.
When you click on the sectors of the diagrams or histogram columns in the widgets, you can go to the corresponding lists, for example, the list of computers on which the PNP activity was observed, or the list of malware activities:
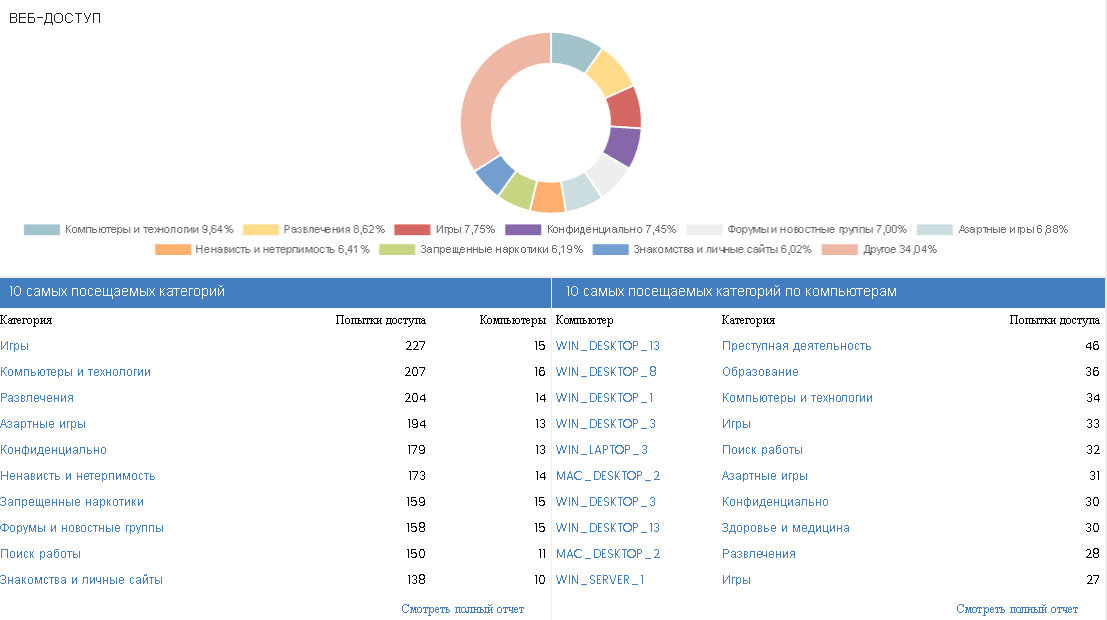
The Web Access and Spam subsection provides statistics on the categories of web sites accessed by users of protected devices, as well as spam data found on Exchange servers.

In both subsections, you can select the time period for which you want to see these statistics: for the last 24 hours, 7 days, a month, or even a year.
Lists
All of the above was also in the previous version of the console, but in Aether, the My Lists section appeared in the context menu of the Status section, in which you can quickly create lists for a variety of criteria with the possibility of adding them to this context menu so that you can quickly access them.
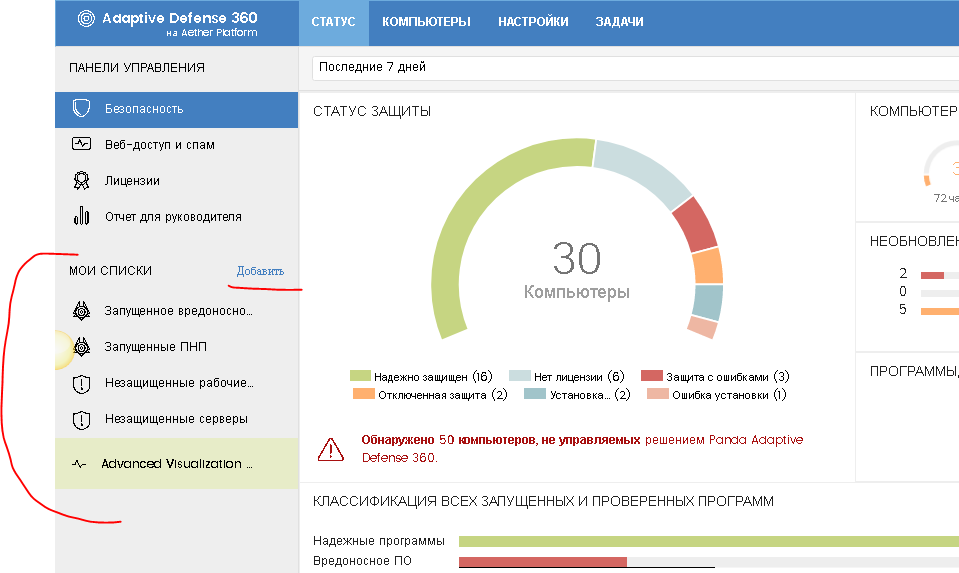
To view and, if necessary, add a new list to the menu, you must click the Add link, then select the type of the list from the options:

Here, for example, is the list of Running Malware with a list of computers that attempted to launch malware.
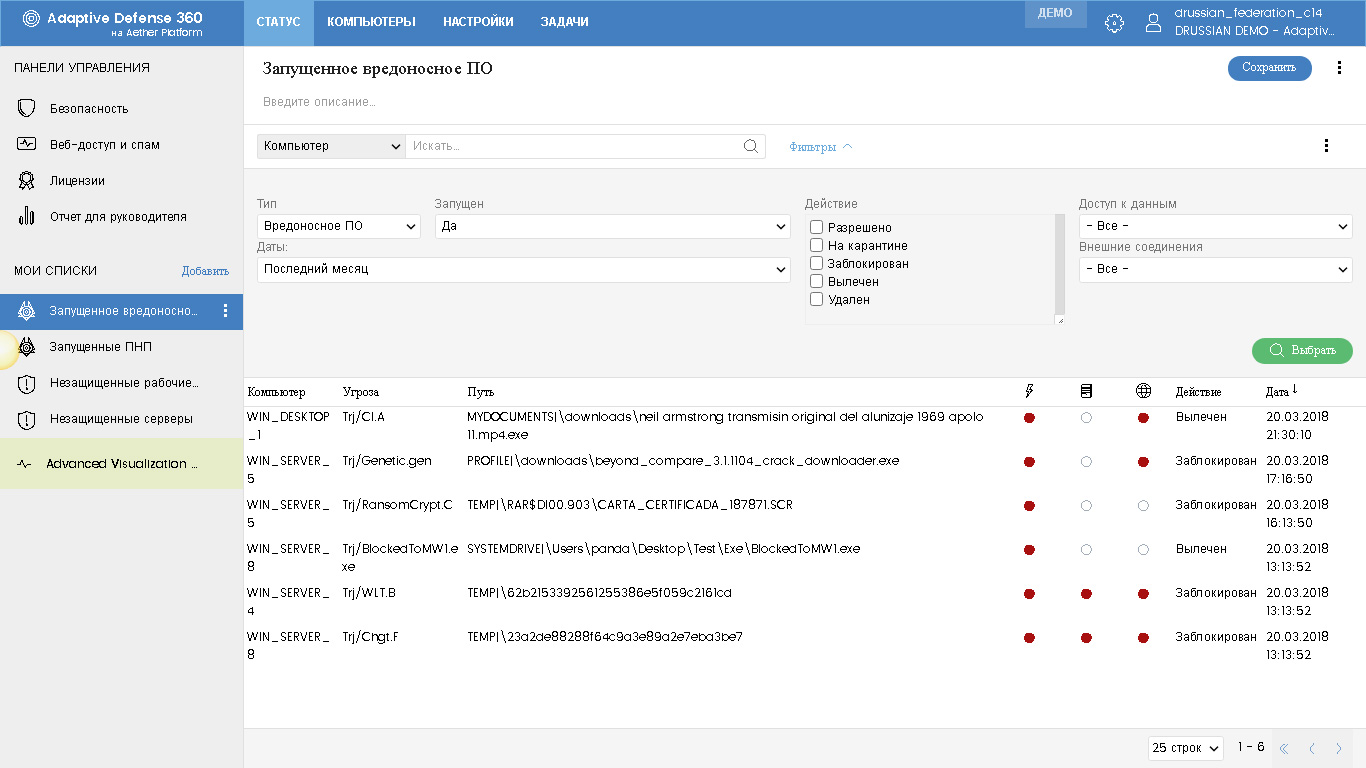
In the table of elements in the selected list all the necessary information is visible. For example, in this list, for each item you can see the computer on which the item was detected, the name of the malware, the path to it on the computer, whether it attempted to launch, access data, perform external connections, what action was taken to this malware Software, date and time of detection.
The table of elements can be sorted in ascending or descending order by any column by clicking on its name once or twice respectively.
When you click on the list item, you go to a page with more detailed information on the selected item (for example, details of malware detection), which I will discuss below.
In the lower right corner elements of page navigation with the ability to select the number of elements on the page.
In addition to the required information with a list of devices, you can quickly customize this list "by yourself":
• Change the name and description of the list
• Change the selection criteria for a variety of parameters
• Copy this list, for example, to create another list based on it
• Export list
• Delete list
As you can see, everything is quite simple and convenient. Working with lists greatly simplifies and speeds up obtaining the required information on the security status and events occurring on the network.
Threat life cycle
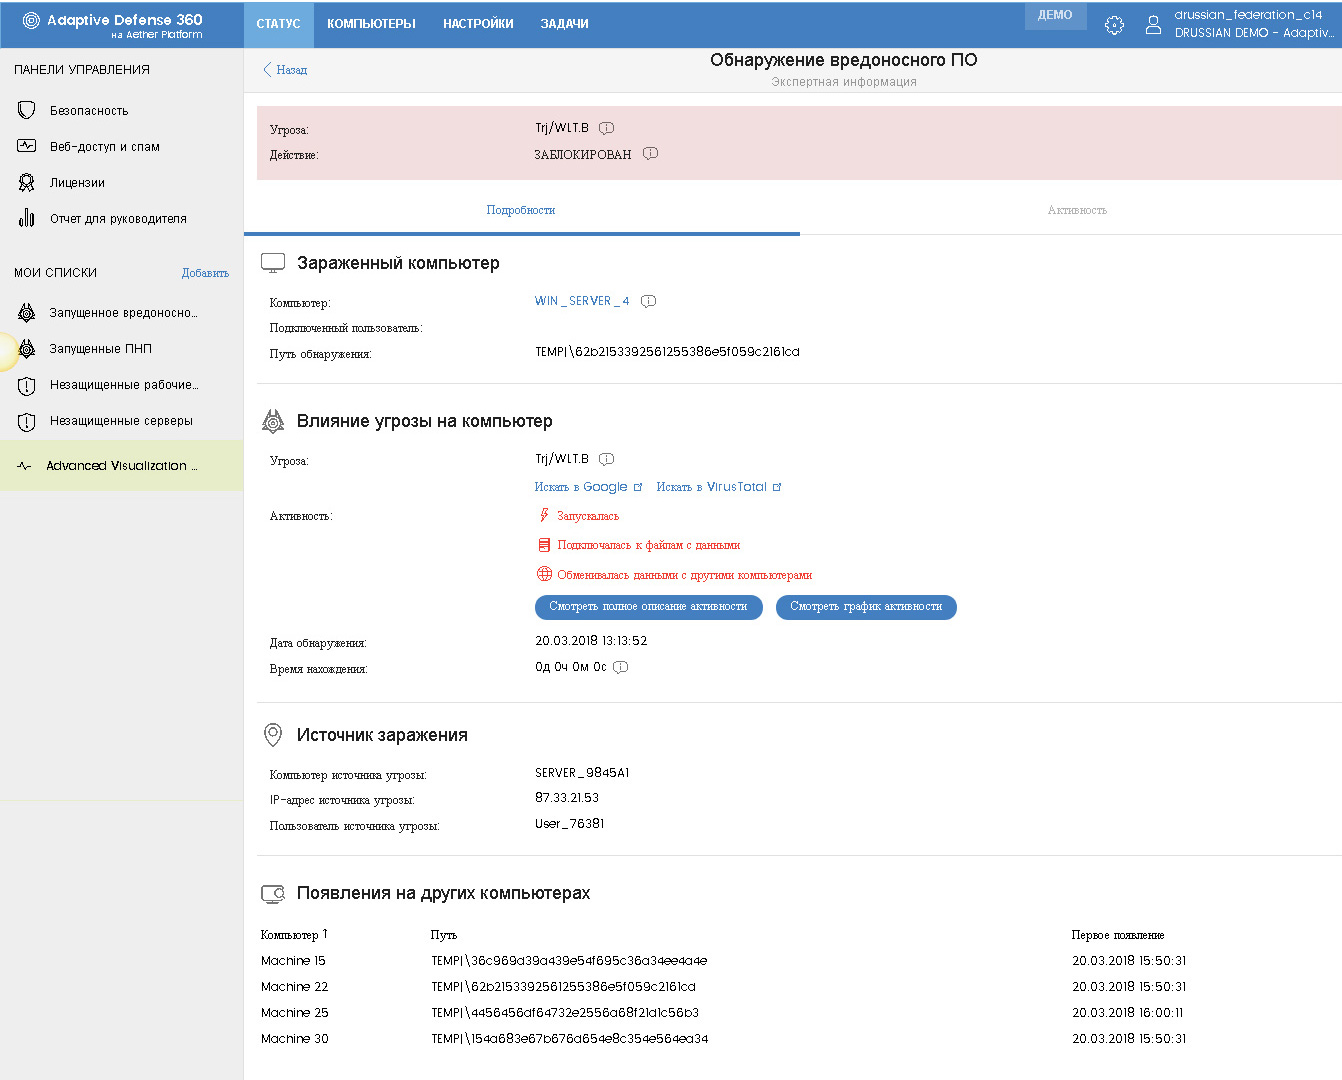
By clicking on the element of the corresponding list or widget, you can go to the page with expert information for each detection. Here, as well as in the previous version of the console, the full information on detection and all events connected with it is presented.
The upper part contains general information on the threat with the ability to exclude from blocking, and for temporarily allowed processes, on the contrary, block.
The Details tab provides the following information:
• Data on the infected computer — name, connected user, and path of detection
• Conclusions on the degree of the threat to a computer - the name, the ability to search for information on it in Google and Virustotal, the date and time of detection. In addition, from here you can go to the details of all processes associated with this threat, up to viewing the activity graph over time.
• Source of infection - the name of the computer where the threat first appeared, its IP address and information about the user who was connected to this computer at that time.
• Information on the manifestation of this threat on other devices on the network.
The Activity tab provides detailed information on all events that are associated with this detection. Since Panda Adaptive Defense monitors all causal relationships between all IT processes, this allows you to make up the entire life cycle of a threat, i.e. its appearance and all processes that were spawned after that: what was launched, downloaded, transmitted, copied, deleted, recorded in the registry, including command line information, registry values, file hashes, protocol and data transfer directions, and much more.

When you click on the Watch activity graph button, you can switch to a graphical representation of the activity of this threat with the ability to view the dynamics over time.
The availability of such detailed expert information for each detection distinguishes Panda Adaptive Defense 360 from other corporate security solutions. Analysis of this information allows you to identify weaknesses in the enterprise security system, suspicious and dangerous activity of employees, possible data leakage incidents.
Leader Report
In the Report subsection for the manager, you can create the required report with information on the status of licenses, network status, discoveries, web access and spam.
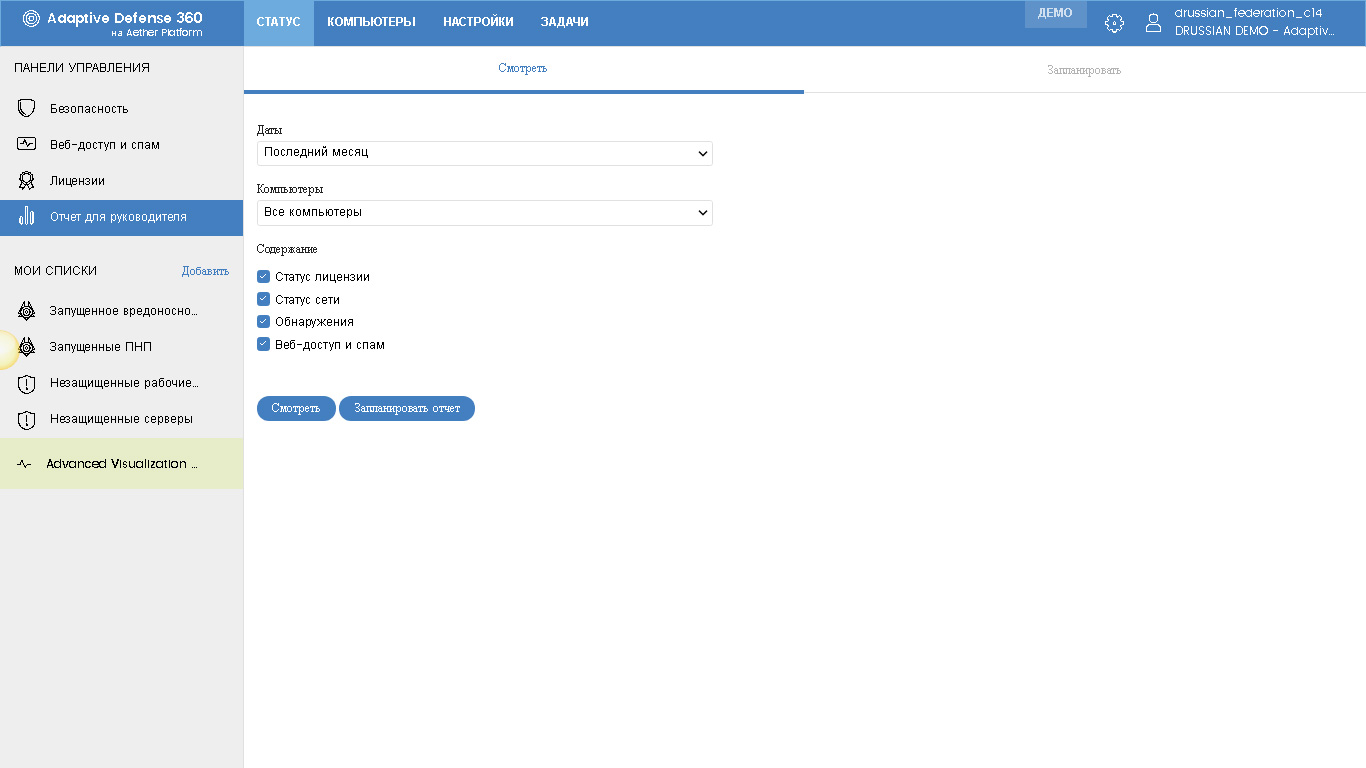
Here you can schedule automatic generation of the required report with the ability to send to certain email addresses with the necessary frequency and other parameters.
Computer Management
Filters
Frankly, in the new Aether console, the process of managing computers is much simpler and more visual, especially in combination with the possibility of simple and remote execution of a number of new tasks in real time. Honestly, this was badly lacking in the previous version of the management console.
Device management is carried out in the section Computers .
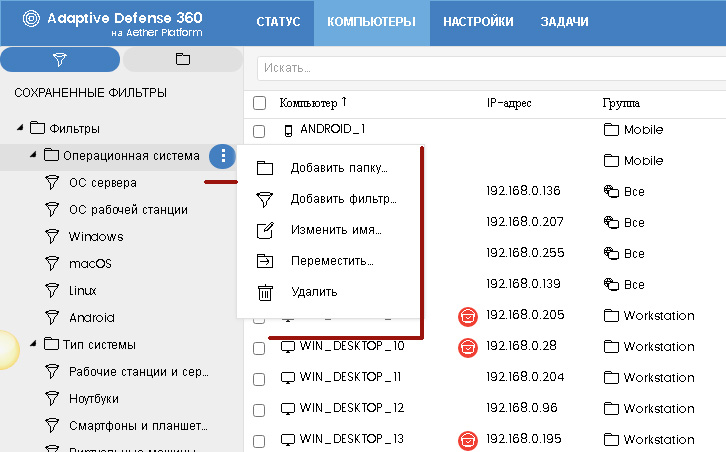
On the left side of the screen there is a selection block of the required computers either by filters or by organizational tree. In the previous version of the filters were not at all, but they were strongly lacking. Now you can use one of the pre-installed filters (for example, by operating system type, device type, hardware features or the presence of certain software), and you can easily and easily create your own filter. To do this, in the required folder in the list of saved filters where you want to add a new filter, click the button with three dots and select Add filter in the drop-down menu.
After that, in a new window, you can specify all the required selection criteria.
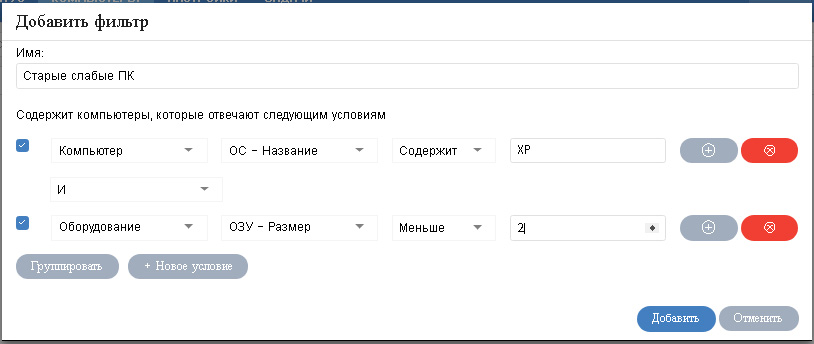
When setting the sampling conditions, you are asked to select a condition category (computer, license, modules, settings, equipment, software), its property (a huge amount depending on the category), operation (equal, not equal, contains, starts, etc.) and directly value of this condition. You can create several conditions, group some of them, selectively apply or not apply. This degree of detail allows you to customize almost any desired sample.
Each created filter can be easily transferred to another filter folder, copied, changed or deleted.
Tree of computers
Here, on the left side of the screen in the sample conditions block, you can switch from filters to an organizational tree. You can create folders in this tree yourself, or you can also integrate Active Directory folders.
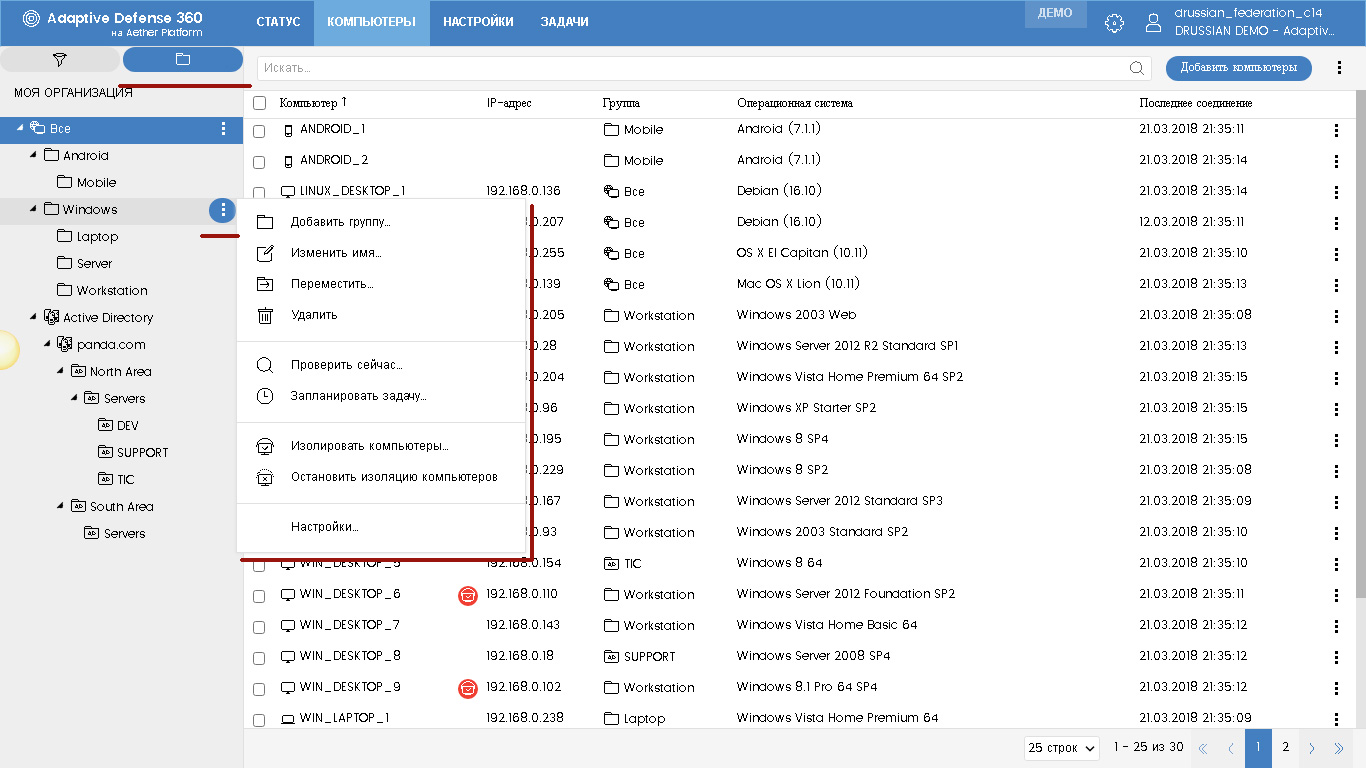
Again, in relation to any folder, you can quickly perform various actions:
• Add a group (folder) to it
• Rename, delete, move to another folder
• Change the settings of this folder.
And what is also very convenient is to perform various actions in relation to the computers in this folder:
• Run a scan
• Plan the execution of the required task.
• Isolate the computer from the network (or stop the isolation)
Such capabilities, for example, allow in critical situations in real time to simultaneously launch anti-virus scanning on all (or required) computers in a matter of seconds (even if there are tens of thousands of such computers).
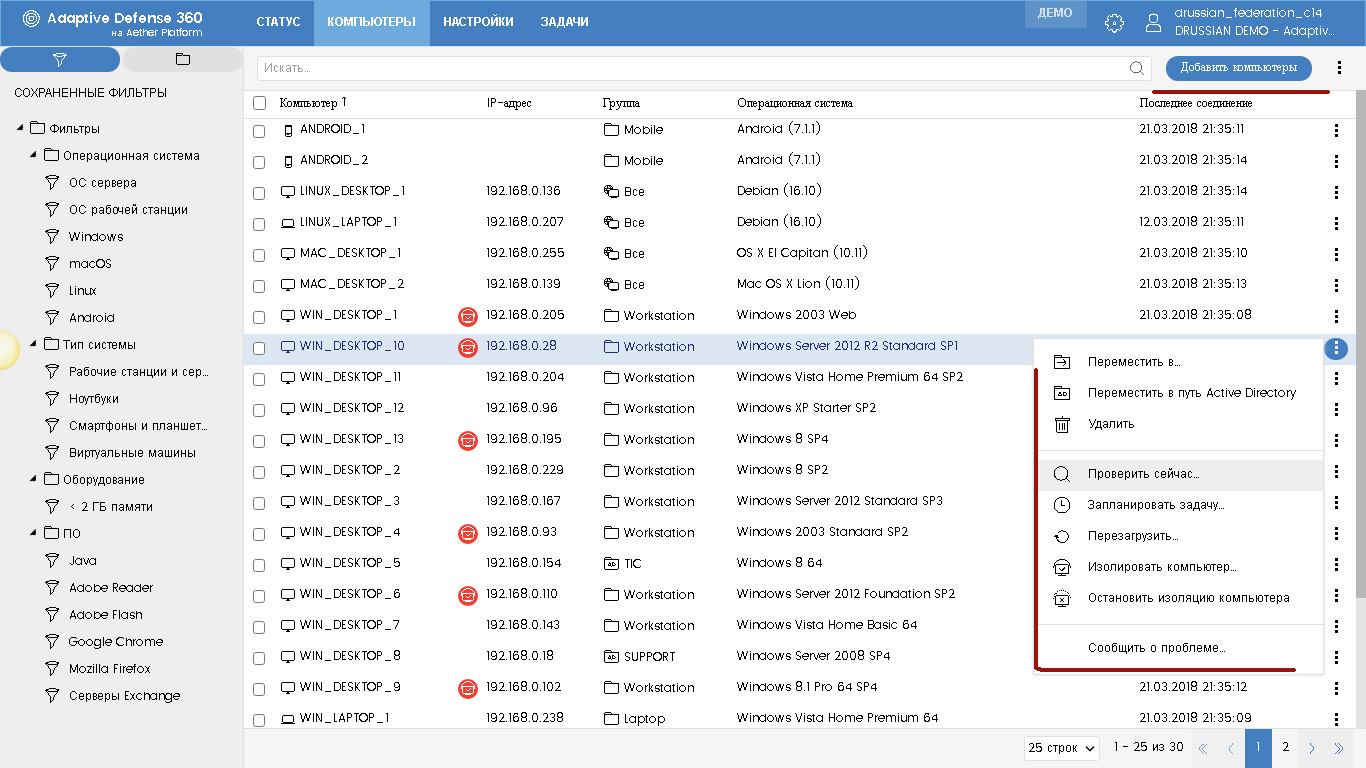
In the main part of the Computers section there is a block for searching computers with the possibility of adding computers (that is, installing protection on them), about which I will write separately in the article in the near future, and the option to export the results. Below is a table with a list of selected computers. In this table, the following data is visible for each device:
• Computer name
• IP address
• The group in which it is located
• Operating system (name and version)
• Last connected to cloud
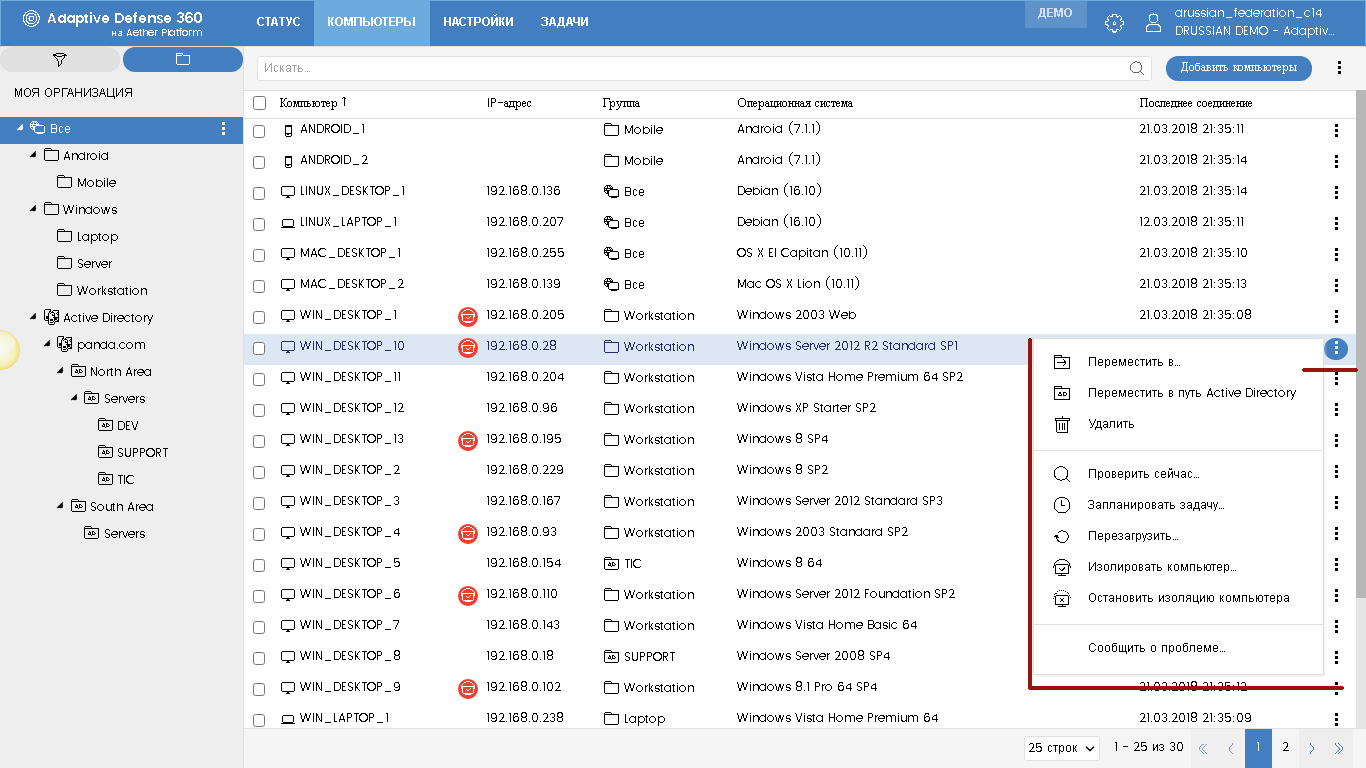
Each computer on the right has a button with three dots, which, when clicked, brings up the context menu. With it, you can already perform certain operations with respect to this device: move to another folder, delete, perform various tasks (start a scan, schedule a task, restart, isolate from the network, report a problem to Panda technical support, etc.) .
Computer details
When you click on the device goes to the page with a detailed description. And here, too, there are interesting changes compared to the previous version of the management console.

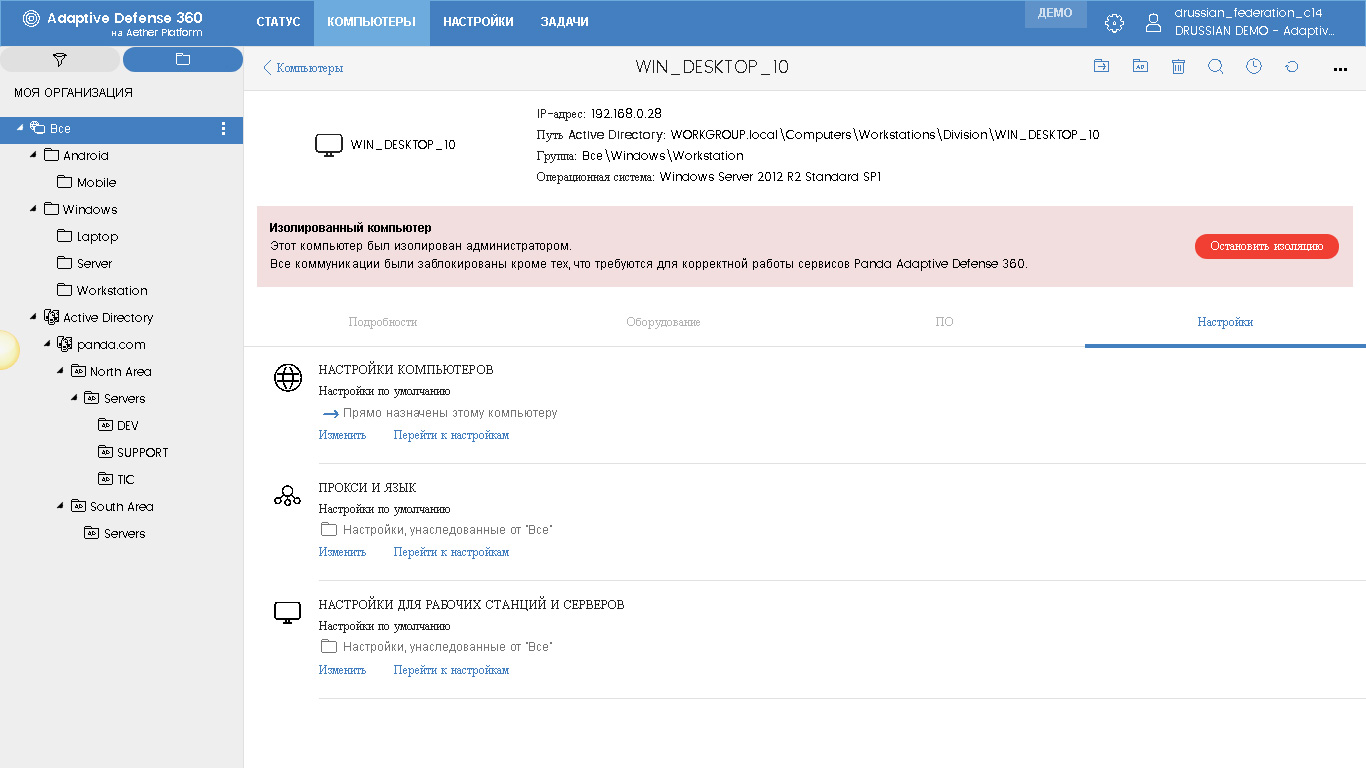
The upper part contains general information: computer name, its IP address, Active Directory folder, group, operating system and its version. Also in the upper right corner are icons for performing various actions in relation to the selected computer.
One of the innovations of the new management console is the ability to isolate the required devices from the network. In this case, an isolated computer can only exchange information with the Panda cloud, but for all other communications it is offline. In this case, such devices in the table of computers additionally show a red icon, and on the page with computer details a corresponding warning is displayed with the Stop Isolation button.
All information about the computer is divided into four tabs: Details, Hardware, Software, Settings . And here, too, not without pleasant changes.
On the Details tab, you can see all the basic information on a computer and its security status. By the way, a convenient option to release a license appeared here, as a result of which the computer changes to the status of unprotected computers, and a free license appears in the virtual warehouse, which can be transferred to another device.
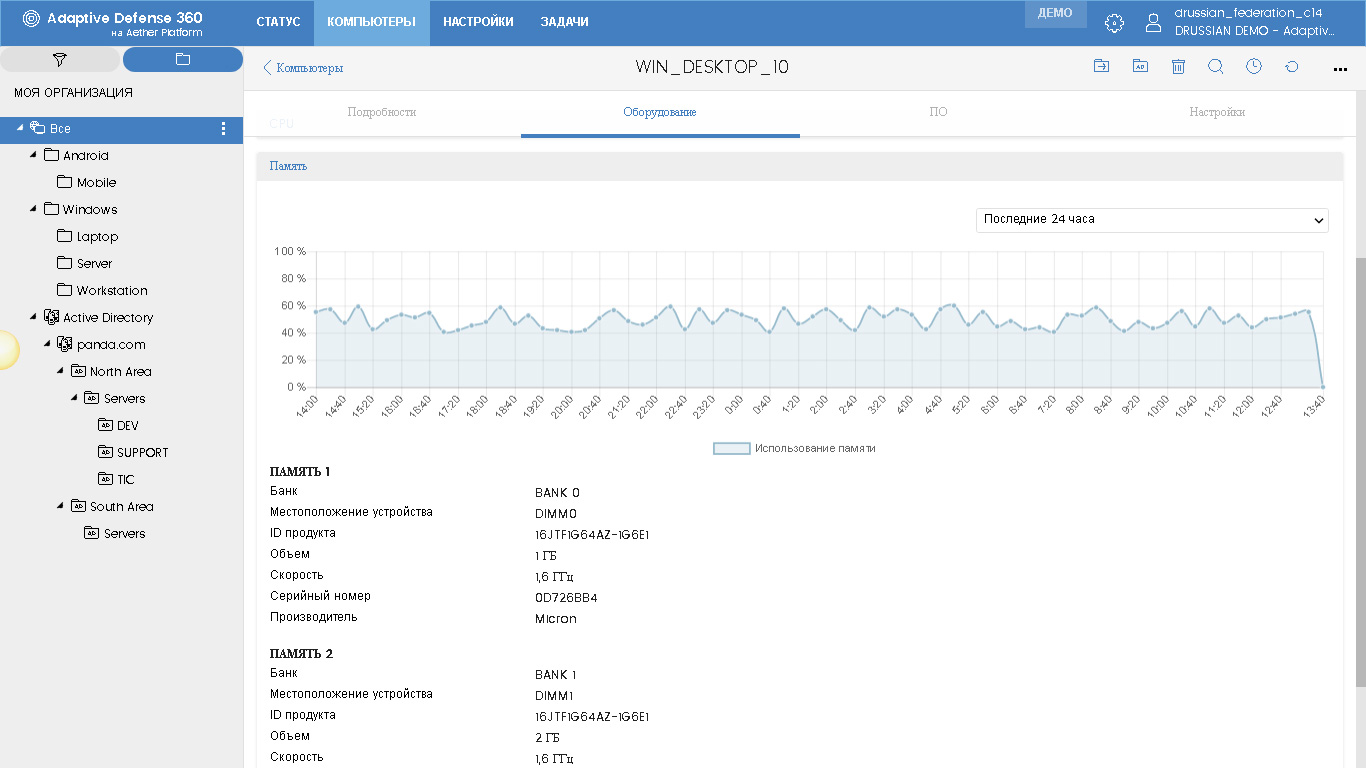
New Hardware tab now contains detailed information about the hardware of this computer: processors, memory and disk. By revealing the corresponding parameter, you can immediately see all the information on this “hardware”, as well as the percentage of its use. Here, for example, information on memory:
The new software tab displays information about installed programs and applications, as well as their updates / patches. The table immediately shows the name, manufacturer, installation date, size and version.
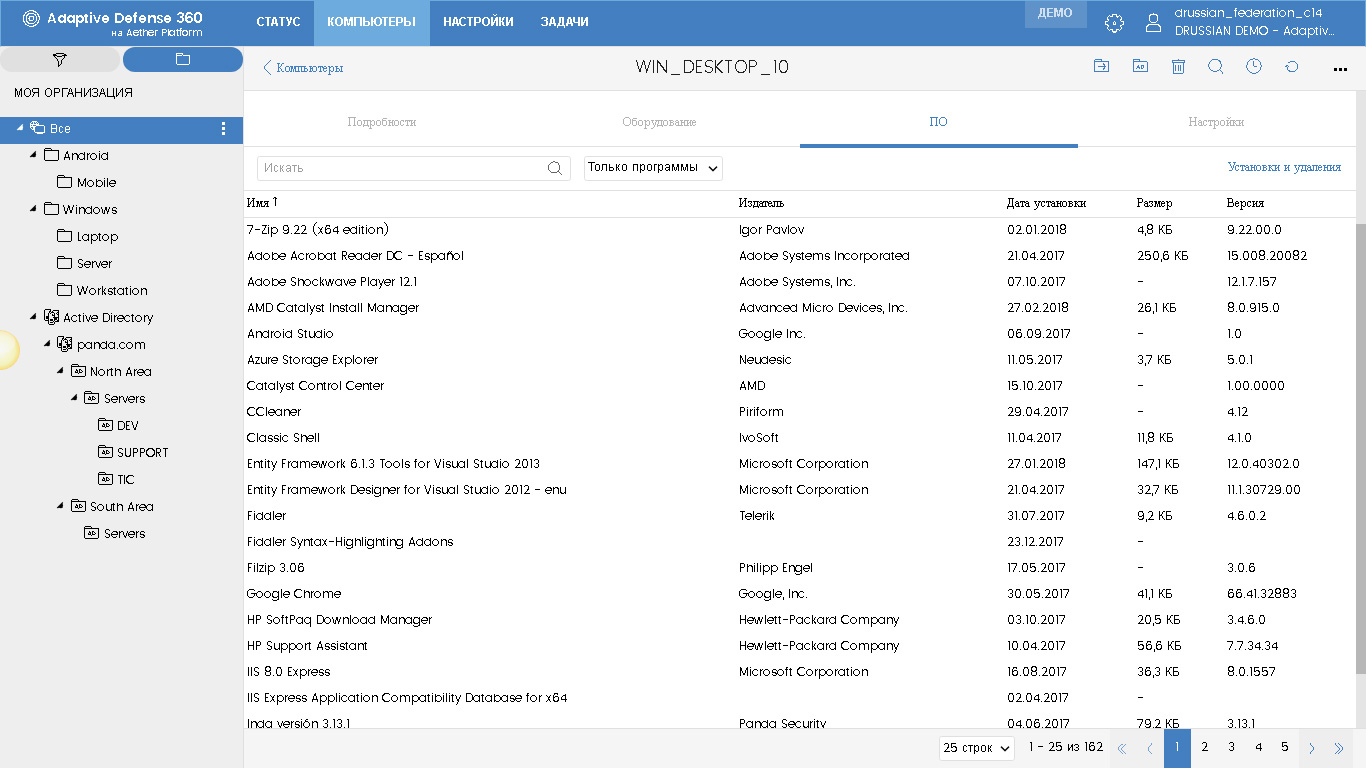
By the way, when you click on the Install and Uninstall link, you can get a detailed log of all installations and uninstalls of programs and their updates / patches in chronological order by date (by default).

The Settings tab shows all the settings that are applied to this computer: general settings for the computer, proxy and language settings, as well as the corresponding security settings. Right on this tab, you can make changes to the settings of a particular device or to the policies themselves. In more detail about the settings, I will say below.
As you can see, in general, computer management processes have become more flexible and simple. Thanks to new filters and task functionality, you can very quickly select the required devices and perform the required actions with respect to them, which significantly increases the speed and efficiency of responding to any incidents.
Settings
The distinctive feature of the settings in Aether compared with the previous version is that now the settings for the security, network, and computers are configured independently of each other. This allows you to customize the configuration more flexibly and in detail, and also greatly simplifies the process of setting up a fleet of computers in medium and large organizations, making this process more transparent.
Let's go to the Settings section.
Computer settings
Setting policies with the general settings of Panda Adaptive Defense 360 on computers is performed in the Computer settings subsection.
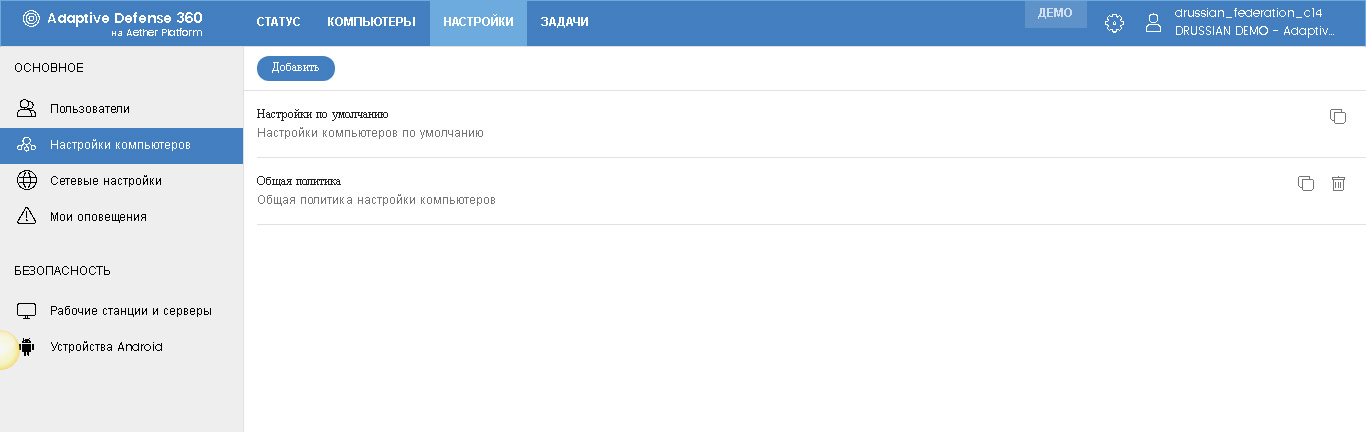
By default, there is always a default policy. This policy cannot be removed. But you always change it, as well as create your own policies, for which you must click the Add button.
The policy must have its name and, if necessary, a description of the policy (most likely, as a comment for oneself and other users of the console). Here you can choose the recipients of this policy by clicking on the appropriate link. And you can choose as specific groups of computers from the organization tree (including folders AD), and any individual device, regardless of their binding to a specific group.
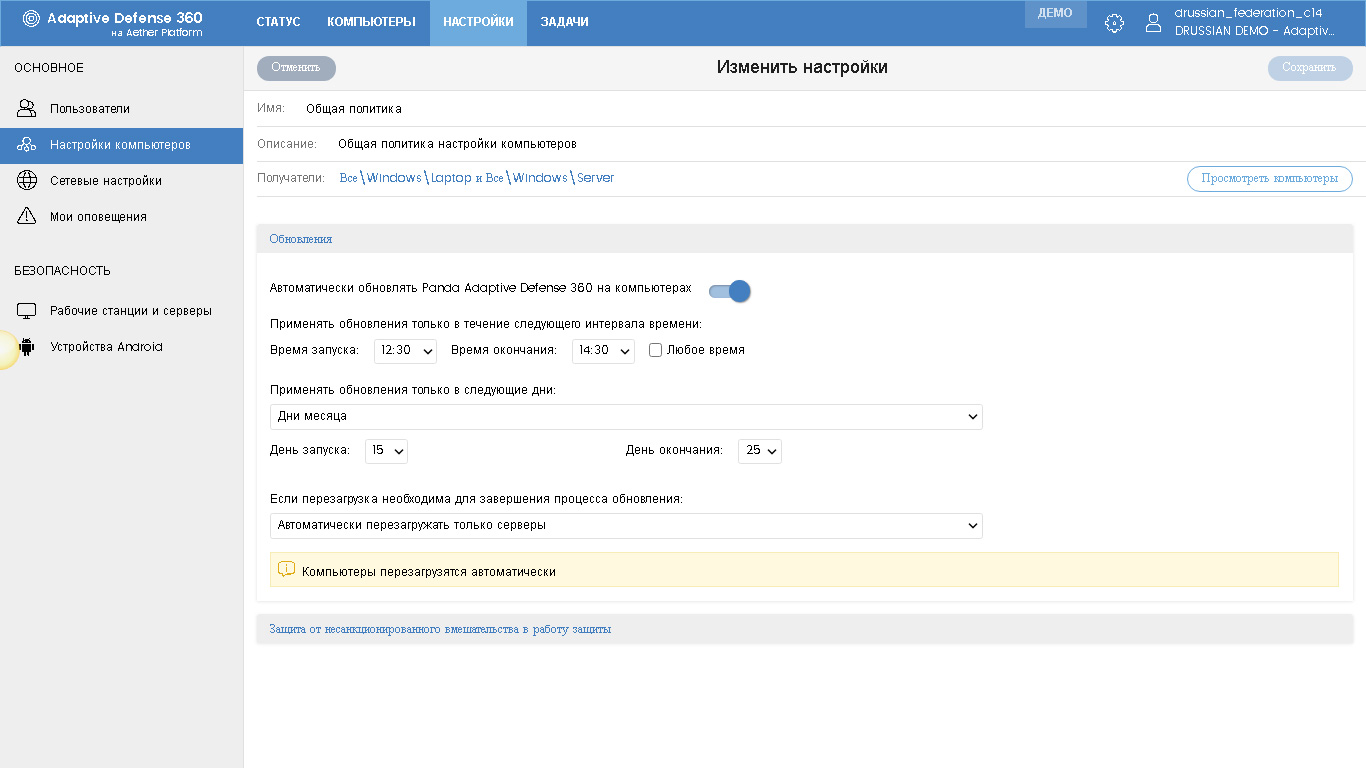
In the Updates section, you need to configure (change the default settings) parameters and update schedules for local agents. In the section Protection against unauthorized interference with the protection, you can configure the following options:
• Request password to remove protection from computer
• Ban or allow a user to manage security modules from a local agent console
• Anti-Tamper, which does not allow users or threats to stop protection
• Password to perform management tasks from the local agent console

Network settings
Network settings for Panda Adaptive Defense 360 and its local agents are made in the Network Settings section, which is divided into three tabs: Proxy and Language, Cache and Detection .
Proxy and language
There is also a default policy, but you can create your own.
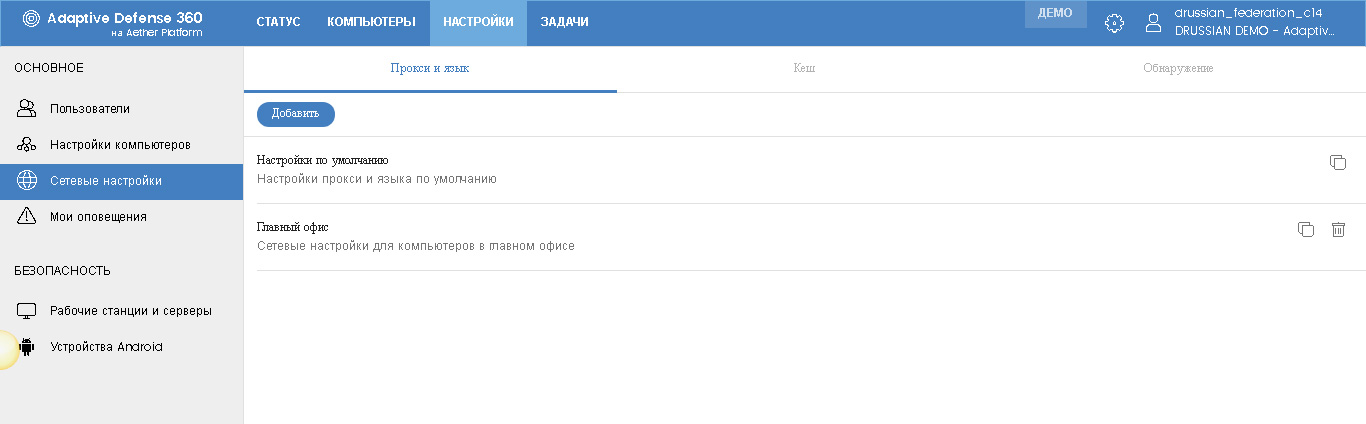
Here, everything is the same: for each policy, you need to configure the name, description (optional) and recipients, and the latter can be configured at any time (when adding a policy or at any other time, both in the Settings section and in the Computers section).
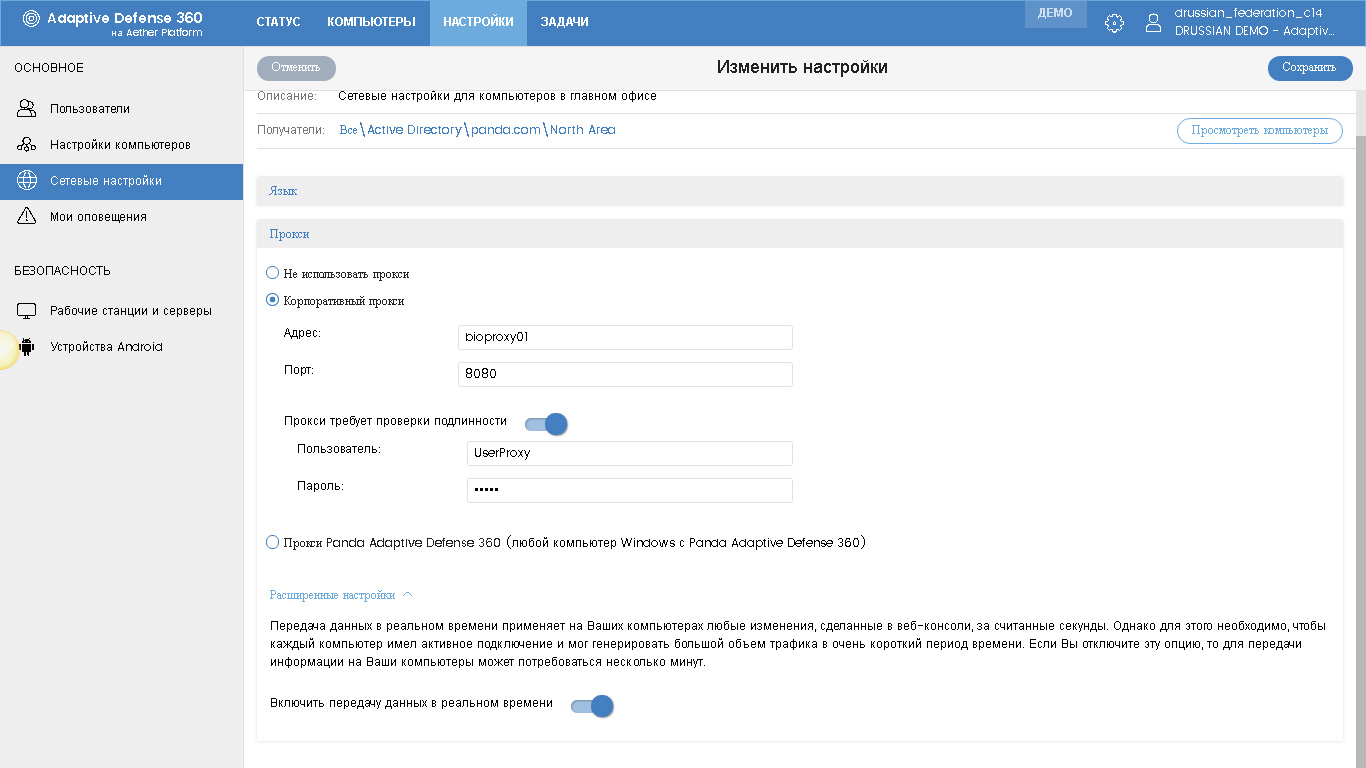
In the Language section, you must specify the protection language (local agents), and in the Proxy section, the standard corporate proxy settings or select any Windows computer as the proxy where Panda Adaptive Defense 360 is installed. In the latter case, this computer will act as a proxy.
Here in the advanced settings there is an option to enable real-time data transfer. Real-time data transfer applies any changes made to the web console on computers in seconds. However, this requires that each computer has an active connection and can generate a large amount of traffic in a very short period of time. If you disable this option, it may take several minutes to transfer information to your computers. In general, it is worth noting that the word “big” is a relative concept here, because in general the amount of generated traffic is completely imperceptible against the background of all network traffic.
On the Cache tab, you can select a computer that will be used to cache updates, installers, and any other packages downloaded from the Internet.
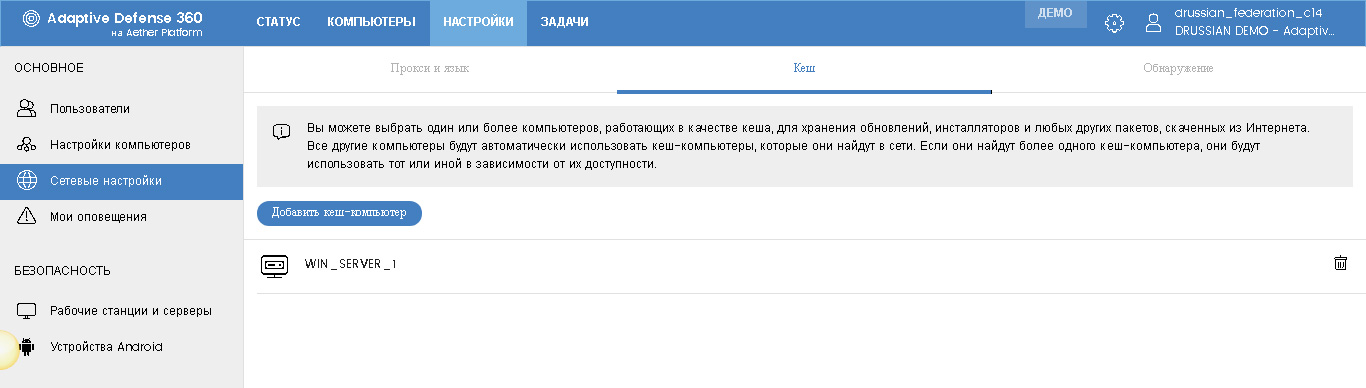
A small remark regarding local agent updates. By default for these purposes peering technologies are used. As soon as the first PC is updated, it begins to transmit information about its updated status to the corporate network. Other PCs receive this information, and if they are not updated, they are updated from the first PC. After that, they can also broadcast their status to the network, so that other PCs can upgrade from them, etc. Each PC updates ten others. All this happens automatically and instantly. But if necessary, you can configure specific cache computers from which other computers will be updated, thereby canceling the peer-to-peer principle.
The Discovery tab is used to configure the computers that will be used to search the network for new, unmanaged computers.

When setting up a computer for detection, you must specify the schedule for the automatic start of the detection function (time and frequency), as well as the detection area, i.e. the part of the network in which the search will be performed (in the entire network, in certain domains or ranges of IP addresses).

This approach is very convenient, because the entire network of a company can consist of several subnets / segments, and therefore each of them can be configured with its own computers for detection (one or several).
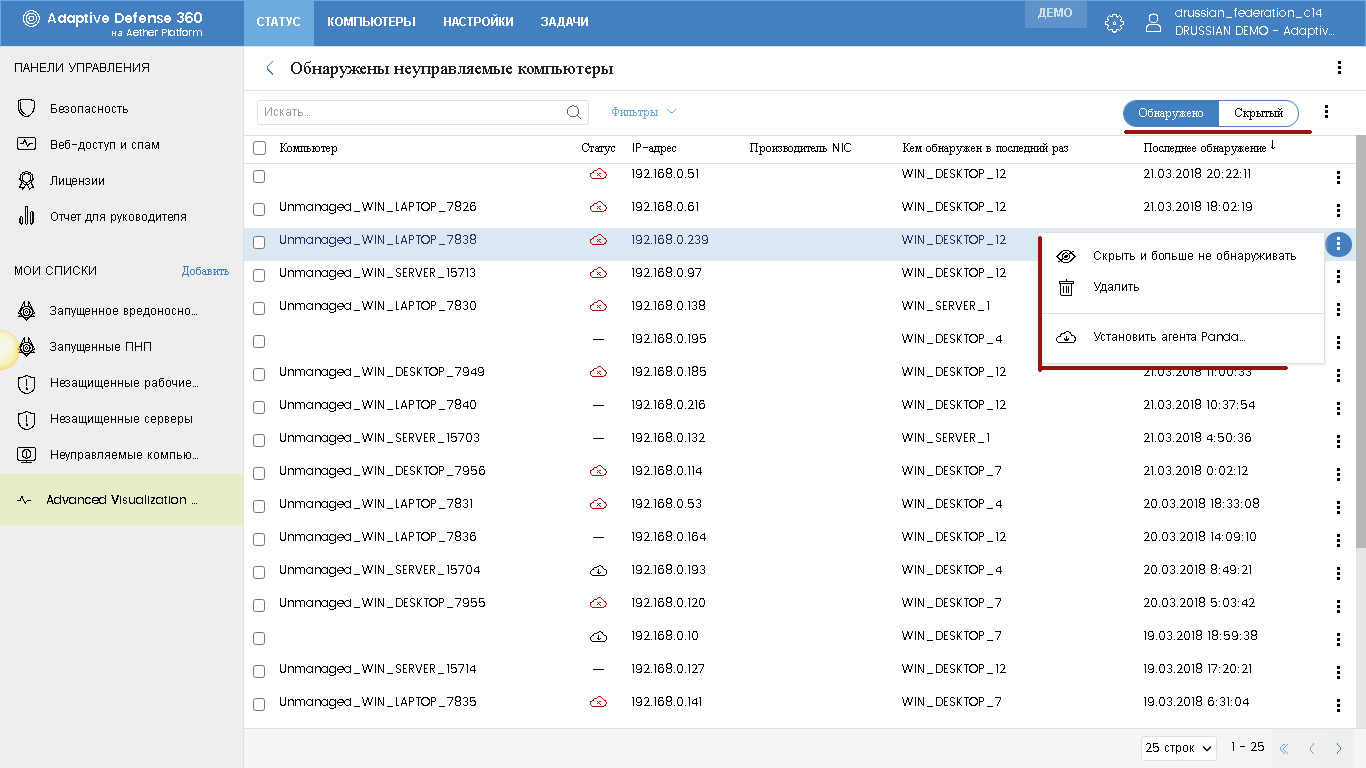
You can view the list of detected unmanaged computers in various ways: through the lists and the Protection Status widget in the Status section, when computers are added in the Computers section, when computers are configured for detection in the Settings section.
When viewing a table of detected computers for each of them, you can see the name of the computer, its status (not managed, installation error, installation process, etc.), IP address, manufacturer, which computer was last detected, date and time of the last detection . For each such computer (or selected group), you can perform the following tasks: start the task of remote installation of the Panda agent, transfer it to the list of hidden computers, and delete it from the database.
Email Alerts
In the My Alerts subsection, you can specify the conditions under which alerts will be sent, as well as email addresses to which they should be sent. For the time being, in the new version of the Aether console, alerts are sent in English or Spanish, although the Russian language will also be included in the future.
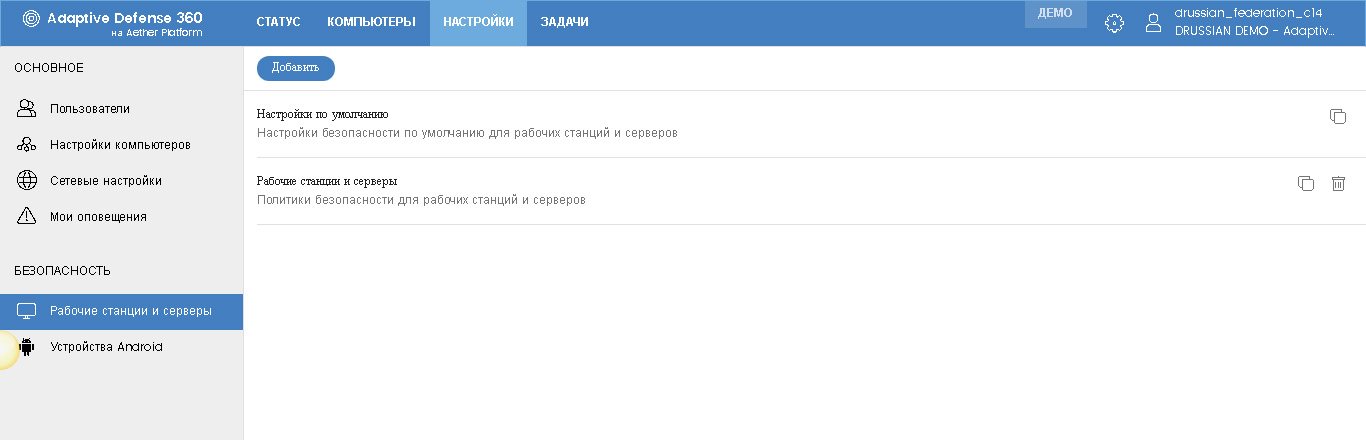
Security Settings
In the context menu of the Settings section, there is a Security section in which you can go to individual settings for workstations and servers (Windows, Mac, Linux) and Android devices. Here, everything is similar to other settings: there are default policies, you can create your own and assign them to the required devices separately or by groups.

In general, the security settings have remained unchanged compared with the previous version of the console, however, they have become a bit different design. Here I will not separately dwell on all the settings, because there are a lot of them. I will only note that by default, many parameters are configured quite optimally, although you have the freedom to choose and adjust. I would also “screw up” some options a little (firewall, extended protection, etc.).
User setup
In the previous version of the management console, it was also possible to configure several users who, with different rights, could have access to the centralized cloud management console. In Aether, these functions have become more flexible and detailed, in addition there was a log of user activity. Let's take it in order.
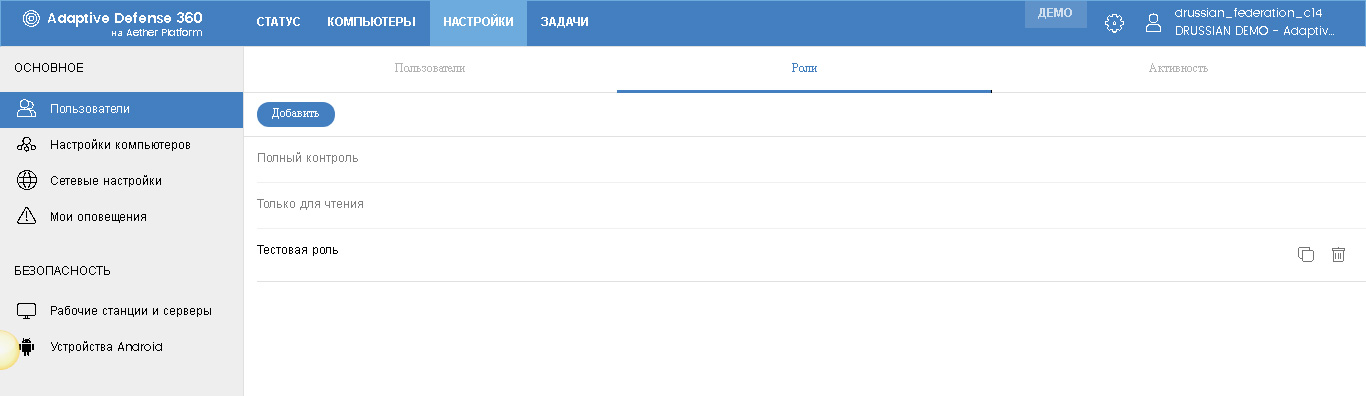
So, in the Settings section there is a subsection Users , which is responsible for setting up users of the console. This subsection is divided into three tabs: users, roles, and activity .
Roles
This time we start with the Roles tab, in which role templates are configured. Two roles are offered by default: Full control and Read-only (monitoring). These roles cannot be deleted or changed. But you can create your own roles by clicking the Add button.
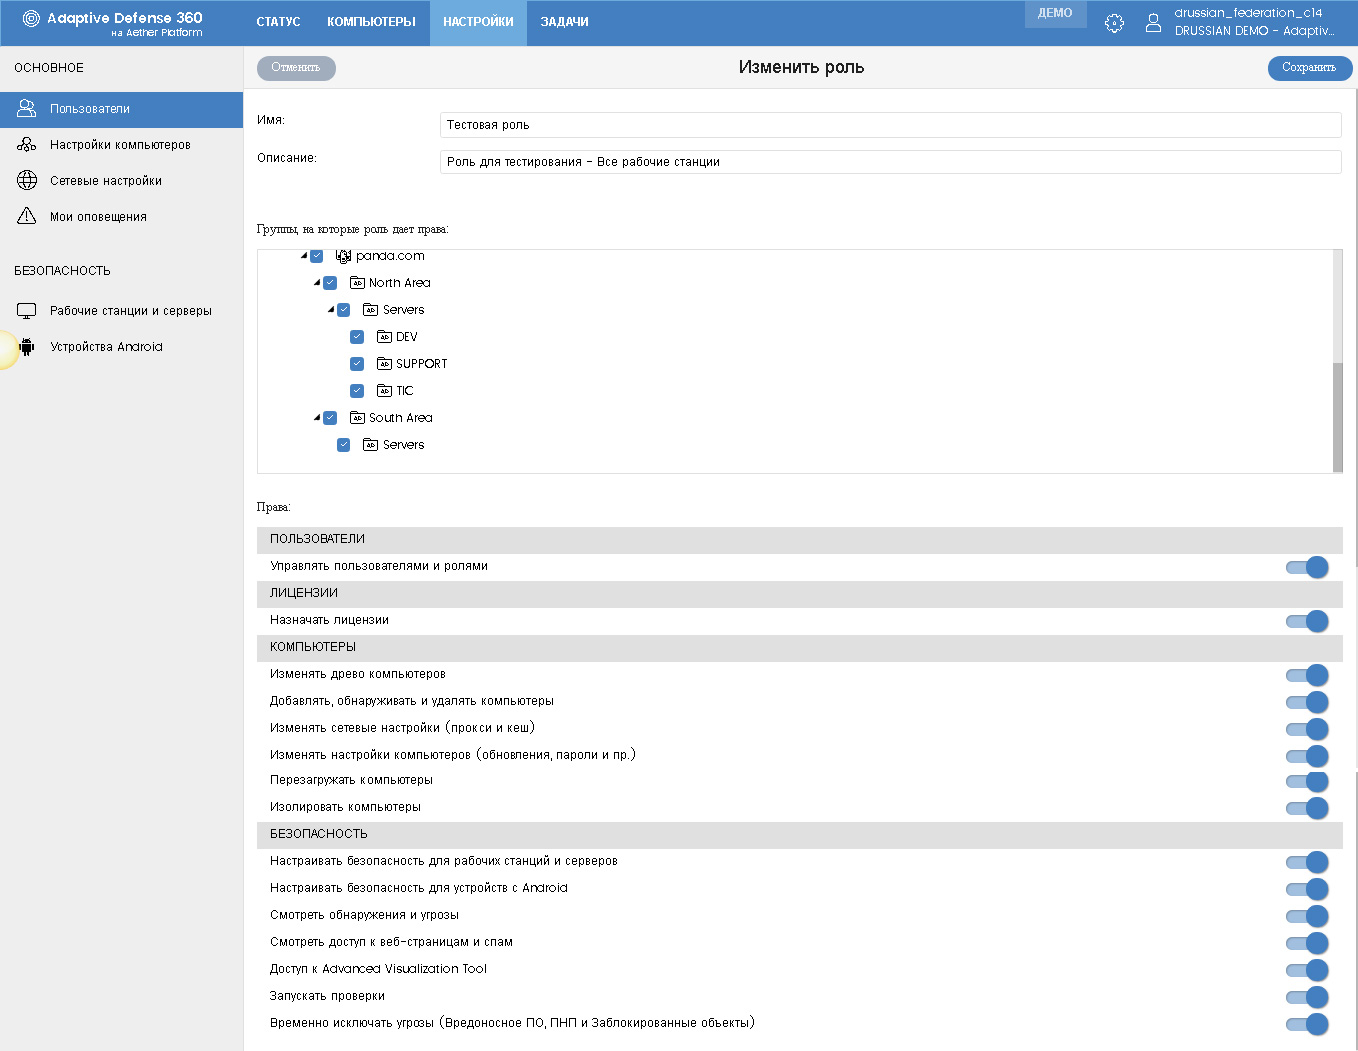
Unlike the previous version of the management console, in Aether you can configure each role in sufficient detail, equipping it with your own rights to manage users, licenses, computers and security.
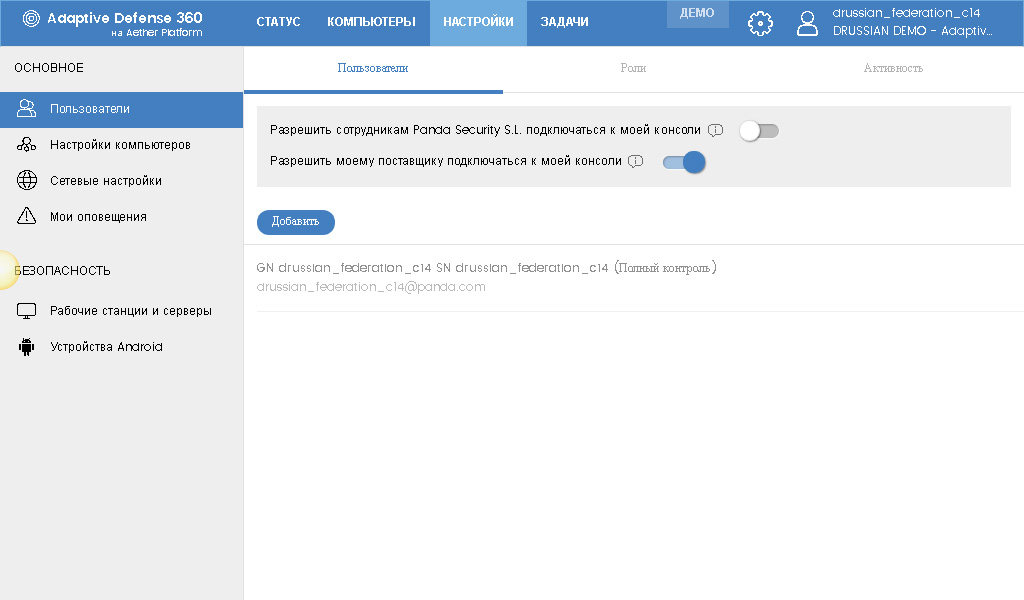
Users
The Users tab shows the list of users who have access to the management console. In this list, each user immediately shows his role. Additional access options are also shown here:
• The first option allows access to the console to Panda Security technical support staff. You can enable this option in case of solving a technical incident, when a technical support officer needs to connect to the console to check its operation, reproduce the incident, etc.
• The second option allows access to the console by your supplier - you can allow access if your supplier is a provider of managed security services (integrator, outsourcer) and services your company.
You can add a new user by clicking the Add button . When adding, you need to specify the email address of the new user in the Login email field , select its role from the list and, if necessary, add a comment in the Description field . As a result, an automatic email will be sent to the specified email address to activate your account in order to provide access to the management console.
Activity
On the Activity tabA log of user activity of the management console is presented, which was not in the previous version. For example, here you can view a list of all user actions with the possibility of sampling by dates and users. In this case, for each action you can see:
• the time and date of the action
• the user who performed this action
• the type of action
• the type of object
• the object itself in relation to which the action was performed

By clicking on the Session button, you can view a list of sessions for each from which the following information is presented: date and time, user, type of activity and user’s IP address.
Tasks
As I said earlier, Aether’s great advantage is that now most tasks can be performed remotely and in real time. You can create and run tasks directly in the management context in various sections of the management console. But there is also a separate Task section in which you can customize tasks and view the results of the execution of previously configured tasks.
Conclusion
As part of this article, a tour of the new version of the Aether Management Console has been made, its main functions are shown, emphasis has been placed on new options and other innovations. Of course, behind the scenes remained a number of features of the management console, which did not begin to speak here, but we will definitely tell in the next articles.
The main thing I wanted to say is that the new Aether console has truly become a more convenient management tool. The Aether platform provides even more control, flexibility and granularity to help administrators manage networks from hundreds or even thousands of computers. It contains very popular advanced features (detection of unprotected computers, filters, roles, tracking user activity, etc.) and additional information about end devices (hardware and software, applied patches, etc.), which helps companies save time and increase corporate security performance.
All these functions are available in a single web console with a single agent and in real time, allowing you to respond quickly to any critical security incident in a matter of seconds.
PS By the way, Aether is the “ether”, and according to ancient Greek mythology, it denotes the upper, cleaner and lighter layer of air that the gods breathed that controlled the life of people on Earth. Well, it is, by the way.
Source: https://habr.com/ru/post/351866/
All Articles