“Tolik - sweetheart”, or as we did a survey of IT-satisfaction for 20 thousand people
In general, is it normal for our employees to work with internal systems? In a small company, this is a simple question; all employees and their systems IT knows almost by heart. But our IT specialists have a hard time remembering 20 thousand people - namely, so much in VTB they use IT services in their work. We asked just one question, but that was enough to get a lot of information about our users. In this post we will share our experience in organizing a mass survey of satisfaction - we hope it will be useful to you.
Previously, we have not conducted a large-scale user satisfaction survey for a long time. Separate applications came, we analyzed them, gave feedback. Then the IT department evaluated the criticism and suggestions, looked where there are difficulties. All polls were point, with other goals. For example, we were interested in how individual units work. Or whether it is necessary to expand the communication channel.
In this case, everything was done anonymously, so that we could not identify data by user categories, for example, from certain regions. As a result, it turned out like in a famous song about a beautiful marquise: according to surveys everything is fine, but according to individual conversations - not very.
')
We needed a new approach. Here are the basic principles that we laid down in it:
Simply put, we wanted to learn something new about our shortcomings, and not to rest on our laurels, relying on a high percentage of satisfied employees.
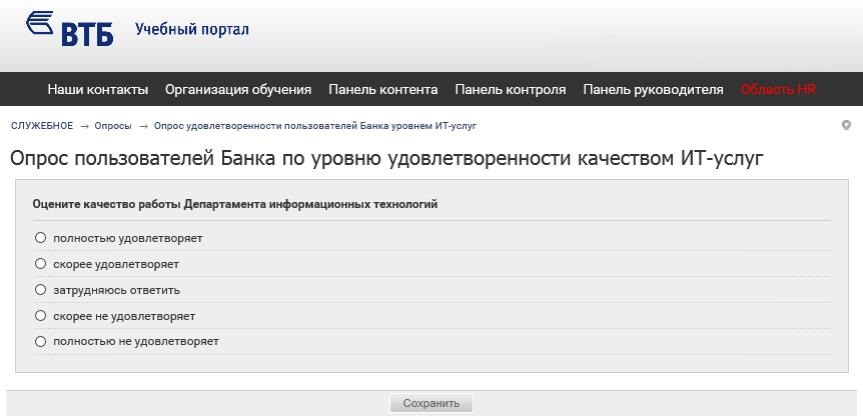
In order to involve as many people as possible, we tried to formulate the questions as clearly and concisely as possible. Many users do not even know what an IT-service is, they need a computer to work. “Is the“ accounting and reporting ”service good for you?” - “I don't know. Make 1C work. ” As a result, they agreed on one question with five answers - from "not fully satisfied" to "fully satisfied."
We explained about mandatory authentication above - without it, no cuts are made on the data, and their use drops dramatically.
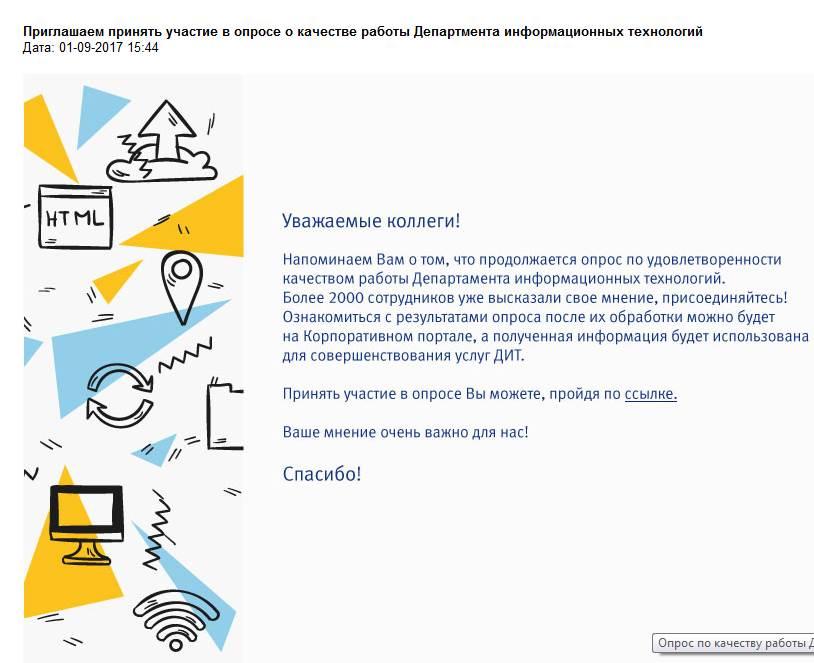
We attracted to the preparation of the survey our advertising service and HR-department. They helped to make an interesting survey design, so that people would like to click on the link with the mouse and choose the answer. All participants decided to send invitations by e-mail and post an ad on the corporate portal. So we were able to once again pay attention to the survey, but at the same time do not impose, so as not to provoke a negative reaction.
We had three weeks to prepare, and for information security reasons external services could not be used. So we designed a survey on WebTutor.
The survey lasted about two weeks - even employees who went on vacation could take part in it. We interviewed employees who had an account in Active Directory and an email address — that is, attributes of a “live” user — at the time of the survey. If there is an account in AD, but there is no mail - it could be some kind of technical account, we did not take that into account.
As a result, we achieved the simplest scheme of actions - the employee was required only two clicks. The first is via the link in one of the e-mail newsletters or news on the portal, the second is according to the chosen answer to a single question. For the most active, we added another comment field:
We did not emphasize once again that the survey would not be anonymous, but did not emphasize the opposite. Any literate person understands that there can be no anonymity when polling within the corporate network - if he uses it, then he is already authenticated. But what we focused on was the fact that we needed constructive criticism of our work. For what there is an optional, but important field with comments.
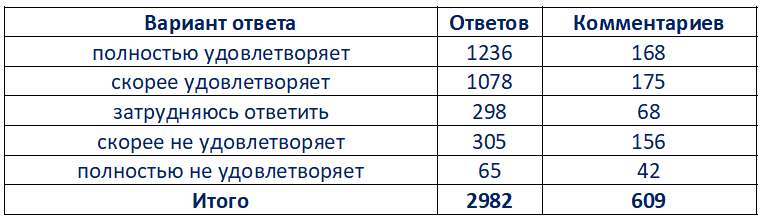
About 3 thousand people took part in our voluntary survey. Weighted average user satisfaction - 82.5 (out of a possible 100).
Despite the simplicity of the survey, we received a lot of data for analytics. By the way, it was necessary to analyze directly in the database, because no Excel could cope with the obtained volumes.
We added data from the IT personnel system to the survey results: we compared all the personnel information with a specific personnel number of the user. This is how the data for regions, positions, divisions and other HR-cuts came out.
After that, we added data from ITSM - 360,000 calls per year to the internal support service. So for indirect reasons, it was possible to understand why the user gave a specific assessment:
A lot of useful information we have received from the comments. It became clear which divisions had “sores”: some were dissatisfied with the software, others - with computers, and others - with something else. The comments were very diverse. Starting with “ Tolik - sweetheart ” (and from two different users) and ending with arguments about how we generally ask: “ Very wrong questions are asked: I cannot evaluate the whole range of emotions that answer me when you ask you to scold . "
It didn’t do without the negative “everything is bad, nothing works”, but there were a lot of detailed, constructive comments. We could immediately transfer them to the appropriate IT departments. Many wrote: “ I, perhaps, want to give feedback, but I do not give it, because I am not comfortable .” In response, we designed a new feedback form, with smileys instead of text response options. You poke a smiley, click "Send" and that's it. Just in case, we explain at the same time that “excellent” marks are when you are delighted. If your problems were simply solved normally, then this is a “good” grade. In December, we received 99.5% of “excellent” answers, and now 92% of such answers — people began to choose more deliberately.
What else did the survey? Increased stability and speed of one of the workflow systems. Made on the corporate portal a convenient and understandable page for the support department of the IT department. Improved a number of internal communication procedures with the internal service quality control service. And conducted additional surveys on a specific topic.
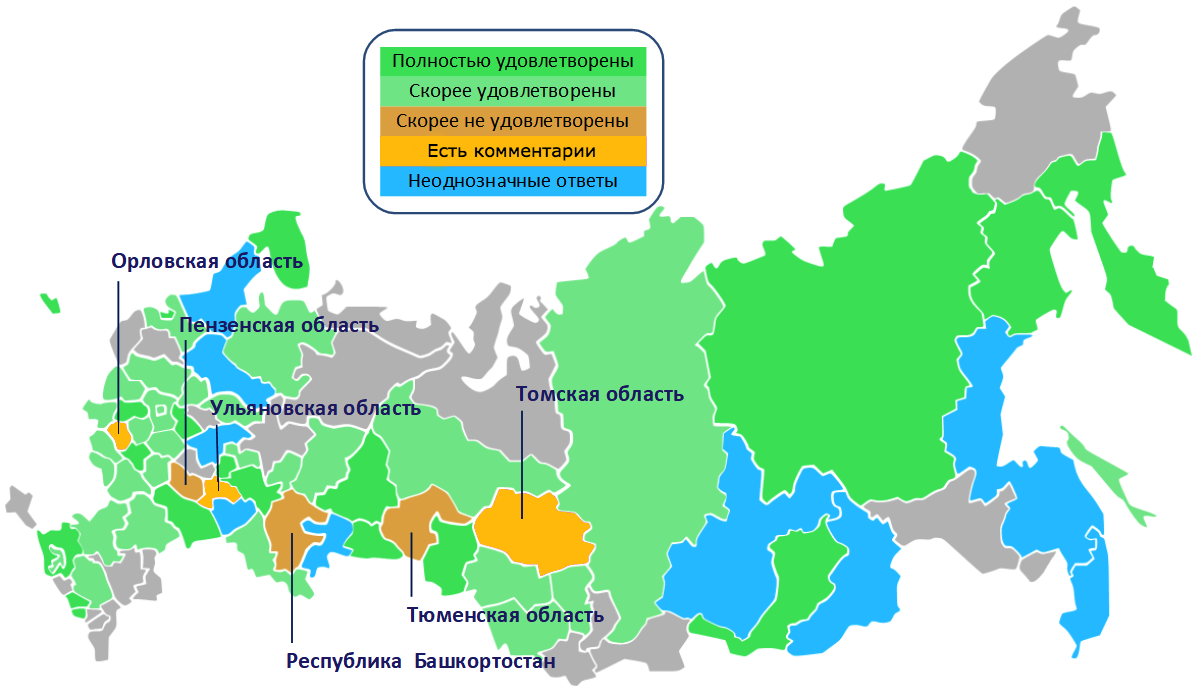
Many staff in the main survey complained about the printers and the procedure for changing cartridges. We conducted an additional point survey on the convenience of printing in the regions. Based on its results, an action plan has been prepared for certain cities. Here, by the way, the final map:
Following the survey, many more changes are planned. We want to make a page on the corporate portal with basic instructions for users. Like those that give out to newcomers in the company: where to contact on issues related to corporate communications, computer and software operation, to get passwords, using IT services and other usefulness. We also appreciate how we can increase the level of IT literacy of non-IT staff.
We are planning to conduct the next big survey in the near future. We want to repeat approximately the same thing, but we will increase the level of automation of processing results. Indeed, after the merger of VTB and VTB24, the audience for the survey will grow to about 50 thousand people.
Previously, we have not conducted a large-scale user satisfaction survey for a long time. Separate applications came, we analyzed them, gave feedback. Then the IT department evaluated the criticism and suggestions, looked where there are difficulties. All polls were point, with other goals. For example, we were interested in how individual units work. Or whether it is necessary to expand the communication channel.
In this case, everything was done anonymously, so that we could not identify data by user categories, for example, from certain regions. As a result, it turned out like in a famous song about a beautiful marquise: according to surveys everything is fine, but according to individual conversations - not very.
')
Concept
We needed a new approach. Here are the basic principles that we laid down in it:
- the survey should have the maximum coverage;
- the survey should require minimal effort from the participants, ideally one click;
- the survey must not be anonymous;
- The survey should be as general as possible, without suggestions of specific scenarios - this will allow to collect a lot of diverse information and conduct an in-depth analysis of the results.
Simply put, we wanted to learn something new about our shortcomings, and not to rest on our laurels, relying on a high percentage of satisfied employees.
In order to involve as many people as possible, we tried to formulate the questions as clearly and concisely as possible. Many users do not even know what an IT-service is, they need a computer to work. “Is the“ accounting and reporting ”service good for you?” - “I don't know. Make 1C work. ” As a result, they agreed on one question with five answers - from "not fully satisfied" to "fully satisfied."
We explained about mandatory authentication above - without it, no cuts are made on the data, and their use drops dramatically.
We attracted to the preparation of the survey our advertising service and HR-department. They helped to make an interesting survey design, so that people would like to click on the link with the mouse and choose the answer. All participants decided to send invitations by e-mail and post an ad on the corporate portal. So we were able to once again pay attention to the survey, but at the same time do not impose, so as not to provoke a negative reaction.
Conducting a survey
We had three weeks to prepare, and for information security reasons external services could not be used. So we designed a survey on WebTutor.
The survey lasted about two weeks - even employees who went on vacation could take part in it. We interviewed employees who had an account in Active Directory and an email address — that is, attributes of a “live” user — at the time of the survey. If there is an account in AD, but there is no mail - it could be some kind of technical account, we did not take that into account.
As a result, we achieved the simplest scheme of actions - the employee was required only two clicks. The first is via the link in one of the e-mail newsletters or news on the portal, the second is according to the chosen answer to a single question. For the most active, we added another comment field:
We did not emphasize once again that the survey would not be anonymous, but did not emphasize the opposite. Any literate person understands that there can be no anonymity when polling within the corporate network - if he uses it, then he is already authenticated. But what we focused on was the fact that we needed constructive criticism of our work. For what there is an optional, but important field with comments.
What we have learned and what we have done
About 3 thousand people took part in our voluntary survey. Weighted average user satisfaction - 82.5 (out of a possible 100).
Despite the simplicity of the survey, we received a lot of data for analytics. By the way, it was necessary to analyze directly in the database, because no Excel could cope with the obtained volumes.
We added data from the IT personnel system to the survey results: we compared all the personnel information with a specific personnel number of the user. This is how the data for regions, positions, divisions and other HR-cuts came out.
After that, we added data from ITSM - 360,000 calls per year to the internal support service. So for indirect reasons, it was possible to understand why the user gave a specific assessment:
- the user replies that he does not like what he uses. We see that over the past few months all his appeals for support have been processed in violation of the target deadline. The reason for discontent is clear;
- the employee puts the "top three" and says that he can not say good or bad. It seems to be all right, but very old computers. This is a reason to look at the history of interaction with technical support. Indeed, a person in a year has 10 applications in the spirit of “slows down the computer”, “does not turn on”, “the power supply unit has burned down”;
- there were also users who did not apply for support at all, but rated it “bad”. This is an even more interesting fact, and with the help of various information sections we tried to understand its causes.
A lot of useful information we have received from the comments. It became clear which divisions had “sores”: some were dissatisfied with the software, others - with computers, and others - with something else. The comments were very diverse. Starting with “ Tolik - sweetheart ” (and from two different users) and ending with arguments about how we generally ask: “ Very wrong questions are asked: I cannot evaluate the whole range of emotions that answer me when you ask you to scold . "
It didn’t do without the negative “everything is bad, nothing works”, but there were a lot of detailed, constructive comments. We could immediately transfer them to the appropriate IT departments. Many wrote: “ I, perhaps, want to give feedback, but I do not give it, because I am not comfortable .” In response, we designed a new feedback form, with smileys instead of text response options. You poke a smiley, click "Send" and that's it. Just in case, we explain at the same time that “excellent” marks are when you are delighted. If your problems were simply solved normally, then this is a “good” grade. In December, we received 99.5% of “excellent” answers, and now 92% of such answers — people began to choose more deliberately.
What else did the survey? Increased stability and speed of one of the workflow systems. Made on the corporate portal a convenient and understandable page for the support department of the IT department. Improved a number of internal communication procedures with the internal service quality control service. And conducted additional surveys on a specific topic.
Additional polls
Many staff in the main survey complained about the printers and the procedure for changing cartridges. We conducted an additional point survey on the convenience of printing in the regions. Based on its results, an action plan has been prepared for certain cities. Here, by the way, the final map:
Future plans
Following the survey, many more changes are planned. We want to make a page on the corporate portal with basic instructions for users. Like those that give out to newcomers in the company: where to contact on issues related to corporate communications, computer and software operation, to get passwords, using IT services and other usefulness. We also appreciate how we can increase the level of IT literacy of non-IT staff.
We are planning to conduct the next big survey in the near future. We want to repeat approximately the same thing, but we will increase the level of automation of processing results. Indeed, after the merger of VTB and VTB24, the audience for the survey will grow to about 50 thousand people.
Source: https://habr.com/ru/post/351832/
All Articles