Overview of the first day of Data Science Weekend 2018. Machine learning practice, a new approach to competition and much more
Hi, Habr! On March 2-3, at the Attic of our partners, the company Rambler & Co, the traditional Data Science Weekend took place , during which there were many speeches by experts in the field of work with data. In this article, we will tell you about the most interesting moments of the first day of our conference, when all attention was paid to the practice of using machine learning algorithms, team management and competitions in the field of Data Science.
Open Data Science Weekend 2018 was honored to be a graduate of our Big Data Specialist program Roman Smirnov from VectorX, which deals with information dissemination processes in the company and configuration of the information field. As part of the speech, Roman talked about why it is so difficult to work with the data scientist team and how to make their work as efficient as possible.
Based on my experience, there are 4 main problems that the company faces when working with a data scientist (we will call them experts):
')
Problem: unpredictable performance caused by high demand for expertise. The expert does not belong to you, but to society, since he is a scientist and uses his knowledge to make us all healthier and richer. It turns out that all they want him, but he does not care at all. From this and possible problems with motivation and labor efficiency.
Solution: first, there must always be an alternative in the form of another expert, whose existence must remain secret. Secondly, it is necessary to keep records of all projects, collect statistics in order to give the expert feedback and maintain in him a sense of personal value. Finally, it turned out that CRM is good not only in relation to clients, but also when working with distributed teams.
Problem: conflict of motivations. A data scientist is a person who tries to convince everyone that he is a pioneer, deals with the most important issues, tries to uncover the secret of the philosopher's stone. Unfortunately, basic physiological motives are not alien to him, and this conflict does not allow him to prioritize, and you - to conclude a favorable agreement with him.
Solution: this dualism can be used for their own purposes. If the expert says that he does not have enough money, you can call for his humanistic values and say: “Man, you're a scientist!”. And vice versa: it is worth reminding him that he is a man in status and that he should not walk that year in a suit with patches on his elbows.
Problem: reputation speculation. It often happens that an undoubtedly experienced theorist is not able to solve a trivial practical problem. Consequently, he cannot soberly assess the complexity of the project with all the consequences: failed deadlines, loss of motivation by the team, exorbitant expenses, etc.
Solution: request a portfolio from a potential project manager and feel free to spend money on code review to confirm or allay concerns.
Problem: ulterior motives. The expert, being a scientist, wants to be above society, and not in its ranks. Consequently, he always has the desire to popularize his opinion in the widest possible range of areas of knowledge, which, however, does not correlate well with the commercial benefits of the project: if the reputation of an expert in a company is in danger, then there is a risk of losing it.
Solution: today, science is very closely intertwined with the business: a couple of years ago, no one thought that marketing would apply to scientific articles. Co-sponsor the writing of scientific articles - for high-end projects this is an excellent marketing move.
And in case of a threat of loss of expertise, engage an expert from a competing laboratory. Such an act can offend the first scientist and stimulates him to take active steps to wipe the nose of a competitor.
Then it was the turn of another of our graduates, Alexander Ulyanov, who is Data science executive director at Sberbank. Using the example of a cash management project in an ATM network across the country, he explained why, instead of immediately attacking complex models and trying to build them, you must first sit down and carry out a thorough statistical analysis of the data. This is extremely important when working with real data, since they often have a large number of gaps, outliers, incorrect measurements and trivial errors of recording information, therefore each data scientist should, for example, be familiar with statistical methods for detecting anomalies or at least be able to look at the number zeros in dataset, maximum and minimum values of features. The principle of "garbage in - garbage out" has not been canceled.
You can read more about Alexander’s speech and the ATM network management case in the corporate blog of Sberbank in Habré soon. Wait!
Further, Artem Pichugin, Head of Data Education Programs in Newprolab, presented a new approach to holding machine learning competitions, which will be tested on the upcoming program “Big Data Specialist 8.0” . Start of the program on March 22.
It all started in 2009 with a competition from Netflix, in which the winner received $ 1 million, which gave popularity to such events, Kaggle appeared and all this began to develop rapidly. However, it turned out that from the very beginning everything went wrong: in 2012 it turned out that the decision of the winner of the competition from Netflix was simply impossible to implement in production, it was too complicated and difficult.
Several years have passed, and what do we see? It is 2018 in the yard, and people are still trying to make super-complex models building huge ensembles. And it is more and more like the sport of high achievements.
Of course, on the program, we also used this approach, ranking the students by a specific metric, regardless of the complexity of their solution. However, realizing how far all these decisions can be far from business, we apply a completely new approach to the competition on the program.
Now, the final rating will take into account only those decisions that are suitable for SLA, that is, they fit into some reasonable period of time. Moreover, unlike some other approaches, it will not take into account the total model training time, but how quickly the forecast is calculated for one element of the test sample.

Previously, when a person made a model in Jupyter Notebook, he made a forecast for a test sample, saved, sent and calculated the final metric. Now he needs to pack this model in Docker, that is, to make a small “apishka” by getting a JSON file. Thus, we will become closer to the production and encourage all those who organize competitions and hackathons to move in this direction.
By the way, in the next few months we will conduct our hackathon. Subscribe to us on Facebook and Telegram , so as not to miss the information!
Now let us tell about the group performance of machine learning specialists from Rambler & Co, who dismantled an interesting case study on the use of computer vision in cinema halls in recognizing the number, sex and age of cinema visitors.
We were assigned the task of evaluating the composition of the audience at sessions in the cinema network, in order to report to advertisers who need to understand the socio-demographic composition of the audience and who give us money for one or another advertisement that is shown to the sessions.
Let's start with the data sources . It would seem that we have a Rambler Cashier, so we have a lot of information about users, but according to this data, the estimate will actually be biased. For family viewing, the tickets are bought by the father or the mother, if this is a couple, then most likely the guy will buy them, and so on. Therefore, we were able to find another solution: in every hall there is a camera that sees everyone who sits in the cinema hall:
Looking ahead, we say that we managed to build a model that assesses by photographs who sits where, gender and age of visitors. We were able to determine the number of people with almost 100% accuracy, to distinguish men from women - from 90%, and to recognize children with a slightly lower probability. How did we do it?
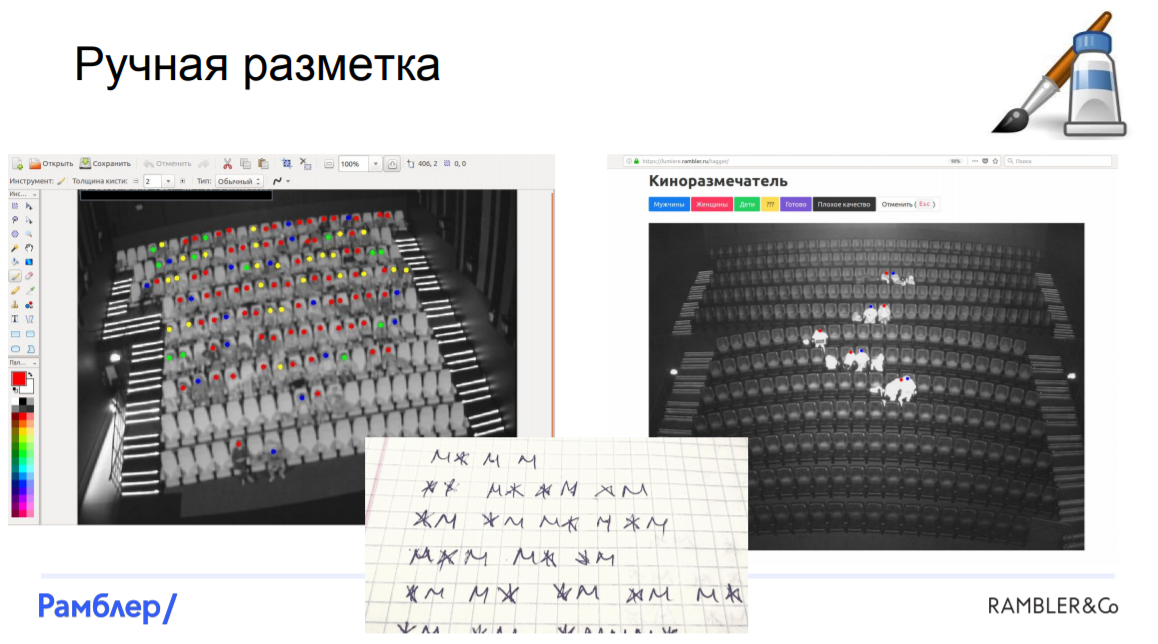
Markup data. From the very beginning we faced a bunch of problems. First of all, it is very difficult to find at least two similar cinema halls, they are all different, with different scale and perspective. There are cameras that capture not the entire hall, they shoot at an angle. Add to this a different illumination of the hall, depending on what is happening on the screen at the time of the shooting, and it turns out that we have data of different quality, which is automatically impossible to mark automatically.
We had to resort to hand marking. It was very expensive, hard, took most of the time, so we decided to hire a team of "elite markers" from the side - people who would normally and thoroughly mark up the data. Of course, it is impossible to exclude the human factor, there were a number of errors, but in the end we still managed to mark out all the photos and we were ready to build models.
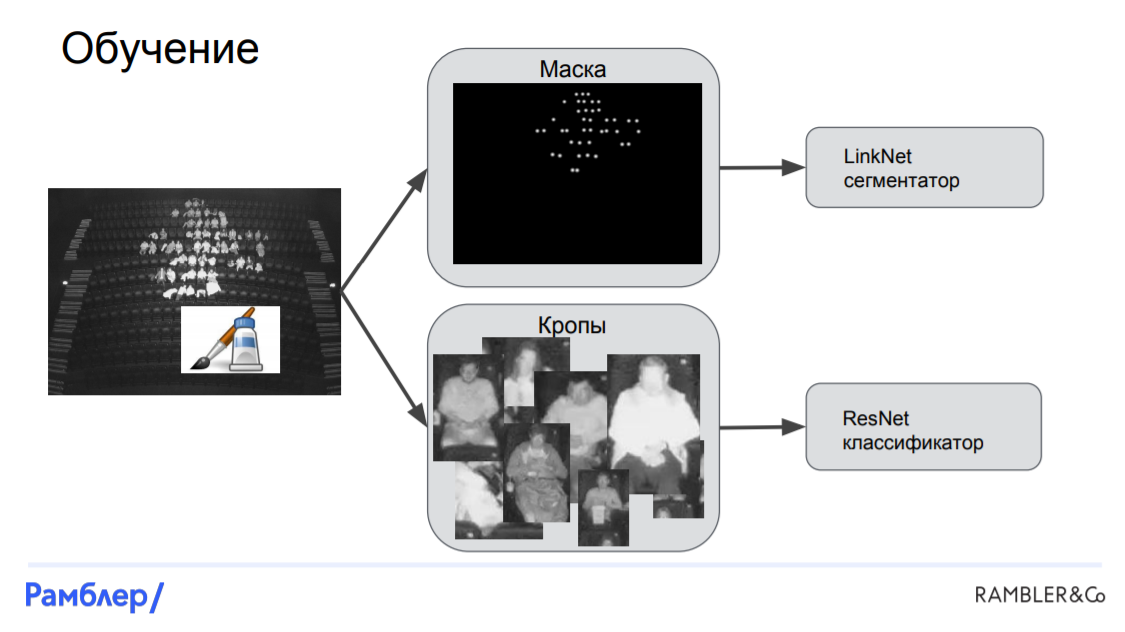
Model LinkNet-ResNet. This was our first model, and it showed quite high quality. It consisted of three main parts: a segmenter (LinkNet) , which finds the mask of the location of the heads in the picture, a localizer , which by mask finds the coordinates of the head and the bounding box for each person, and a classifier (ResNet) , which is based determines who is sitting on this picture: a man, a woman or a child.
Learning begins with a tagged picture. In this picture, we get a mask, imposing a white Gaussian stain on the head of each person. After that, we cut the picture onto the crop, using the bounding boxes around each head, and then submit all the results to our networks. The mask along with the source image is fed to the segmenter and is obtained by LinkNet, and the crop along with the target targets are fed to ResNet.
Predictions are made a little differently. We submit the original image to LinkNet, we get a mask. We submit it to the localizer, which finds the coordinates of the head and the bounding boxes. Then crops are cut out of them, which are fed into ResNet and the neural network outputs are obtained, on the basis of which we can get all the necessary analytics: the number of people in a session and the socio-demographic composition.
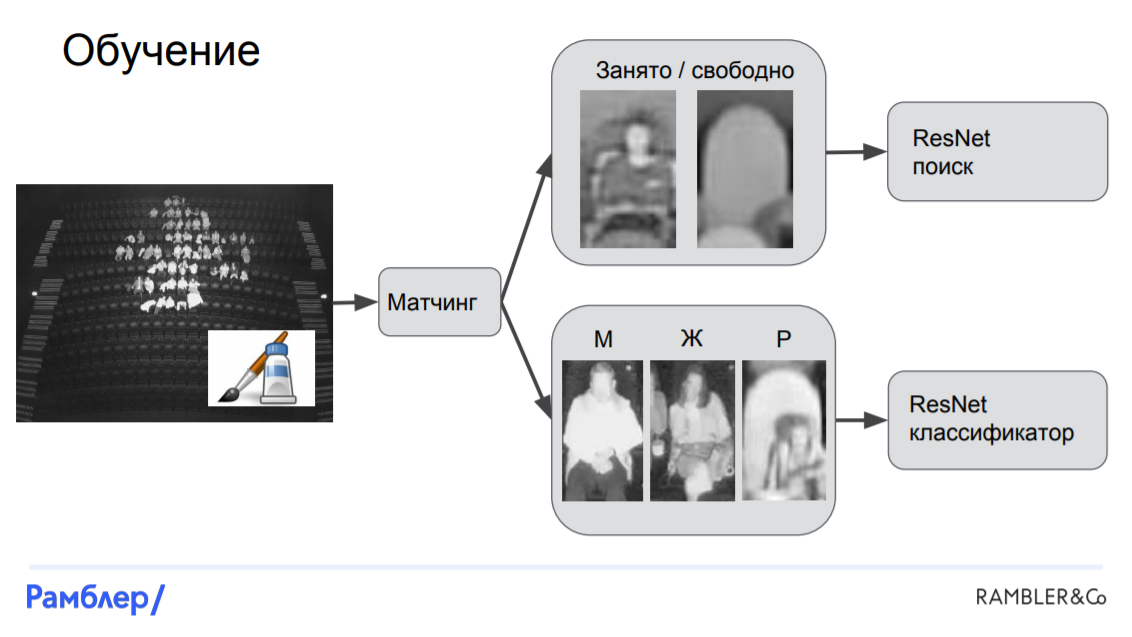
Model "Challenger". In the previous model, we didn’t use any prior knowledge that there are chairs in the halls that are nailed to the floor, and in the pictures they always appear in the same place. In addition, when people come to the gym, they tend to be in chairs. Given this information, we will build a model.
First, we need to teach the model to recognize where the chairs are in the picture, and here we must again resort to manual marking. Each seat in each room was labeled in the place where the head of the average person would be if he were sitting in the chair.
Let us turn to the model. First, we need to perform the matching: match the heads with the chairs, and then for each chair to determine whether it is occupied or free, and if it is occupied, by whom. After that, we can cut out sections of images corresponding to these chairs and train two models on them: one will recognize whether the chair is occupied, and the second to classify the audience into 3 categories. Both models are based on the ResNet neural network. Thus, the difference between the "Chancellor" and LinkNet-ResNet is that in it all the crops are fixed, they are tied to the arrangement of the chairs in the picture, whereas in the first model they were cut arbitrarily - where the head is, we cut it.
The next speaker on this busy day was Artem Prosvetov - Senior Data Scientist at CleverData, which deals with various data management solutions. His project was to optimize marketing communications for the beauty-industry, which he said.
To understand to whom, what and when to send, you need to have knowledge of what a person has a purchase history, what he needs now, at what moment to contact him and through what channel. Moreover, this information can be obtained not only from the purchase history itself, but also from the way a person behaves on the site, which links he clicks, which mailings he opens, and so on. The main question is: how to get features for this model from this sequence of actions?
The most obvious way is to encode these sequences of events as follows:
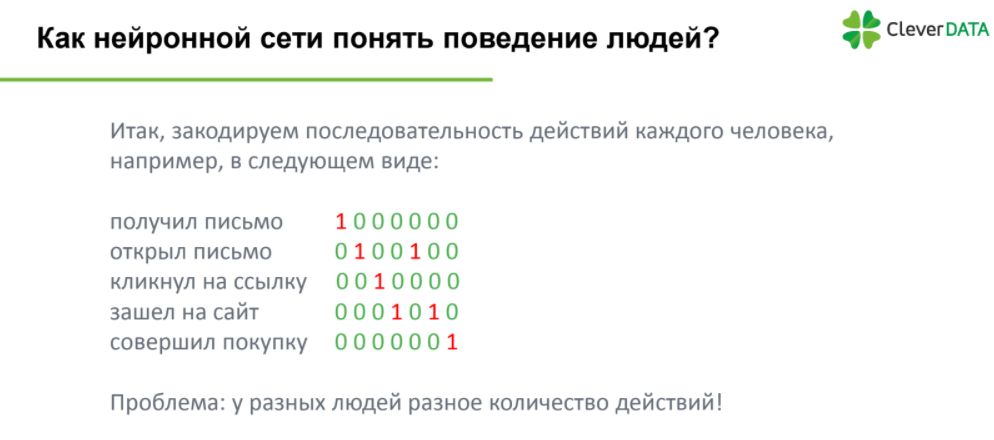
Everything is simple: the action is encoded by one, the omission of the action is zero. However, a problem arises: different people have a different number of actions. Therefore, the next logical step will be to set a vector of fixed length equal to the duration of human actions with the longest history.
It is also worth noting that this encoding does not take into account the time elapsed between adjacent actions, which can be very important. Consequently, as an additional vector, we add the time difference between the events, and, so that there are no values in tens of thousands of seconds, log this vector. By the way, then the distribution will be similar to lognormal.
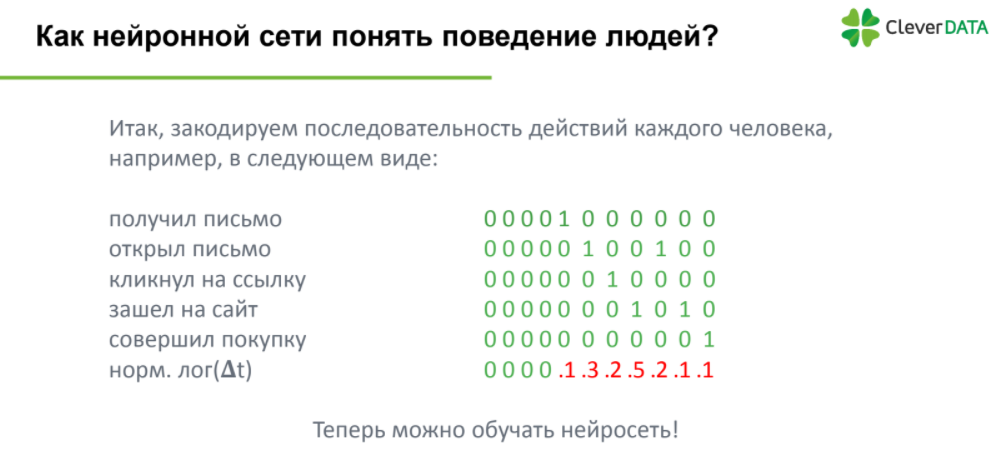
Finally, features are obtained and we are ready to train the model, namely, the neural network, which is the most popular method of processing a series of events. A model consisting of autoencoders and several layers of an LSTM network showed relatively high quality - the ROC-AUC metric turned out to be equal to 0.87.
Artem Trunov, one of our graduates and coordinator of the Big Data Specialist 8.0 program, finished the first day of the conference. Artem talked about how he managed to win the machine learning competition from the TrainMyData platform.
As part of the competition, it was necessary to predict the time series of the weekly sales of the Ascott Group. Of course, today the most popular method of time series prediction is neural networks, but this does not mean that classical econometric algorithms do not work. They helped me win this competition, so I would like to remind you about each of them:
Some reviews about the event:
“It was very useful and interesting to know how the claimed technologies are used in real projects.” - Andrey Tolmachev, ASSI LLC.
“Thank you for a good event: the correct working format, decent training, a good composition of practicing speakers and a lot of useful information.” - Maxim Sorokin, R & D team leader, Vulkan Scientific and Technical Center.
You can watch videos of all performances on our Facebook page .
Soon we will publish a review of the second day of Data Science Weekend 2018, when the emphasis was placed on Data Engineering, using various data engineer tools for the needs of data-platforms, ETL, search hints services and much more. Stay tuned!
VectorX
Open Data Science Weekend 2018 was honored to be a graduate of our Big Data Specialist program Roman Smirnov from VectorX, which deals with information dissemination processes in the company and configuration of the information field. As part of the speech, Roman talked about why it is so difficult to work with the data scientist team and how to make their work as efficient as possible.
Based on my experience, there are 4 main problems that the company faces when working with a data scientist (we will call them experts):
')
Problem: unpredictable performance caused by high demand for expertise. The expert does not belong to you, but to society, since he is a scientist and uses his knowledge to make us all healthier and richer. It turns out that all they want him, but he does not care at all. From this and possible problems with motivation and labor efficiency.
Solution: first, there must always be an alternative in the form of another expert, whose existence must remain secret. Secondly, it is necessary to keep records of all projects, collect statistics in order to give the expert feedback and maintain in him a sense of personal value. Finally, it turned out that CRM is good not only in relation to clients, but also when working with distributed teams.
Problem: conflict of motivations. A data scientist is a person who tries to convince everyone that he is a pioneer, deals with the most important issues, tries to uncover the secret of the philosopher's stone. Unfortunately, basic physiological motives are not alien to him, and this conflict does not allow him to prioritize, and you - to conclude a favorable agreement with him.
Solution: this dualism can be used for their own purposes. If the expert says that he does not have enough money, you can call for his humanistic values and say: “Man, you're a scientist!”. And vice versa: it is worth reminding him that he is a man in status and that he should not walk that year in a suit with patches on his elbows.
Problem: reputation speculation. It often happens that an undoubtedly experienced theorist is not able to solve a trivial practical problem. Consequently, he cannot soberly assess the complexity of the project with all the consequences: failed deadlines, loss of motivation by the team, exorbitant expenses, etc.
Solution: request a portfolio from a potential project manager and feel free to spend money on code review to confirm or allay concerns.
Problem: ulterior motives. The expert, being a scientist, wants to be above society, and not in its ranks. Consequently, he always has the desire to popularize his opinion in the widest possible range of areas of knowledge, which, however, does not correlate well with the commercial benefits of the project: if the reputation of an expert in a company is in danger, then there is a risk of losing it.
Solution: today, science is very closely intertwined with the business: a couple of years ago, no one thought that marketing would apply to scientific articles. Co-sponsor the writing of scientific articles - for high-end projects this is an excellent marketing move.
And in case of a threat of loss of expertise, engage an expert from a competing laboratory. Such an act can offend the first scientist and stimulates him to take active steps to wipe the nose of a competitor.
Sberbank
Then it was the turn of another of our graduates, Alexander Ulyanov, who is Data science executive director at Sberbank. Using the example of a cash management project in an ATM network across the country, he explained why, instead of immediately attacking complex models and trying to build them, you must first sit down and carry out a thorough statistical analysis of the data. This is extremely important when working with real data, since they often have a large number of gaps, outliers, incorrect measurements and trivial errors of recording information, therefore each data scientist should, for example, be familiar with statistical methods for detecting anomalies or at least be able to look at the number zeros in dataset, maximum and minimum values of features. The principle of "garbage in - garbage out" has not been canceled.
You can read more about Alexander’s speech and the ATM network management case in the corporate blog of Sberbank in Habré soon. Wait!
New Professions Lab
Further, Artem Pichugin, Head of Data Education Programs in Newprolab, presented a new approach to holding machine learning competitions, which will be tested on the upcoming program “Big Data Specialist 8.0” . Start of the program on March 22.
It all started in 2009 with a competition from Netflix, in which the winner received $ 1 million, which gave popularity to such events, Kaggle appeared and all this began to develop rapidly. However, it turned out that from the very beginning everything went wrong: in 2012 it turned out that the decision of the winner of the competition from Netflix was simply impossible to implement in production, it was too complicated and difficult.
Several years have passed, and what do we see? It is 2018 in the yard, and people are still trying to make super-complex models building huge ensembles. And it is more and more like the sport of high achievements.
Of course, on the program, we also used this approach, ranking the students by a specific metric, regardless of the complexity of their solution. However, realizing how far all these decisions can be far from business, we apply a completely new approach to the competition on the program.
Now, the final rating will take into account only those decisions that are suitable for SLA, that is, they fit into some reasonable period of time. Moreover, unlike some other approaches, it will not take into account the total model training time, but how quickly the forecast is calculated for one element of the test sample.
Previously, when a person made a model in Jupyter Notebook, he made a forecast for a test sample, saved, sent and calculated the final metric. Now he needs to pack this model in Docker, that is, to make a small “apishka” by getting a JSON file. Thus, we will become closer to the production and encourage all those who organize competitions and hackathons to move in this direction.
By the way, in the next few months we will conduct our hackathon. Subscribe to us on Facebook and Telegram , so as not to miss the information!
Rambler & Co
Now let us tell about the group performance of machine learning specialists from Rambler & Co, who dismantled an interesting case study on the use of computer vision in cinema halls in recognizing the number, sex and age of cinema visitors.
We were assigned the task of evaluating the composition of the audience at sessions in the cinema network, in order to report to advertisers who need to understand the socio-demographic composition of the audience and who give us money for one or another advertisement that is shown to the sessions.
Let's start with the data sources . It would seem that we have a Rambler Cashier, so we have a lot of information about users, but according to this data, the estimate will actually be biased. For family viewing, the tickets are bought by the father or the mother, if this is a couple, then most likely the guy will buy them, and so on. Therefore, we were able to find another solution: in every hall there is a camera that sees everyone who sits in the cinema hall:
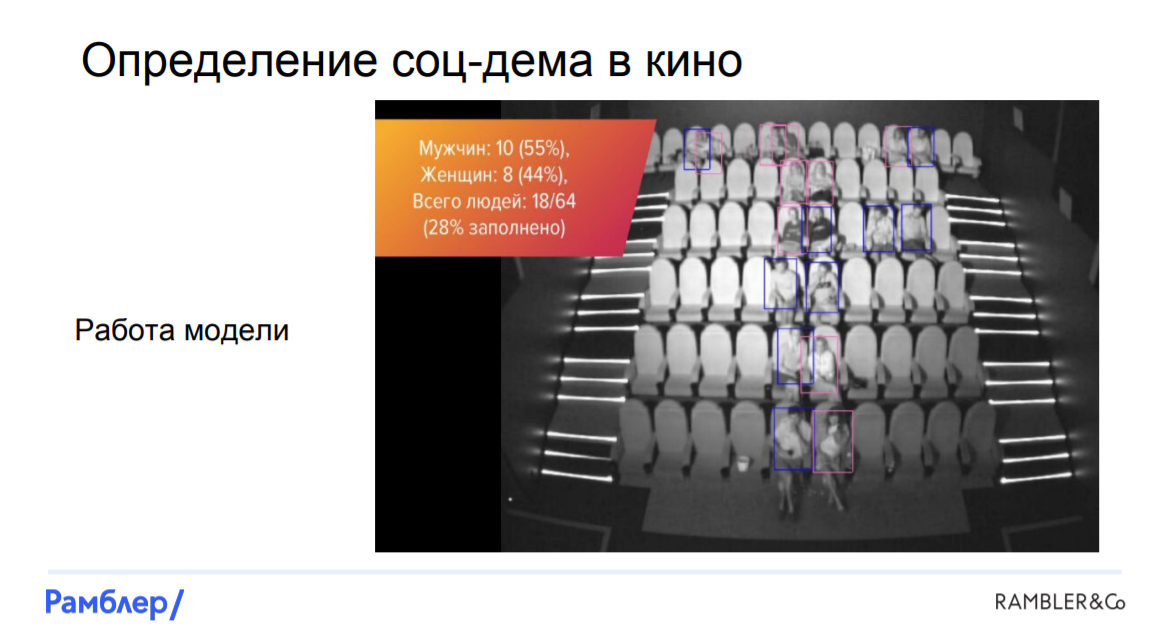
Looking ahead, we say that we managed to build a model that assesses by photographs who sits where, gender and age of visitors. We were able to determine the number of people with almost 100% accuracy, to distinguish men from women - from 90%, and to recognize children with a slightly lower probability. How did we do it?
Markup data. From the very beginning we faced a bunch of problems. First of all, it is very difficult to find at least two similar cinema halls, they are all different, with different scale and perspective. There are cameras that capture not the entire hall, they shoot at an angle. Add to this a different illumination of the hall, depending on what is happening on the screen at the time of the shooting, and it turns out that we have data of different quality, which is automatically impossible to mark automatically.
We had to resort to hand marking. It was very expensive, hard, took most of the time, so we decided to hire a team of "elite markers" from the side - people who would normally and thoroughly mark up the data. Of course, it is impossible to exclude the human factor, there were a number of errors, but in the end we still managed to mark out all the photos and we were ready to build models.
Model LinkNet-ResNet. This was our first model, and it showed quite high quality. It consisted of three main parts: a segmenter (LinkNet) , which finds the mask of the location of the heads in the picture, a localizer , which by mask finds the coordinates of the head and the bounding box for each person, and a classifier (ResNet) , which is based determines who is sitting on this picture: a man, a woman or a child.
Learning begins with a tagged picture. In this picture, we get a mask, imposing a white Gaussian stain on the head of each person. After that, we cut the picture onto the crop, using the bounding boxes around each head, and then submit all the results to our networks. The mask along with the source image is fed to the segmenter and is obtained by LinkNet, and the crop along with the target targets are fed to ResNet.
Predictions are made a little differently. We submit the original image to LinkNet, we get a mask. We submit it to the localizer, which finds the coordinates of the head and the bounding boxes. Then crops are cut out of them, which are fed into ResNet and the neural network outputs are obtained, on the basis of which we can get all the necessary analytics: the number of people in a session and the socio-demographic composition.
Model "Challenger". In the previous model, we didn’t use any prior knowledge that there are chairs in the halls that are nailed to the floor, and in the pictures they always appear in the same place. In addition, when people come to the gym, they tend to be in chairs. Given this information, we will build a model.
First, we need to teach the model to recognize where the chairs are in the picture, and here we must again resort to manual marking. Each seat in each room was labeled in the place where the head of the average person would be if he were sitting in the chair.
Let us turn to the model. First, we need to perform the matching: match the heads with the chairs, and then for each chair to determine whether it is occupied or free, and if it is occupied, by whom. After that, we can cut out sections of images corresponding to these chairs and train two models on them: one will recognize whether the chair is occupied, and the second to classify the audience into 3 categories. Both models are based on the ResNet neural network. Thus, the difference between the "Chancellor" and LinkNet-ResNet is that in it all the crops are fixed, they are tied to the arrangement of the chairs in the picture, whereas in the first model they were cut arbitrarily - where the head is, we cut it.
Cleverdata
The next speaker on this busy day was Artem Prosvetov - Senior Data Scientist at CleverData, which deals with various data management solutions. His project was to optimize marketing communications for the beauty-industry, which he said.
To understand to whom, what and when to send, you need to have knowledge of what a person has a purchase history, what he needs now, at what moment to contact him and through what channel. Moreover, this information can be obtained not only from the purchase history itself, but also from the way a person behaves on the site, which links he clicks, which mailings he opens, and so on. The main question is: how to get features for this model from this sequence of actions?
The most obvious way is to encode these sequences of events as follows:
Everything is simple: the action is encoded by one, the omission of the action is zero. However, a problem arises: different people have a different number of actions. Therefore, the next logical step will be to set a vector of fixed length equal to the duration of human actions with the longest history.
It is also worth noting that this encoding does not take into account the time elapsed between adjacent actions, which can be very important. Consequently, as an additional vector, we add the time difference between the events, and, so that there are no values in tens of thousands of seconds, log this vector. By the way, then the distribution will be similar to lognormal.
Finally, features are obtained and we are ready to train the model, namely, the neural network, which is the most popular method of processing a series of events. A model consisting of autoencoders and several layers of an LSTM network showed relatively high quality - the ROC-AUC metric turned out to be equal to 0.87.
TrainMyData
Artem Trunov, one of our graduates and coordinator of the Big Data Specialist 8.0 program, finished the first day of the conference. Artem talked about how he managed to win the machine learning competition from the TrainMyData platform.
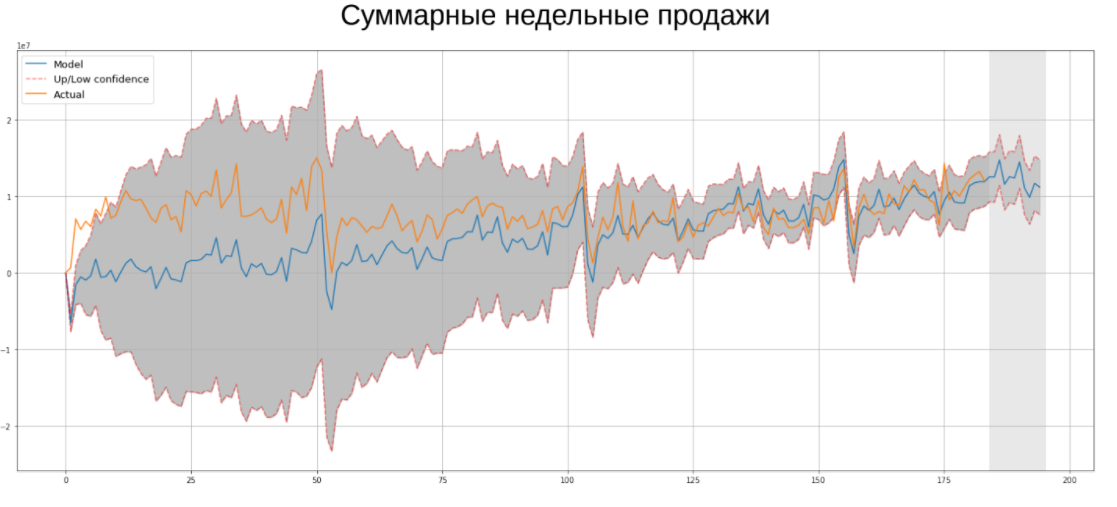
As part of the competition, it was necessary to predict the time series of the weekly sales of the Ascott Group. Of course, today the most popular method of time series prediction is neural networks, but this does not mean that classical econometric algorithms do not work. They helped me win this competition, so I would like to remind you about each of them:
- Exponential smoothing. It is one of the simplest methods for predicting time series, it has a short memory, because more weight is assigned to later observations.
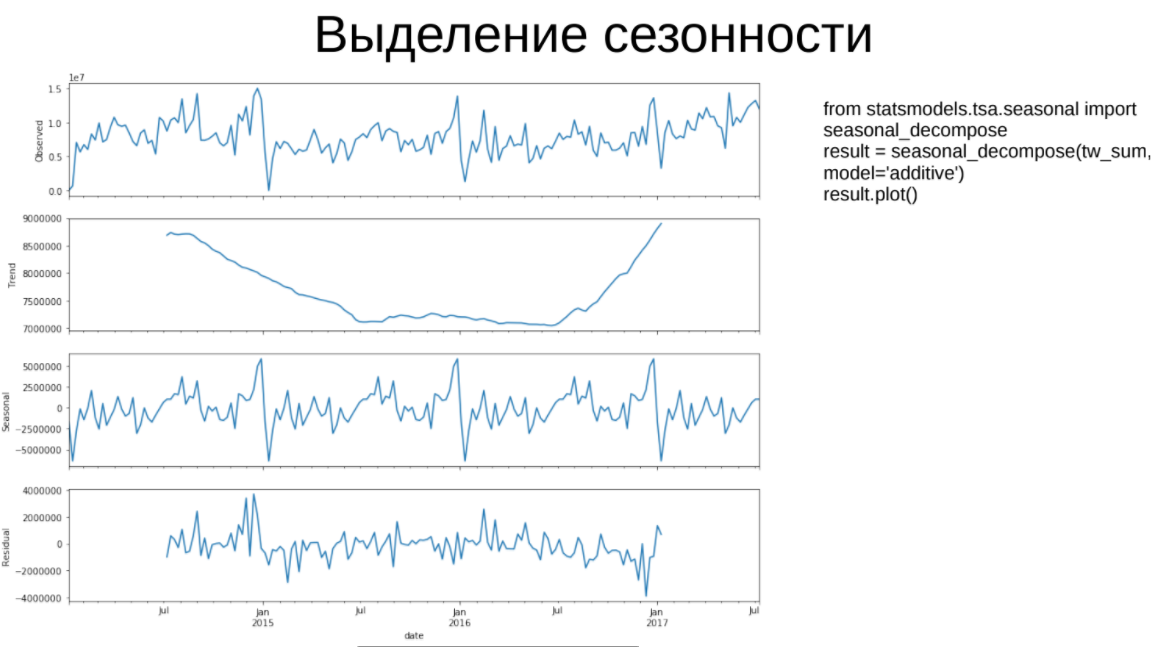
- Selection of seasonality. In this algorithm, the time series is decomposed into 3 components: the trend, the seasonal component and the residuals, which should be similar to “white noise”.
- Model Holt-Winters. It is a triple exponential smoothing: according to the original series, trend and seasonal component.
- (S) ARIMA. ARIMA is an autoregressive model that learns on target variable lags. Lags are needed to bring the series to stationary (for which the mean, variance and covariance do not depend on time). The modification of the algorithm is SARIMA, which allows to take into account seasonality in the data. The advantage of ARIMA over neural networks is a small number of parameters for training, it is less prone to retraining. It also means that parameters can be quickly and efficiently traversed across the grid until the Akaike information criterion (AIC) is minimal.
Some reviews about the event:
“It was very useful and interesting to know how the claimed technologies are used in real projects.” - Andrey Tolmachev, ASSI LLC.
“Thank you for a good event: the correct working format, decent training, a good composition of practicing speakers and a lot of useful information.” - Maxim Sorokin, R & D team leader, Vulkan Scientific and Technical Center.
You can watch videos of all performances on our Facebook page .
Soon we will publish a review of the second day of Data Science Weekend 2018, when the emphasis was placed on Data Engineering, using various data engineer tools for the needs of data-platforms, ETL, search hints services and much more. Stay tuned!
Source: https://habr.com/ru/post/351616/
All Articles