We are looking for patterns on the stock exchange
If you decide to learn how to trade on the stock exchange, then you need to learn how to find patterns on it. A pattern is a certain condition (for example, a characteristic price movement or some event), after which you will know where the price will go next.
At training courses, brokers teach beginners to find and use patterns. But almost all newbies end up losing their money. Below I will show why this happens.
The basics
The whole industry of learning to trade on the stock exchange revolves around two methods of price forecasting:
- technical analysis;
- fundamental analysis;
Technical analysis states that the price movement can be predicted based on its previous movement. For example, if the price chart draws the “Head and Shoulders” figure, then the probability that the price will unfold increases.
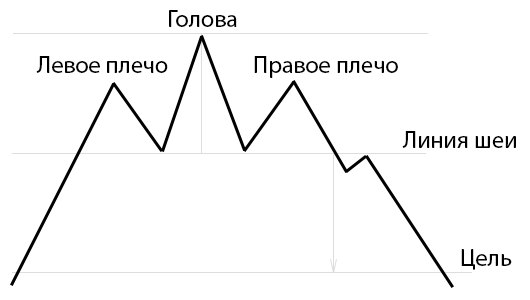
Figure 1 - the figure "Head and shoulders"
In contrast to it, fundamental analysis says that the price movement can be predicted by analyzing external information factors (for example, financial statements, events that have occurred, etc.).
Check if technical analysis works.
There are thousands of ways to predict prices. These are various patterns of motion (patterns), indicators, oscillators, neural networks, etc.
All of them are united by one common feature: they make it possible to predict the future price movement based on its previous values.
Put forward a hypothesis
Now imagine a situation that in the next hour the price will move as well as it moved during the hour 3 years ago.
If within these identical parts of the schedule you apply the same methods of technical analysis, they will give the same readings.
This thought experiment proves that instead of searching for a working method of technical analysis, you can search for similar parts of the chart, after which the price behaves in a similar way. Further I will call such sites "models".
The obvious advantage of searching for models is that you save time on finding a working method of technical analysis. There are thousands of such methods and every day brokers, dealers and various “teachers” of stock trading come up with several new ways. The problem is that you don’t have enough life to test all the trading methods that are offered to you (by the way, this is the calculation).
Do an experiment
To search for models, we will write a program that will analyze the minute charts of the assets of interest to us over the past few years and identify patterns.
1. Data preparation
Download the graphics for the tool that interests us. In my example, I used the per minute quote of the EUR / USD currency pair for the last 10 years.
We will pre-process the data: we will spares only the closing price of every minute from unloading, we divide the schedule into weekly areas and eliminate sharp price hikes due to the non-working time of the exchanges.
Now we divide this schedule into 2 halves of 5 years. In the first half we will look for working models, and in the second - to check how well the found models will work in reality.
2. Model Search
In the first 5-year segment, we:
- iterate over all values of the graph;
- for each value, we will remember N previous values (N will be consistently changed from 10 to 1000) and M subsequent ones (you can take any value <= N, in this experiment M = 0.3 * N);
- each plot of the graph (length N) obtained in (p. 2) is comparable with all other segments of this 5-year graph (length N), and its extensions (length M) are comparable with the continuations of the corresponding segments;
Note on p. 3: To compare pairs of graph plots, I used the least squares method, minimizing the square deviation (hereinafter - the standard deviation). The lower it is - the more similar 2 fragments of the graph.
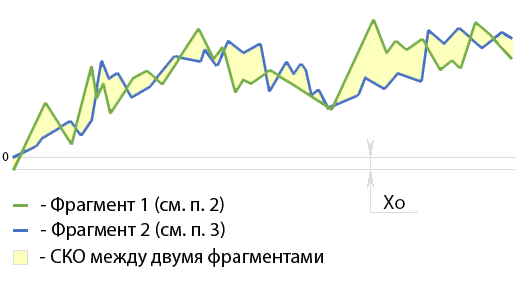
Figure 2 - Illustration of the comparison of two parts of the graph with the length N
SKO is calculated by the formula:
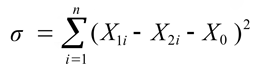
where:
- X1i - the value of the first section of the graph at time i;
- X2i - the value of the second section of the graph at time i;
- X0 - shift of the point of origin on the vertical axis (calculated from the same formula);
- i - time;
- n is the length of the compared parts of the graph;
As a result of such an enumeration (see Section 3), we obtain a large number of comparison results for each section of the graph and its continuation (see Section 2). Further we will call these sites potential models.
In order to understand whether a potential model is working, for each iteration (see p. 3), it is necessary to determine whether there is a relationship between:
- The magnitude of the standard deviation between the potential model and the compared part of the graph (hereinafter - the standard deviation);
- and the magnitude of the standard deviation between the continuation of the potential model and the continuation of the compared part of the graph (hereinafter - the standard deviation)
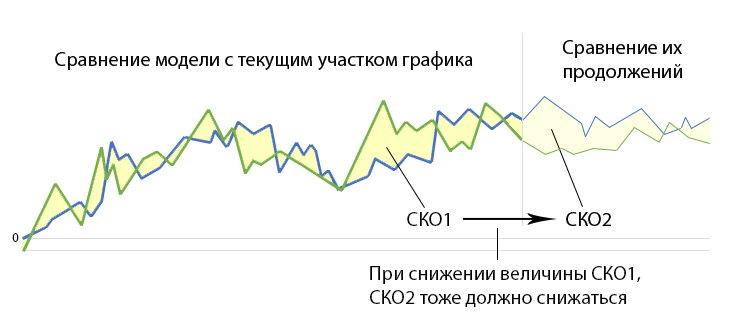
Figure 3 - Illustration of the search for dependencies between CKO1 and CKO2
namely:
- If, with a decrease in SKO1, SKO2 also decreases, then the potential model is working and it can be used in trade;
- If, however, with a decrease in SKO1, SKO2 changes randomly, then the potential model turned out to be inoperative;
We exclude from the list of potential models those in which the SKO1 does not decrease when the SKO1 is lowered.
Thus, we get a large number of models with which you can predict price movements in the market.
3. Check models on real data
Now for each model found we calculate how much money it would earn on the first 5-year plot (on it we trained the system to look for models) and on the second 5-year plot (until now we didn’t touch these data, therefore checking models on them will allow reliably estimate the earning potential).
Put the obtained values on the coordinate plane, where:
- on the X axis, we note the profit that the models we found on the first 5-year segment of the graph;
- on the Y-axis, we note the profit that the models we found in practice (in the second 5-year segment);
To make the data easier to read with the naked eye, in the graph below:
- only 0.1% of the total number of calculated points is displayed;
- only the results of those models, the trade in which would bring a profit in the first 5-year segment, are derived;
- the horizontal axis is divided into 10 equal sections, for each of which the average value is calculated (marked with blue lines)
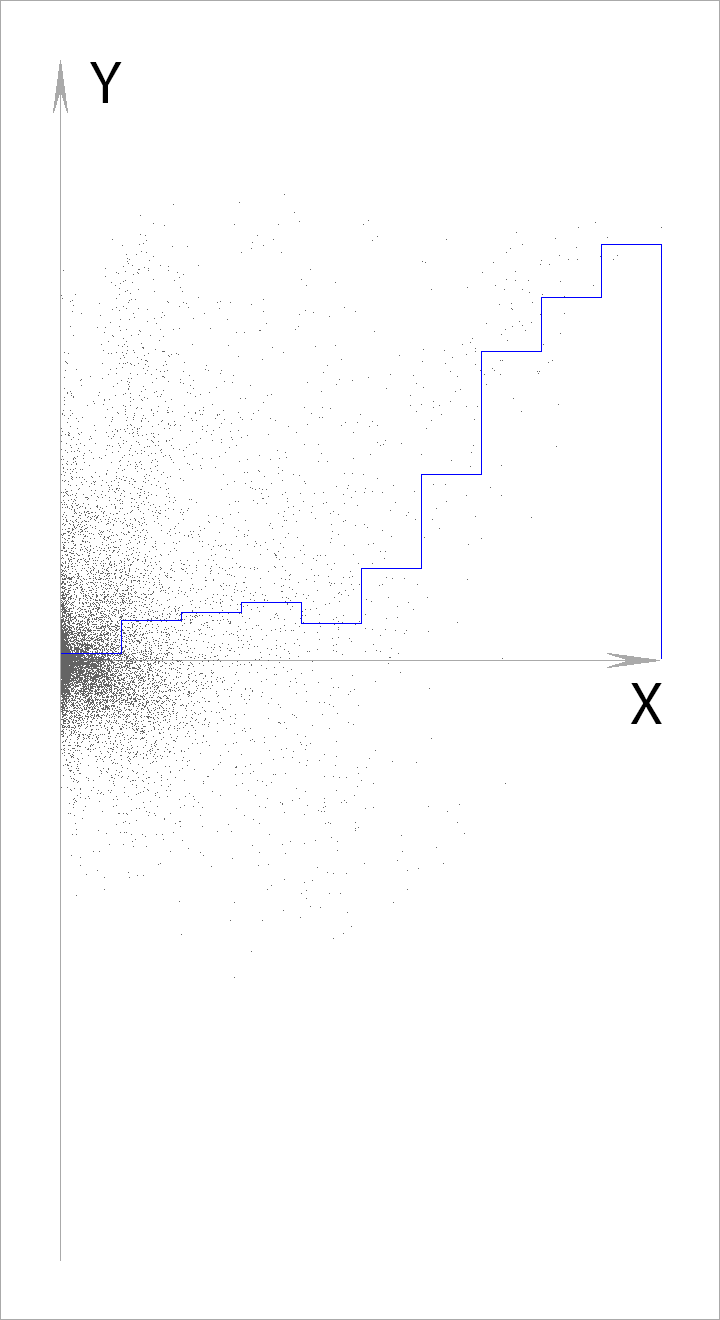
Figure 4 - a graph of the real profitability of models (Y) on their profitability in the area used for training (X)
As you can see, the better the found model works on the test section of the graph, the better it works in combat conditions.
It turns out that there are models on the stock exchange that work.
4. Forecasting the profitability of trade
Before considering how much money you can earn on models, you need to add a spread and / or broker's commission to our calculations.
According to my calculations, when trading a pair of EUR / USD, on average you will pay from 2 points on the transaction (about 0.015% of the current value of the currency pair).
To begin with, let's try to add 1 point of commissions to the algorithms for searching and checking models. Get the schedule:
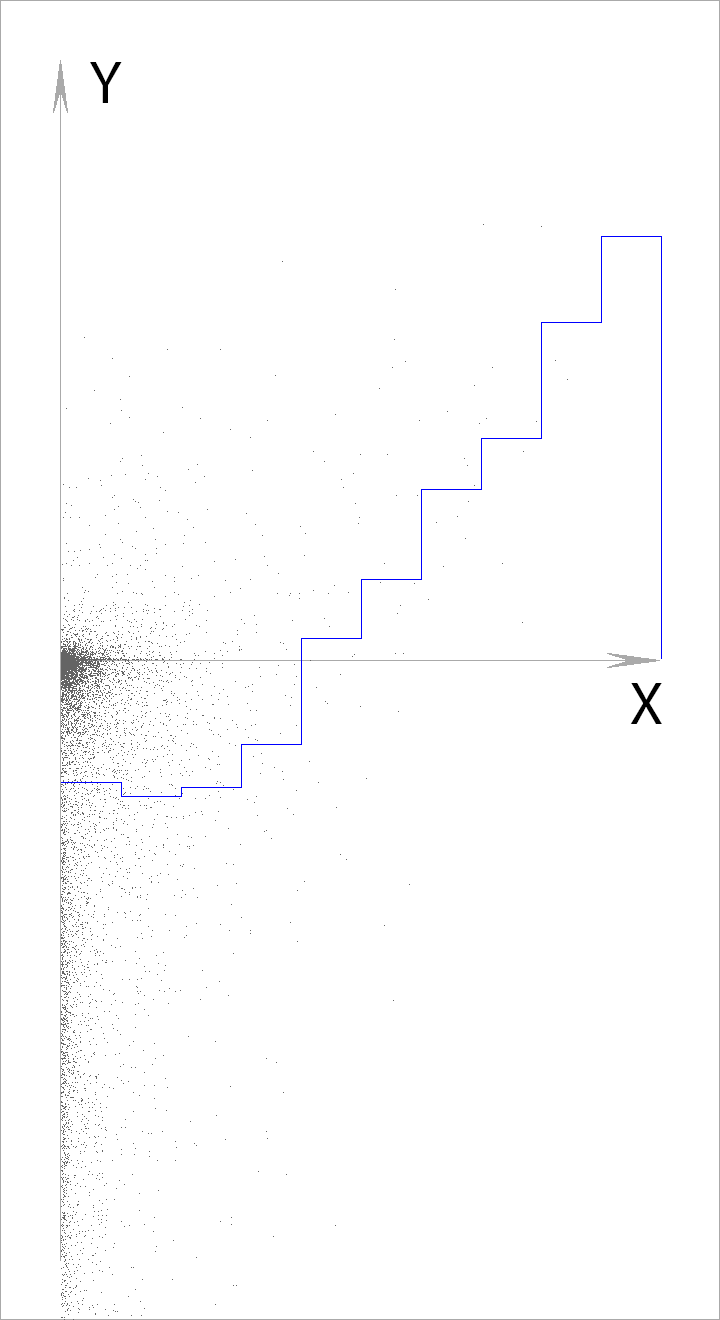
Figure 5 - a graph of the real profitability of models (Y) on their profitability in the area used for training (X), taking into account commissions, the size of 1 point
Now we will increase the amount of commissions to 2 points.
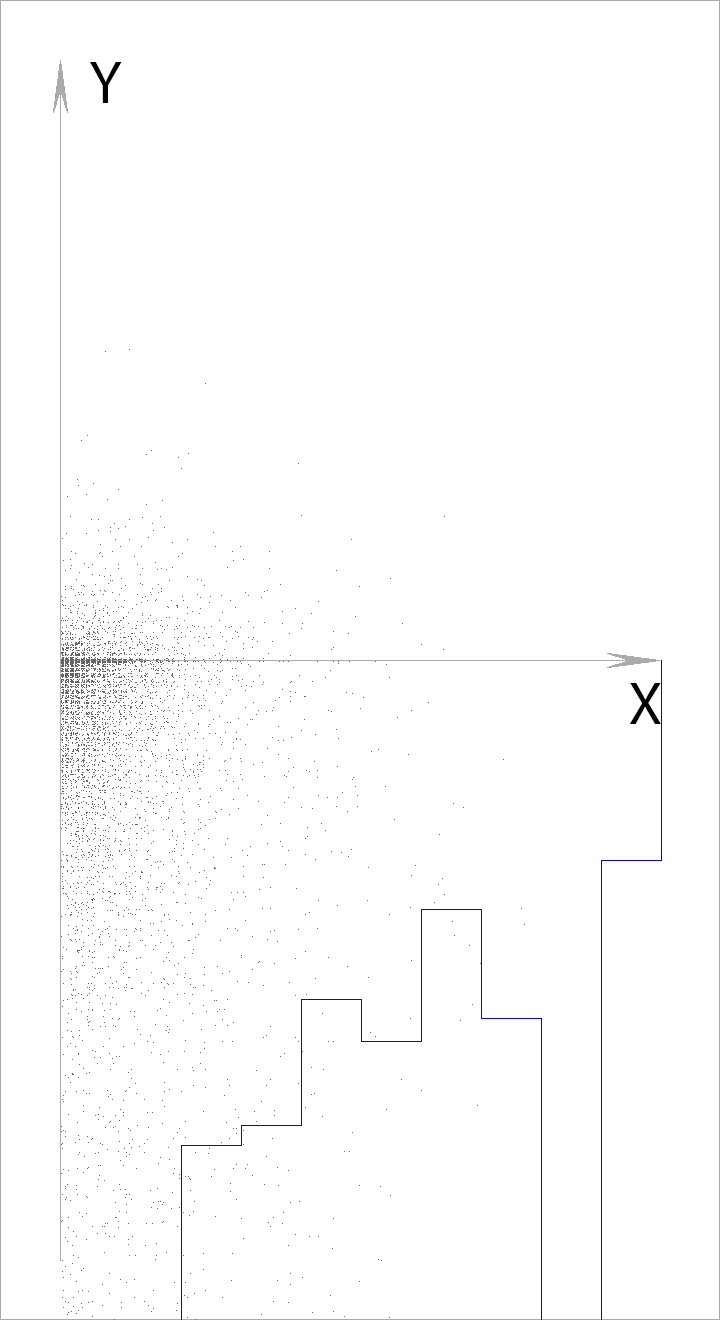
Figure 6 - a graph of the real profitability of models (Y) on their profitability in the area used for training (X), taking into account commissions, the size of 2 points
It turns out that if the size of the spread and commissions in the amount exceed 1 point, then trading with models on the EUR / USD currency pair will cause losses.
findings
In this experiment, we found similar parts of the graphs and checked in which direction the price would move after they passed.
Those plots, after the passage of which the price moved in the same direction, we considered the laws (models) and turned out to be right (see Figure 4).
However, using the same models in a real situation, we could not make a profit, the size of which would exceed the size of the spread and the broker's commission.
Based on this, the following conclusions can be drawn:
- There are patterns on the stock exchanges and they can be found using technical analysis;
- Most of these patterns do not allow you to earn amounts that exceed the size of the broker's spread and commissions;
- From the first two points, it follows that most brokers and dealers advertising trading on the stock exchange as a means of earning deceive people. They appeal to our emotions, promising a better life, but in fact they teach how to lose money. It's my personal opinion.
If you liked the article - I can post the results of a few more experiments.
')
Source: https://habr.com/ru/post/351610/
All Articles