We turn logs as we want - analysis of logs on Windows systems

It's time to talk about convenient work with logs, especially since Windows has a lot of non-obvious tools for this. For example, Log Parser, which sometimes is simply irreplaceable.
The article will not be about serious things like Splunk and ELK (Elasticsearch + Logstash + Kibana). Focus on simple and free.
Logs and command line
Before PowerShell, you could use cmd utilities such as find and findstr . They are quite suitable for simple automation. For example, when I needed to catch errors in the exchange of 1C 7.7, I used a simple command in the exchange scripts:
findstr "Fail" *.log >> fail.txt She allowed to receive in the file fail.txt all exchange errors. But if you needed something more, like getting information about a previous error, you had to create monstrous scripts with for loops or use third-party utilities. Fortunately, these issues are a thing of the past with the advent of PowerShell.
The main tool for working with text logs is the Get-Content cmdlet , designed to display the contents of a text file. For example, to display the WSUS service log in the console, you can use the command:
Get-Content -Path 'C:\Program Files\Update Services\LogFiles\SoftwareDistribution.log' | Out-Host -Paging To display the last lines of the log, there is the Tail parameter, which, paired with the Wait parameter, will allow you to watch the log online. Let's see how the system updates with the command:
>Get-Content -Path "C:\Windows\WindowsUpdate.log" -Tail 5 -Wait 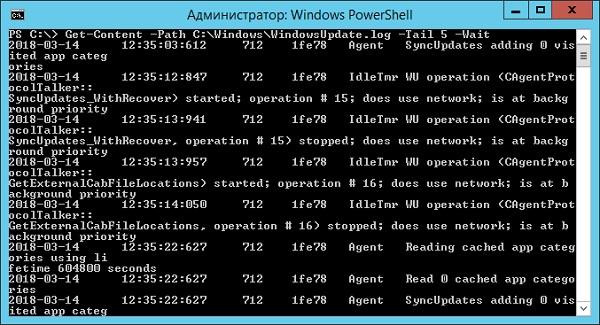
We look at the progress of the Windows update.
If we need to catch certain events in the logs, the Select-String cmdlet , which allows you to display only the strings matching the search mask, will help. Look at the latest Windows Firewall blocking:
Select-String -Path "C:\Windows\System32\LogFiles\Firewall\pfirewall.log" -Pattern 'Drop' | Select-Object -Last 20 | Format-Table Line 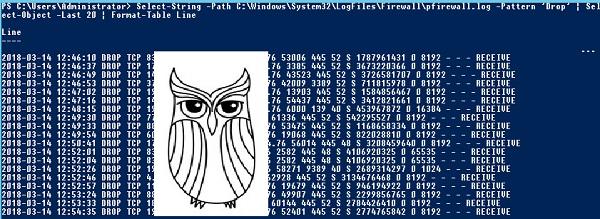
We look, who tries to get through on our grandfather.
If you need to look at the log in the line before and after the desired, you can use the Context parameter. For example, to display three lines after and three lines before an error, you can use the command:
Select-String 'C:\Windows\Cluster\Reports\Cluster.log' -Pattern ' err ' ‑Context 3 Both useful cmdlets can be combined. For example, to display lines 45 through 75 from netlogon.log, the command will help:
Get-Content 'C:\Windows\debug\netlogon.log' | Select-Object -First 30 -Skip 45 The system logs are kept in the .evtx format, and there are separate cmdlets to work with them. Get-Eventlog is used to work with classic logs ("Application", "System", etc.) . This cmdlet is convenient, but does not allow you to work with the rest of the application and service logs. To work with any journals, including classic ones, there is a more universal option - Get-WinEvent. Let us dwell on it in more detail.
To get a list of available system logs, you can run the following command:
Get-WinEvent -ListLog * 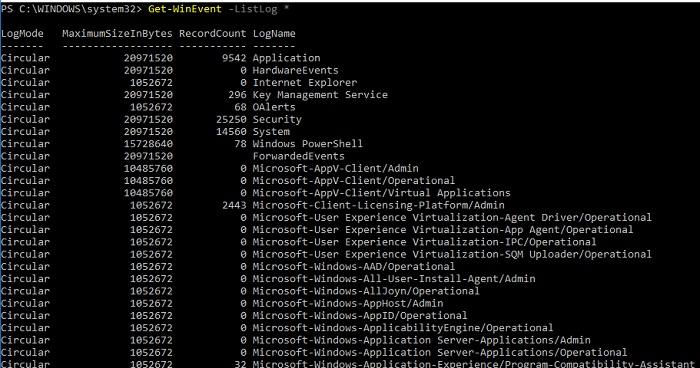
Display available logs and information about them.
To view a particular log, you only need to add its name. For example, we get the last 20 entries from the System log with the command:
Get-WinEvent -LogName 'System' -MaxEvents 20 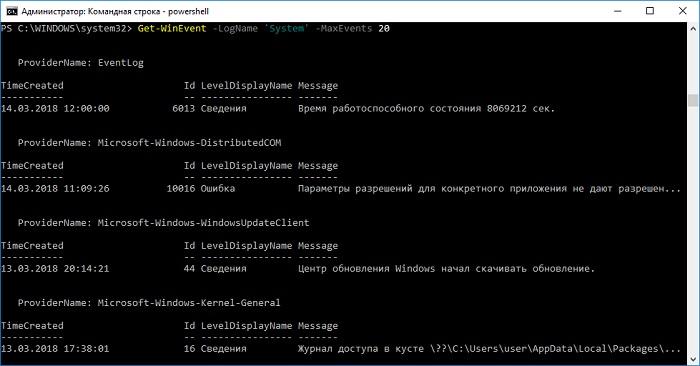
Recent System journal entries.
To obtain certain events, it is most convenient to use hash tables. More information about working with hash tables in PowerShell can be found in the Technet material about_Hash_Tables .
For example, we get all the events from the System log with event code 1 and 6013.
Get-WinEvent -FilterHashTable @{LogName='System';ID='1','6013'} In case you need to receive events of a certain type — warnings or errors — you need to use a filter by importance (Level). The following values are possible:
- 0 - always write;
- 1 - critical;
- 2 - an error;
- 3 - warning;
- 4 - information;
- 5 - detailed (Verbose).
Collecting a hash table with several values of importance with a single command is not so easy. If we want to get errors and warnings from the system log, you can use additional filtering using Where-Object :
Get-WinEvent -FilterHashtable @{LogName='system'} | Where-Object -FilterScript {($_.Level -eq 2) -or ($_.Level -eq 3)} 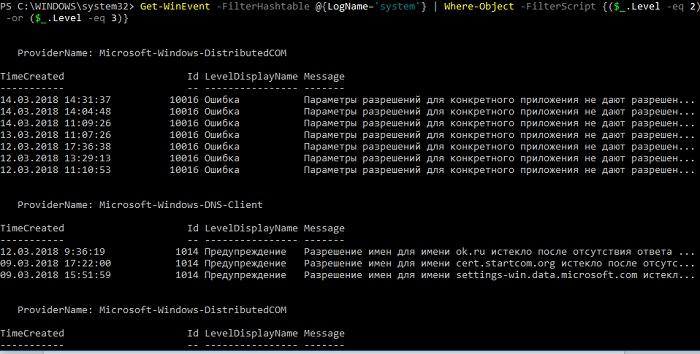
System log errors and warnings.
Similarly, you can assemble a table by filtering directly by the event text and by time.
You can read more about how both cmdlets work with system logs in the PowerShell documentation:
PowerShell is a convenient and flexible mechanism, but requires knowledge of syntax and for complex conditions and processing a large number of files, it will require writing full scripts. But there is an option to get by with just SQL queries with the help of the remarkable Log Parser.
We work with logs through SQL queries
The Log Parser utility came into being at the beginning of the “zero” and since then has managed to acquire the official graphical shell. Nevertheless, it has not lost its relevance and still remains for me one of the most beloved tools for analyzing logs. You can download the utility in the Microsoft Download Center , the graphical interface to it is in the Technet Gallery . About the GUI a little later, let's start with the utility itself.
The possibilities of Log Parser have already been described in the article “ LogParser - the usual view of unusual things, ” so I will start with concrete examples.
First of all, let's deal with text files - for example, we’ll get a list of RDP connections blocked by our firewall. The following SQL query is quite suitable for obtaining such information:
SELECT extract_token(text, 0, ' ') as date, extract_token(text, 1, ' ') as time, extract_token(text, 2, ' ') as action, extract_token(text, 4, ' ') as src-ip, extract_token(text, 7, ' ') as port FROM 'C:\Windows\System32\LogFiles\Firewall\pfirewall.log' WHERE action='DROP' AND port='3389' ORDER BY date,time DESC Let's look at the result:

Look at the Windows Firewall log.
Of course, you can do anything with the resulting table — sort, group. How much fantasy and knowledge of SQL.
Log Parser also works great with many other sources. For example, let's see where users connected to our server via RDP.
We will work with TerminalServices-LocalSessionManager \ Operational.
Not with all the logs the Log Parser works just like that - it cannot access some. In our case, simply copy the log from% SystemRoot% \ System32 \ Winevt \ Logs \ Microsoft-Windows-TerminalServices-LocalSessionManager% 4Operational.evtx to% temp% \ test.evtx.
We will receive data in such a query:
SELECT timegenerated as Date, extract_token(strings, 0, '|') as user, extract_token(strings, 2, '|') as sourceip FROM '%temp%\test.evtx' WHERE EventID = 21 ORDER BY Date DESC 
We look, who and when was connected to our server of terminals.
It is especially convenient to use Log Parser to work with a large number of log files - for example, in IIS or Exchange. Thanks to the SQL capabilities, you can get a wide variety of analytical information, including statistics on the IOS and Android versions that connect to your server.
As an example, let's look at the statistics of the number of letters by day with such a query:
SELECT TO_LOCALTIME(TO_TIMESTAMP(EXTRACT_PREFIX(TO_STRING([#Fields: date-time]),0,'T'), 'yyyy-MM-dd')) AS Date, COUNT(*) AS [Daily Email Traffic] FROM 'C:\Program Files\Microsoft\Exchange Server\V15\TransportRoles\Logs\MessageTracking\*.LOG' WHERE (event-id='RECEIVE') GROUP BY Date ORDER BY Date ASC If the system has Office Web Components installed, which can be downloaded from the Microsoft Download Center , then you can get a beautiful diagram at the output.
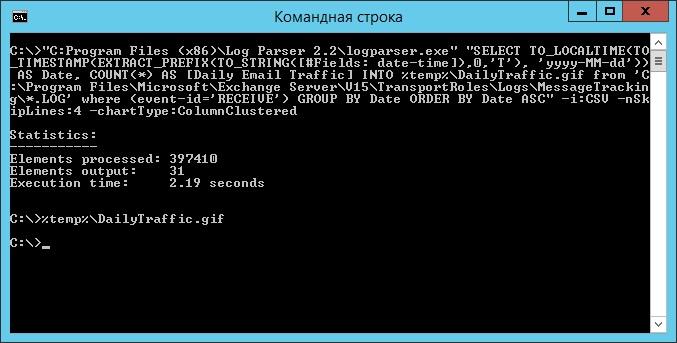
Fulfill the request and open the resulting image ...

We admire the result.
It should be noted that after installing the Log Parser, the COM component MSUtil.LogQuery is registered in the system . It allows you to make requests to the utility engine not only through a call to LogParser.exe, but also using any other familiar language. As an example, I will give a simple PowerShell script that will output the 20 largest files on drive C.
$LogQuery = New-Object -ComObject "MSUtil.LogQuery" $InputFormat = New-Object -ComObject "MSUtil.LogQuery.FileSystemInputFormat" $InputFormat.Recurse = -1 $OutputFormat = New-Object -ComObject "MSUtil.LogQuery.CSVOutputFormat" $SQLQuery = "SELECT Top 20 Path, Size INTO '%temp%\output.csv' FROM 'C:\*.*' ORDER BY Size DESC" $LogQuery.ExecuteBatch($SQLQuery, $InputFormat, $OutputFormat) $CSV = Import-Csv $env:TEMP'\output.csv' $CSV | fl Remove-Item $env:TEMP'\output.csv' $LogQuery=$null $InputFormat=$null $OutputFormat=$null You can familiarize yourself with the documentation on the component operation in the Log Parser COM API Overview material on the SystemManager.ru portal.
Thanks to this feature, there are several utilities to facilitate the work, which are a graphical shell for the Log Parser. I will not consider paid ones, but I’ll show you a free Log Parser Studio.

Interface Log Parser Studio.
The main feature here is the library, which allows you to keep all requests in one place, without placers in folders. Also immediately presented a lot of ready-made examples that will help to deal with queries.
The second feature is the ability to export the request to the PowerShell script.
As an example, let's see how the selection of mailboxes that send the most emails will work:
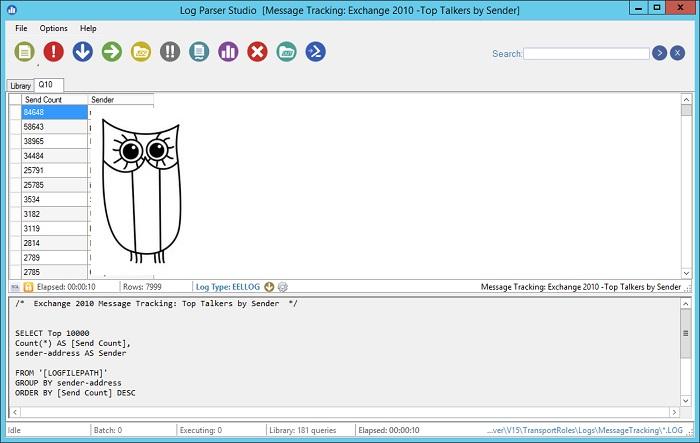
Selection of the most active boxes.
In this case, you can choose a lot more log types. For example, in the "pure" Log Parser there are restrictions on the types of input data, and there is no separate type for Exchange - you need to enter the field descriptions and skip headers yourself. In Log Parser Studio, the necessary formats are ready for use.
In addition to the Log Parser, you can work with logs using the MS Excel features, which were mentioned in the material “ Excel instead of PowerShell ”. But maximum convenience can be achieved by preparing the primary material with the Log Parser and then processing it through Power Query in Excel.
Have you ever used any tools to shovel logs? Share in the comments.
')
Source: https://habr.com/ru/post/351594/
All Articles