Hyperpilot 100% open source for its products.

We have opened the source code of all our products that we have been working on for the last year, and in this post I want to briefly tell about them.
The last year Hyperpilot worked in stealth mode, so let me explain what we were going to do. Our mission is to provide intelligence to the infrastructure in order to increase efficiency and productivity. DevOps and system engineers are constantly faced with the need to make many decisions related to container infrastructure and processes that require manual work. These solutions include all the way from virtual machine configuration (instance type, region, etc.), container configurations (resource request, number of container instances, etc.) to application level configuration options (jvm, etc.) . Operators and developers often make static choices, and operational personnel have no idea why such a decision was made. Worst of all, operators tend to overdo it, and this leads to inefficient use of infrastructure. We worked on three products that could help operators find tools for better solutions and automate recommendations in the future. Next, I will talk about high-level products that are publicly available.
HyperConfig: smart configuration lookup
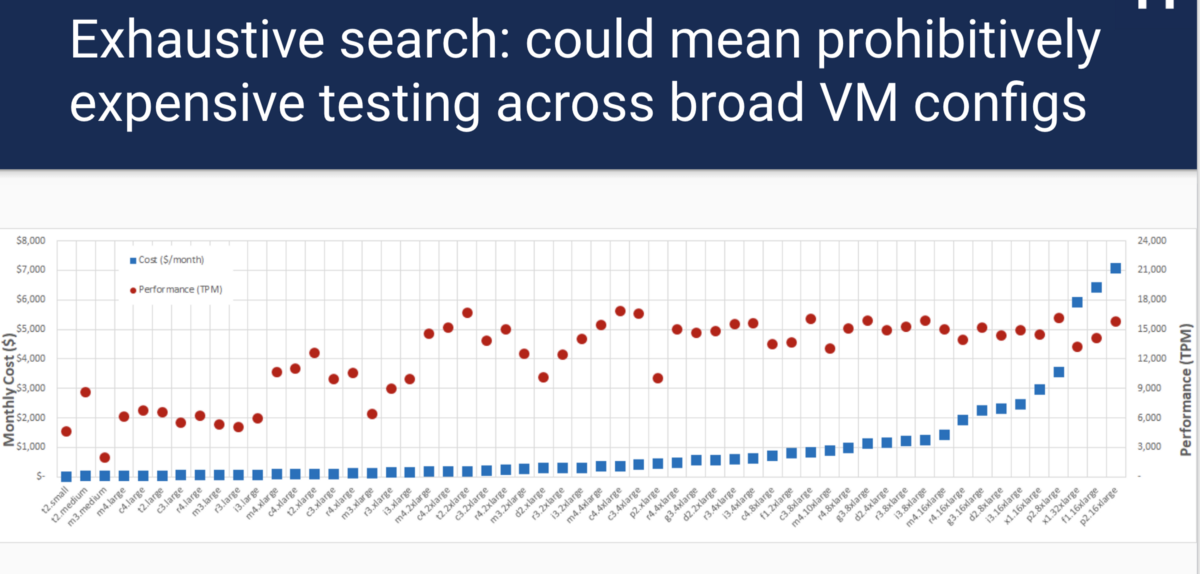
If you used the cloud, deployed docker containers using Kubernetes or Mesos, then you know: one of the first problems is to find out which configuration will be best for each component. For example, what type of virtual machine instance should I use? How many nodes to deploy? What is the amount of processor time and memory to allocate the container? All these questions imply a trade-off between cost and performance. For example, take the size of a virtual machine. Selecting an instance of a large virtual machine will be much more expensive, but may give better performance. Choosing too small a virtual machine leads to performance problems and SLA. It’s hard to determine which solution is better: if you take a MySQL tpcc benchmark and run it on each type of AWS instance, then the best performance and cost ratio does not follow a linear and predictable pattern:
In addition, an exhaustive search requires a lot of time and money. Fortunately, this is not a new problem, and there are quite a few research solutions, but there is no common open source solution that supports the general conclusion of load testing.
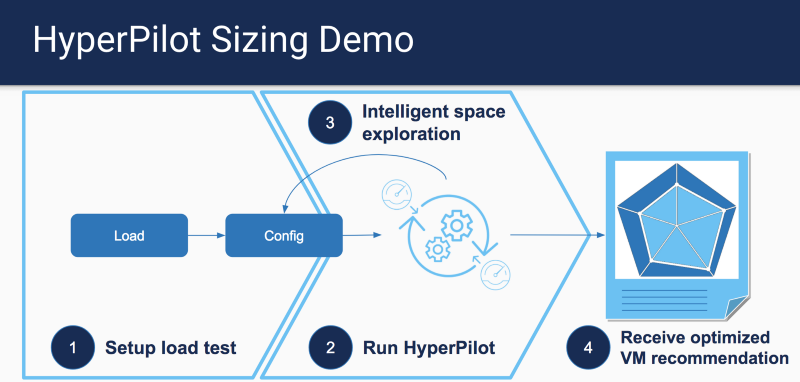
Inspired by CherryPick , we created hyperconfig and proposed a set of AWS instance types for various criteria based on a common load test result.
')
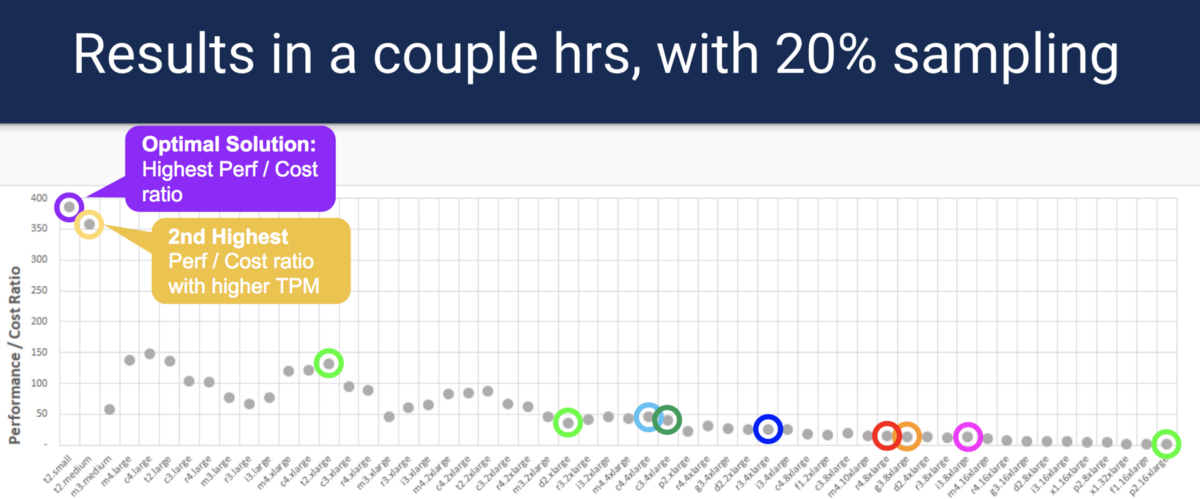
Instead of an exhaustive search for each type of instance, HyperConfig uses a well-known optimization method, called Bayesian Optimization, to find the best options, while having fewer sample points. Samples can be run in parallel, which reduces time and cost. Please note: HyperConfig does not guarantee finding the most optimal option, but will select the option closest to the optimal one.
For more information on how to run our demo version, as well as details on the code, please refer to the sizing analyzer section.
HyperPath: Resource Problem Analysis
One of the problems that operators face is finding the reason for the decline in performance in the Kubernetes cluster. The problem may come from various sources of infrastructure. However, if you narrow the circle of finding a problem to the most likely places, you can develop a system that can diagnose and find the source of the performance problem. HyperPath focuses on detecting cpu / memory / network / IO problem areas, and also determines if a problem occurs due to limits set for container (s) or lack of node resources.
HyperPath assumes that it can access the application's SLO metrics (for example, the 95th percentile delay), as well as the resource metrics that include the cpu / mem / net / IO container parameters and similar node level indicators. Using this data, HyperPath will try to match which resource indicators have exceeded the threshold and ranks the core data with the highest correlation.
In the demonstration, you will see that it is possible to detect processor bottlenecks and other resources that have exceeded the SLO threshold during the application delay:
For more information and source code, please refer to the analysis section of the diagnosis .
Best effort controller
It is well known that all operators intentionally overstate the required amount of resources for their applications. One of the most important reasons for this behavior is the consideration of bursts that can occur suddenly. This leads to low utilization of cluster resources, since peak loads occur only occasionally. We cannot just allocate a minimum of resources and hope for cloud and autoscaling, since the cluster scaling process can take a minute (s) during peak times. How, then, use excess resources? One way is to launch the best effort (BE) workloads. You need to make sure that workloads can control, increase or decrease the number of available resources during surges.
The work of Christos Kozyrakis and David Lo on Heracles was aimed at solving the problem of increasing the efficiency of resource use. For more information on how Heracles works, please refer to the original document . At a very high level, Heracles creates a controller on each node, and each of these controllers has an auxiliary controller for each resource (processor, memory, network, IO, caching, etc.), which monitors resource utilization. It then uses the main SLO metric of the application as an input signal to determine when and how to scale the resources for each workload. When the application rate increases significantly, we can begin to allocate more resources for BE work, and vice versa, reduce when the load drops.
At Hyperpilot, we developed the Heracles algorithm and made it work for Kubernetes. In the next video you will see the controller in action when we launched Spark with the BestEffort QoS quality class next to microservice.
When Spark is launched next to microservice without a BE controller, you will see an increase in latency due to interference from Spark Job. Please note that even the BestEffort setting for Spark does not eliminate interference problems. With the BE controller turned on, we are watching for a delay that will be monitored within the SLO threshold, and the BE tasks can progress without completion.
More information about the code base can be found here .
I hope these projects will show how the use of resource utilization data from kubernetes and applications can affect cost and performance.
Original: Hyperpilot open sourced 100% of its products .
Source: https://habr.com/ru/post/351478/
All Articles