Analysis of trends in the cryptocurrency market (for example, Bitcoin)
Currently, there are an infinite number of publications analyzing the cryptocurrency market from experts of all kinds and ranks. The topic is so relevant that it did not make its review just lazy and not sophisticated. The analysts' forecasts are sometimes so different that you cannot decide what to do next: look for a bank to which you can mortgage an apartment and invest in the next “-coin”, or train the corrosive “And I said!” In front of a mirror and depict with infernal laughter the ghost of Leni Golubkov.
This article does not set a goal to persuade the reader in favor of investing in cryptographic markets, or, on the contrary, to disown the cryptocurrency with the Orthodox dollar. This essay proposes to evaluate the existing patterns in terms of numbers and formulas, omitting permanent fluctuations caused by fundamental factors or the force of habit (yes, the psychological factor and market sentiment can sometimes significantly shift the current state of affairs; at the end of the article we will find out what caused collapse in currency prices in January 2018).
Well, let's do an analysis of the main indicators of the cryptocurrency market by the example of the industry's mastodon - Bitcoin. However, I dare to assure you that the analysis of the behavior of most top currencies gives similar results (Litecoin, Dash, Ethereum, Monero, Z-cash, etc.). Undoubtedly, the most important and interdependent indicators of the cryptocurrency market are the currency price itself (we will consider the dollar value expression), as well as the degree of involvement of computing power in the coin mining process - the network hashrate.
What is the relationship between price and hash rate of cryptocurrency? First, it is absolutely obvious that by engaging our own equipment in the process of confirming transactions in a cryptocurrency network (“mining”), a person or company assumes not only to return the cost of the equipment invested (and its replacement is necessary every 2-3 years due to physical wear and obsolescence ), but also to cover the infrastructure costs for its maintenance, as well as to obtain economic benefits in the form of profits not less than those of alternative sources of profitability; secondly, the emission remuneration for participation in the cryptocurrency mining comes to the secondary market only indirectly at the time of the sale of the currency by the miner (owner of mining equipment). Thus, an artificial deficit of an asset is created on the market, which leads to an increase in its price to the level that would satisfy the owners of the equipment.
')
On the other hand, as the price of cryptocurrency grows, the profitability of mining also grows, which leads to the involvement of more and more new capacities in the process of cryptocurrency mining, thereby increasing the network's hashrate.
Let's go directly to the analysis of indicators. All historical data parameters were downloaded from the resource bitinfocharts.com.
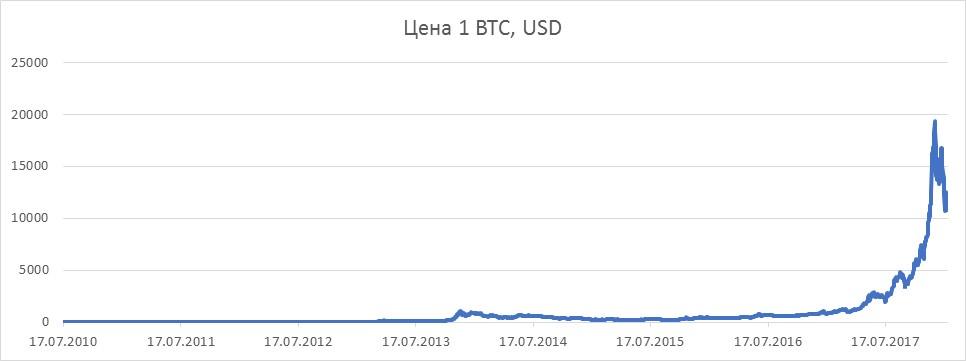
Consider the graph of Bitcoin price dynamics for the period from 07/17/2010 to 01/24/2018 (at the time of writing)
From the graph, it is clear that the dynamics of price change is clearly non-linear in nature, and the power dependence on time. Let us resort to logarithm of data in order to transfer from the explicitly power-law dependence of the function on the argument (price on time) to the expectedly linear one and see how this affects the graph.
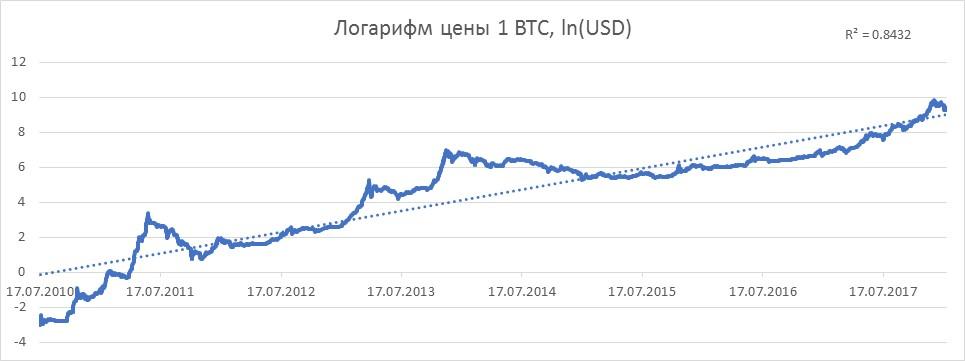
The graph now represents a time-dependent curve with a 84% confidence level.
We will understand where did this degree of reliability. The curve linearly dependent on time means that the graph of our function should tend to a straight line (depicted by a dotted line on the graph). This line can be obtained by resorting to a regression analysis apparatus to find linear regression coefficients. Further, it is important to assess how much our initial function is approximated by the resulting straight line (that is, the extent to which the behavior of the original curve can be predicted by the resulting straight line). The coefficient of determination R2, a statistical characteristic describing how much the variance (spread) of the initial data is explained by the variance of the model, can help in this. Simply put, the closer the initial curve is to the modeled straight line, the higher will be the value of R2 (varies from 0 to 1), and the higher the likelihood that the future behavior of the indicator will correspond to the trend of the resulting model. In our case, the value of the coefficient of determination was 0.8432.
It is clearly seen that the curve of the dependence of the logarithm of price on time has local extremes and trends, in other words, at different points in time, the price either outpaced the global trend or lagged behind it somewhat, but with a certainty of 84% it followed. Looking at the chart, it would be logical to assume that by changing the analysis horizon, a more “accurate” curve can be applied to a linear trend. Below are graphs with R2 statistics for the last 2 years, 1 year, and 6 months, respectively.
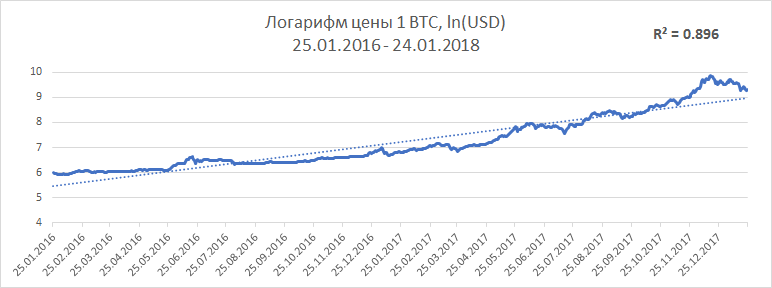
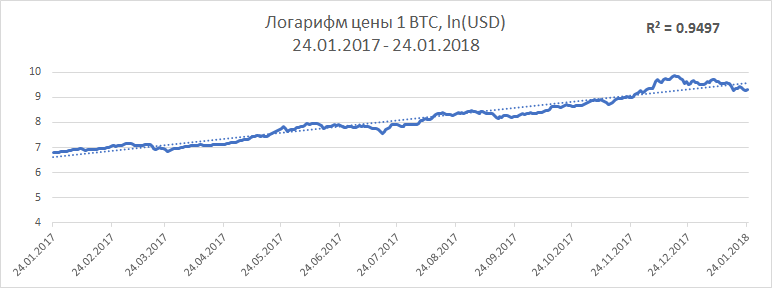
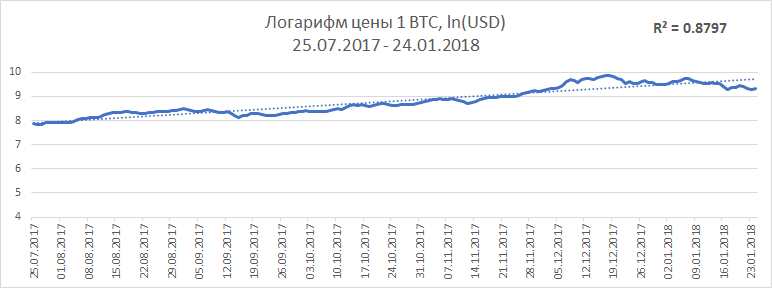
As you can see from the graphs, the value of the R2 statistics is from 0.88 to 0.95. Obviously, if the calculated linear trend (dashed line on the graph) is extended to the future, then it is possible to obtain estimated levels of the indicator values for a particular date (extrapolation of data).
Let's mentally go back half a year ago and test the hypothesis about the possibility of predicting cryptocurrency price trends. So if we made an assessment of today's price value ($ 10,000) Bitcoin six months ago (the price as of 07.27.2017 was $ 2,500), we would get the following price levels depending on the analyzed horizon of historical data:
2 years trend (07.28.2015 - 07.07.2017) - the price is $ 4,400;
the annual trend (07/27/2016 - 07/27/2017) - the price is $ 5,800;
The 9th monthly trend (10.26.2016 - 07.27.2017) - the price is $ 6,900;
The 6th monthly trend (01/25/2017 - 07/27/2017) - the price is $ 8,900.
It can be seen that the price behavior varies depending on the analysis horizon and tends to accelerate growth, and the real current price corridor is even slightly higher than the most optimistic forecast. Thus, it is advisable to assess the potential price levels in the future relative to the current date.
So, using the obtained price trends of linear regression, we have that the average forecast price level in 3 months is $ 13,600, and in 6 months - $ 16,700.
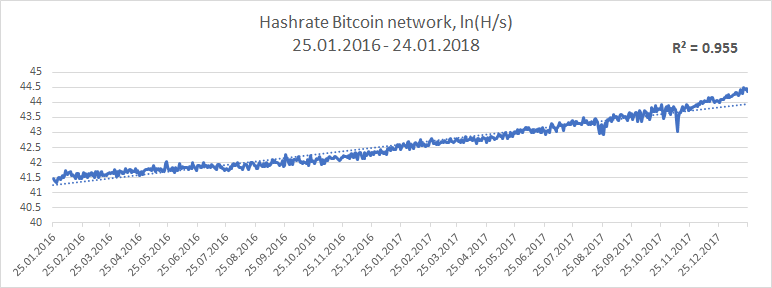
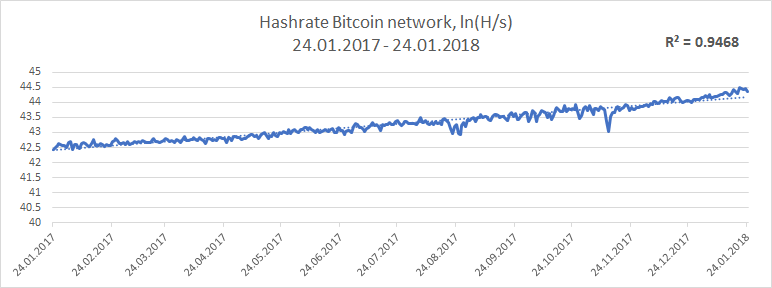
An analysis of the involvement of computing power in the process of cryptocurrency production yields similar results with an even higher statistical confidence value (real data are located closer to the approximating straight line). Below are graphs of the logarithm of the cumulative hash rate of the network over time for different time ranges.
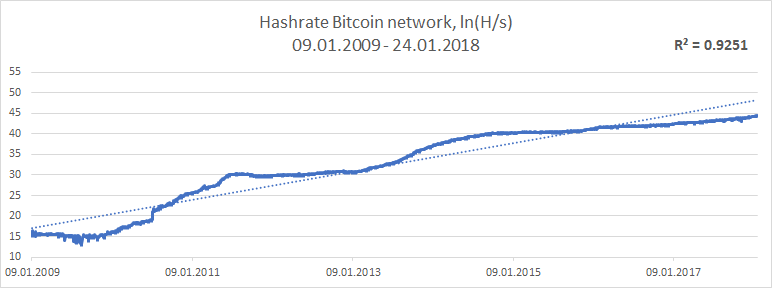
If we talk about quantitative estimates of extrapolated data, then the average forecast for trends in 3 months is 26.3 EH / s (26.3 * 1018), and in 6 months, 34.6 EH / s at the current level of 20.5 EH / s.
Thus, it is clear that the predicted relative growth of the main indicators (price and hashrate) is almost identical, and, therefore, tells us about the expected conditional constant income from mining. And if we take into account the fact that with the growth of the cryptocurrency rate against the dollar, infrastructure costs in terms of cryptocurrency decrease, then investing in its “mining” is very attractive despite the steady growth of the total computing power.
And finally, the promised story about the power of habit and the collapse of the cryptographic market. I believe many readers are accustomed to watching regular statistical and analytical data on the same information resources, whether it is the weather forecast, the results of sports matches or the dynamics of the cryptocurrency market. So, there is some very popular resource that analyzes the prices of various cryptocurrencies and capitalization of their markets (coinmarketcap.com), while being a fairly convenient source of operational market statistics. As it is known, the prices for cryptocurrencies on different exchanges differ, and sometimes significantly, and here such analytical resources these prices average and operate with aggregated data in their calculations. The crypto community has long been noticed and discussed the fact that South Korean traders artificially inflate the cost of cryptocurrency and the quotes of these exchanges distort the picture. The owner and manager of CoinMarketCap, a certain Brandon Chaz, decided to correct this market injustice and excluded the Korean market quotes from the calculation of average cryptocurrency prices, but forgot to inform clients about this, as a result of which the market capitalization has plummeted. Few people outside CoinMarketCap understood the true cause of this “fall”, which in essence was just a game of numbers. However, many traders trying to take profits began to actively sell cryptocurrencies, which significantly affected their rates like a snowball. As a result, the capitalization of the cryptocurrency market as a whole has lost about 100 billion dollars.
With this example, I would like to emphasize once again the fundamental impossibility of an accurate forecast of the price of cryptocurrency at one time or another, but you can evaluate the internal trends of the main market characteristics and understand the price levels, benchmarks on which you can rely in the decision-making process.
This article does not set a goal to persuade the reader in favor of investing in cryptographic markets, or, on the contrary, to disown the cryptocurrency with the Orthodox dollar. This essay proposes to evaluate the existing patterns in terms of numbers and formulas, omitting permanent fluctuations caused by fundamental factors or the force of habit (yes, the psychological factor and market sentiment can sometimes significantly shift the current state of affairs; at the end of the article we will find out what caused collapse in currency prices in January 2018).
Well, let's do an analysis of the main indicators of the cryptocurrency market by the example of the industry's mastodon - Bitcoin. However, I dare to assure you that the analysis of the behavior of most top currencies gives similar results (Litecoin, Dash, Ethereum, Monero, Z-cash, etc.). Undoubtedly, the most important and interdependent indicators of the cryptocurrency market are the currency price itself (we will consider the dollar value expression), as well as the degree of involvement of computing power in the coin mining process - the network hashrate.
What is the relationship between price and hash rate of cryptocurrency? First, it is absolutely obvious that by engaging our own equipment in the process of confirming transactions in a cryptocurrency network (“mining”), a person or company assumes not only to return the cost of the equipment invested (and its replacement is necessary every 2-3 years due to physical wear and obsolescence ), but also to cover the infrastructure costs for its maintenance, as well as to obtain economic benefits in the form of profits not less than those of alternative sources of profitability; secondly, the emission remuneration for participation in the cryptocurrency mining comes to the secondary market only indirectly at the time of the sale of the currency by the miner (owner of mining equipment). Thus, an artificial deficit of an asset is created on the market, which leads to an increase in its price to the level that would satisfy the owners of the equipment.
')
On the other hand, as the price of cryptocurrency grows, the profitability of mining also grows, which leads to the involvement of more and more new capacities in the process of cryptocurrency mining, thereby increasing the network's hashrate.
Let's go directly to the analysis of indicators. All historical data parameters were downloaded from the resource bitinfocharts.com.
Bitcoin Price Trend Analysis
Consider the graph of Bitcoin price dynamics for the period from 07/17/2010 to 01/24/2018 (at the time of writing)
From the graph, it is clear that the dynamics of price change is clearly non-linear in nature, and the power dependence on time. Let us resort to logarithm of data in order to transfer from the explicitly power-law dependence of the function on the argument (price on time) to the expectedly linear one and see how this affects the graph.
The graph now represents a time-dependent curve with a 84% confidence level.
We will understand where did this degree of reliability. The curve linearly dependent on time means that the graph of our function should tend to a straight line (depicted by a dotted line on the graph). This line can be obtained by resorting to a regression analysis apparatus to find linear regression coefficients. Further, it is important to assess how much our initial function is approximated by the resulting straight line (that is, the extent to which the behavior of the original curve can be predicted by the resulting straight line). The coefficient of determination R2, a statistical characteristic describing how much the variance (spread) of the initial data is explained by the variance of the model, can help in this. Simply put, the closer the initial curve is to the modeled straight line, the higher will be the value of R2 (varies from 0 to 1), and the higher the likelihood that the future behavior of the indicator will correspond to the trend of the resulting model. In our case, the value of the coefficient of determination was 0.8432.
It is clearly seen that the curve of the dependence of the logarithm of price on time has local extremes and trends, in other words, at different points in time, the price either outpaced the global trend or lagged behind it somewhat, but with a certainty of 84% it followed. Looking at the chart, it would be logical to assume that by changing the analysis horizon, a more “accurate” curve can be applied to a linear trend. Below are graphs with R2 statistics for the last 2 years, 1 year, and 6 months, respectively.
As you can see from the graphs, the value of the R2 statistics is from 0.88 to 0.95. Obviously, if the calculated linear trend (dashed line on the graph) is extended to the future, then it is possible to obtain estimated levels of the indicator values for a particular date (extrapolation of data).
Let's mentally go back half a year ago and test the hypothesis about the possibility of predicting cryptocurrency price trends. So if we made an assessment of today's price value ($ 10,000) Bitcoin six months ago (the price as of 07.27.2017 was $ 2,500), we would get the following price levels depending on the analyzed horizon of historical data:
2 years trend (07.28.2015 - 07.07.2017) - the price is $ 4,400;
the annual trend (07/27/2016 - 07/27/2017) - the price is $ 5,800;
The 9th monthly trend (10.26.2016 - 07.27.2017) - the price is $ 6,900;
The 6th monthly trend (01/25/2017 - 07/27/2017) - the price is $ 8,900.
It can be seen that the price behavior varies depending on the analysis horizon and tends to accelerate growth, and the real current price corridor is even slightly higher than the most optimistic forecast. Thus, it is advisable to assess the potential price levels in the future relative to the current date.
So, using the obtained price trends of linear regression, we have that the average forecast price level in 3 months is $ 13,600, and in 6 months - $ 16,700.
Bitcoin hashrate trend analysis
An analysis of the involvement of computing power in the process of cryptocurrency production yields similar results with an even higher statistical confidence value (real data are located closer to the approximating straight line). Below are graphs of the logarithm of the cumulative hash rate of the network over time for different time ranges.
If we talk about quantitative estimates of extrapolated data, then the average forecast for trends in 3 months is 26.3 EH / s (26.3 * 1018), and in 6 months, 34.6 EH / s at the current level of 20.5 EH / s.
Thus, it is clear that the predicted relative growth of the main indicators (price and hashrate) is almost identical, and, therefore, tells us about the expected conditional constant income from mining. And if we take into account the fact that with the growth of the cryptocurrency rate against the dollar, infrastructure costs in terms of cryptocurrency decrease, then investing in its “mining” is very attractive despite the steady growth of the total computing power.
And finally, the promised story about the power of habit and the collapse of the cryptographic market. I believe many readers are accustomed to watching regular statistical and analytical data on the same information resources, whether it is the weather forecast, the results of sports matches or the dynamics of the cryptocurrency market. So, there is some very popular resource that analyzes the prices of various cryptocurrencies and capitalization of their markets (coinmarketcap.com), while being a fairly convenient source of operational market statistics. As it is known, the prices for cryptocurrencies on different exchanges differ, and sometimes significantly, and here such analytical resources these prices average and operate with aggregated data in their calculations. The crypto community has long been noticed and discussed the fact that South Korean traders artificially inflate the cost of cryptocurrency and the quotes of these exchanges distort the picture. The owner and manager of CoinMarketCap, a certain Brandon Chaz, decided to correct this market injustice and excluded the Korean market quotes from the calculation of average cryptocurrency prices, but forgot to inform clients about this, as a result of which the market capitalization has plummeted. Few people outside CoinMarketCap understood the true cause of this “fall”, which in essence was just a game of numbers. However, many traders trying to take profits began to actively sell cryptocurrencies, which significantly affected their rates like a snowball. As a result, the capitalization of the cryptocurrency market as a whole has lost about 100 billion dollars.
With this example, I would like to emphasize once again the fundamental impossibility of an accurate forecast of the price of cryptocurrency at one time or another, but you can evaluate the internal trends of the main market characteristics and understand the price levels, benchmarks on which you can rely in the decision-making process.
Source: https://habr.com/ru/post/351436/
All Articles