Distant Joining: choose a representative set of genes
Modern methods of bioinformatics allow fairly accurate restoration of evolutionary histories based on sequences of genes or proteins of living organisms. And thanks to the sequencing technologies of the new generation, the sequences are produced faster than they are analyzed. Here is just an evolutionary reconstruction - it is computationally expensive and it would be nice to be able to get representative samples of a size suitable for analysis. How to do this and what is generally “representative” in this case - under the cut.
First of all, let us state clearly what is happening and what we are trying to achieve. We want to know where it came from and how a particular gene, say, a man, evolved. Or potatoes, or unicellular algae, the methods for any organism will be about the same. In biological databases one can find related sequences of other organisms, shove them into some kind of magic program and get a phylogenetic tree at the output. The problem is that there will probably be thousands of related sequences. And the construction of phylogenetic trees with maximum likelihood methods or Bayesian phylogenetics is an NP-complete problem and the solution consists, roughly speaking, in the search for different trees and parameters of the evolutionary model. I usually have from a couple of days to a week on 2 16-core AMD Opteron 6276 processors with 64 Gb of RAM for several hundred genes of medium length. There are also polynomial methods of phylogenetic analysis, but they are less accurate and publishing an article based on them in a decent journal will be unrealistic.
So, you need to take from this set the correct sample: select a relatively small set of sequences of a given size and draw conclusions from it about the entire set. Further, some phylogenetic terminology will be used, explanations - under the spoiler.
Let us define the “correct sample” as follows: let there be a certain number of treasure in the tree that includes all the sequences from the set. What is their biological meaning, it does not matter; the main thing is that they are mostly monophyletic (that is, they go back to a single ancestor each) and are basically separated by a more or less long branch from the rest of the tree. Each clade corresponds to a subset of its sequences. We shall assume that the correct sample is such that each of these subsets is represented in it by at least one sequence.
')
The most obvious idea is to take sequences at random and hope that the sample will be more or less correct. But an accident - it is an accident; may be correct, and maybe not. In practice, most likely it will not, because the biosphere is studied unevenly. A person and a number of model objects (the front sight of Drosophila, Baker's yeast, Escherichia coli E. coli , etc.) are studied in great detail and everything that can be sequenced is repeatedly sequenced for them. Economically or medically significant objects (for example, rice and HIV) and close relatives of significant objects (for example, primates as human relatives) are studied a little worse, but also very well. But single-celled plankton, no matter how diverse it may be, is of little interest to anyone and is sequenced relatively rarely. Therefore, there may well be 30 sequences of animals, 30 sequences of plants, 20 sequences of fungi, and one or two sequences of all other eukaryotic groups in a set of 100 homologous genes.
For a random sample, the ratio of the number of groups as a whole will remain. But we do not need to save it at all; it still reflects more the number of scientists involved in one or another taxon and their financing than some kind of biological reality. We need to cover as many groups as possible, including small ones.
Okay, the next idea is that since we already have taxonomic meta information (which organism has which sequence), why not use it? Take one human gene, more or less evenly take a dozen of the genes of other animals, a dozen of the genes of fungi, and so on. The idea is not bad, people do it , but not universal. If all the genes in the original set are each other orthologs, that is, their evolution fully coincides with the evolution of their owners, then it is best to do so. But this is not always the case. Take a look, for example, at the picture:
This is the evolution of chitin synthases (proteins responsible for the synthesis of chitin) from our previous article . As can be seen, the fungi proteins (Fungal class *) do not form a single treasure; instead, they are scattered around two different ends of the tree. The same thing happens with other organisms: for example, most oomycete species have one gene from each of the four oomycete treasures. Even if we take for simplicity that the treasure is only two, they still need to be taken into account.
The conditional “ten genes of fungi” should not be a dozen of the genes of one of the treasure, it should be several genes from one clade and several from another. The same is true for the other groups.
Chitin synthases have a rather complicated evolution, and for most genes the tree will be much simpler. But the complexity of the tree cannot be estimated before it is built, and therefore the universal sampling method must be able to work with such data.
Finally, the third idea. Somewhere at the beginning casually mentioned were quick and less reliable methods of phylogenetic analysis. Why not build some tree with their help, select treasures in it and not take a sample of them already? Yes, the tree will not be very accurate, but most likely it will be more or less similar to the true one. You can make a selection on the basis of such a tree, and already calculate it properly. In this form, the idea is not very practical, because “isolating treasures” is not a trivial task. I mentioned above that the treasure is actually the same as the number of nodes in the tree, and it is not known in advance which ones interest the user. But you can build on this idea.
One of the most common ways to quickly get a tree is to build a distance matrix for sequences (and there are a lot of different distance metrics for biological sequences) and on its basis build a tree with some kind of NJ or UPGMA . Of course, the construction of the distance matrix is quadratic in time and memory of the number of sequences, but unlike ML or Bayes phylogenetics, it is at least polynomial.
Even without building a tree, on the basis of the distance matrix, you can get a sample that will include as many different sequences as possible. Since the sequences in any clade are by definition more similar to each other than to other sequences, this method should cover most of the treasure. The algorithm is quite simple: we include in the sample an arbitrary sequence, for each of the remaining ones we remember the distance to it. Then we include in the sample the remaining one, for which this distance is maximal, for the others we remember the distance and to it too. Then, from the rest, choose the one with the largest minimum distance to one of the sequences in the sample, add it to the sample and memorize the distance. Repeat until the sample reaches the desired size. For similarities to the Neighbor Joining algorithm, we called this method Distant Joining. In code, it looks like this:
Or picture:
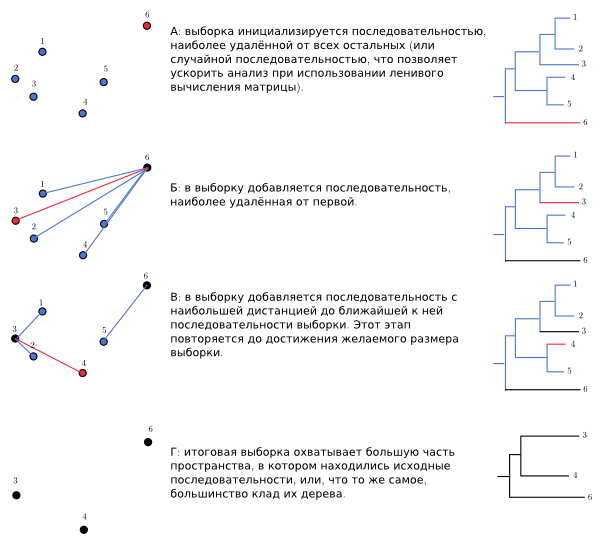
Red - added at this iteration, black - already added.
As it turned out, the described method works quite well. Here are the results on a thousand simulated sequence sets (blue - Distant Joining, black - RS, random, red - SS, the choice of how many sequences closest to a given one):

For each simulation, a tree of about a dozen or so treasure (a normal distribution with an average of 15 and a standard deviation of 5) of different sizes, from units to hundreds of sequences each, was created. According to this tree, random nucleotide sequences were generated, and then from the generated set, samples were taken from 10% to 90% of the sequences. Efficiency was estimated as the fraction of the treasure represented in the reduced sample in at least one sequence. As you can see, choosing a small number of DJ sequences is much more efficient than the other two methods.
By the way, what is this monstrously inefficient and obviously meaningless choice of n sequences closest to any one? This, of course, is not a method of reducing samples; it is a possible artifact. Roughly speaking, a request to the biological database can be formulated either as “give me 100 sequences most similar to this one”, or as “give me all the sequences that look like this at least that much”. The first formulation is useful for other tasks (and most often it is by default), but in the case of phylogenetic analysis it can lead to serious distortions in the data set.
On real data, testing can also include the taxonomy-based AST method. The results on two data sets are shown below: on the left a large set of ribosomal RNAs. This is a classic marker gene, inherited almost without any duplication or deletion and therefore widely used to study the evolution of species. On the right is a set of wood chitin synthases above.

The result is fairly predictable: in the case of rRNA, taxonomic metadata ideally describes the evolution and therefore AST bypasses other methods. But with chitin synthases he can not cope for the reasons described above. The horizontal straight line at the top is not a frame around the graph, this DJ covers all the clades even if the data set is reduced five times.
Strictly speaking, in the described algorithm there is nothing specifically biological. Yes, in this case, I used the sequence and biological metrics of the distance between them. But in the same way, it is possible to take samples from the aggregates of any objects for which there is a matrix of distances and the variety of which needs to be sampled fairly evenly.
It is only necessary to keep in mind that Distant Joining does not struggle with emissions (which it perceives as a significant diversity and is one of the first in the sample) and does not preserve the ratio of cluster sizes.
A prototype in Python 3 is available on github . If he suddenly comes in handy in scientific work, please quote this article .
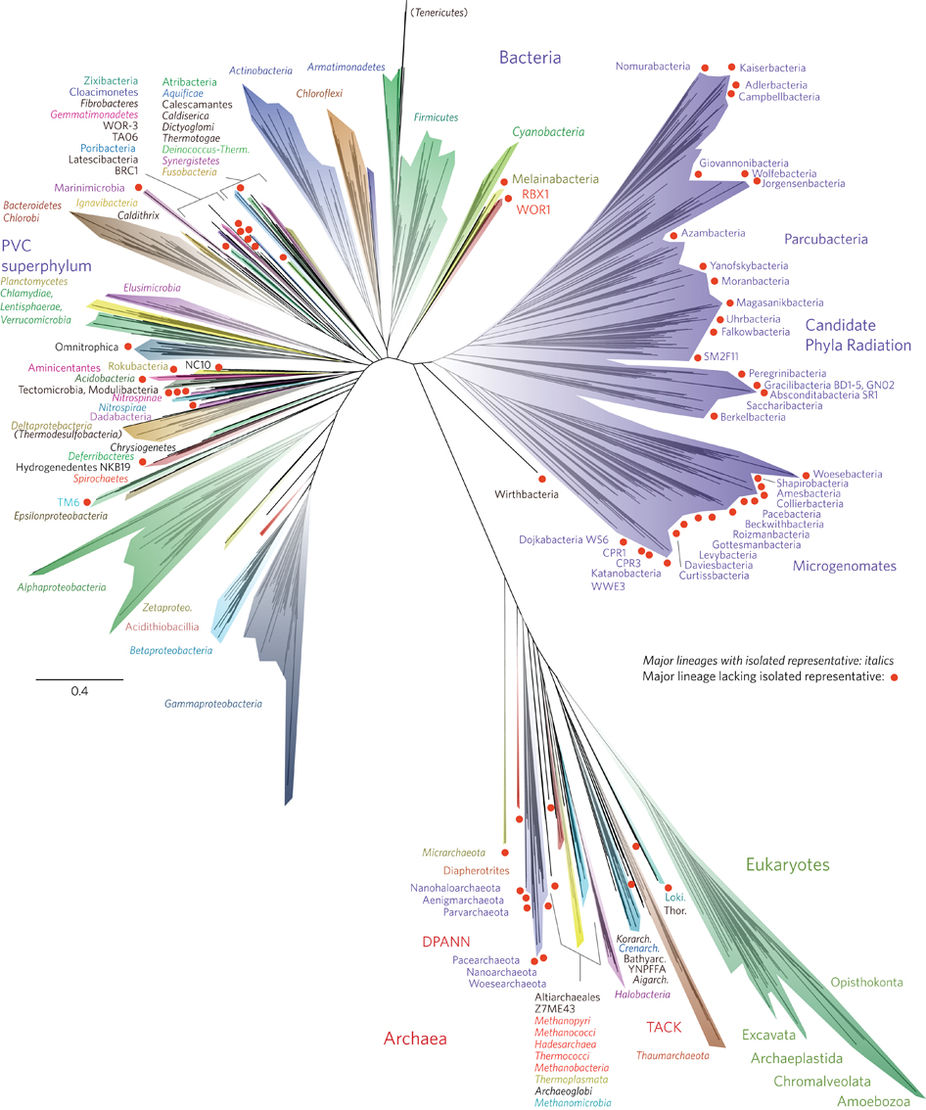
What is KDPV?
The most complete tree of life that currently exists . All multicellular life fits into a green spot in the lower right corner and makes up a rather small share of it, and all animals and mushrooms (together called Opistokonta) - in the rightmost ledge of this spot. This is approximately the diversity of life on the planet and such is the amount of data that is produced in the process of studying it.
Red circles, by the way, isolated groups of unicellular organisms that no one has ever seen. Culture does not grow in any laboratory in Petri dishes or clever bioreactors. Their existence has become known only in recent years from metagenomic studies, when all the DNA that is from the medium is isolated from the medium and analyzed all the time. But it is, by the way. The picture is included in the article solely as the most amazing tree in recent years and is not important for understanding the article.
Red circles, by the way, isolated groups of unicellular organisms that no one has ever seen. Culture does not grow in any laboratory in Petri dishes or clever bioreactors. Their existence has become known only in recent years from metagenomic studies, when all the DNA that is from the medium is isolated from the medium and analyzed all the time. But it is, by the way. The picture is included in the article solely as the most amazing tree in recent years and is not important for understanding the article.
What should be done
First of all, let us state clearly what is happening and what we are trying to achieve. We want to know where it came from and how a particular gene, say, a man, evolved. Or potatoes, or unicellular algae, the methods for any organism will be about the same. In biological databases one can find related sequences of other organisms, shove them into some kind of magic program and get a phylogenetic tree at the output. The problem is that there will probably be thousands of related sequences. And the construction of phylogenetic trees with maximum likelihood methods or Bayesian phylogenetics is an NP-complete problem and the solution consists, roughly speaking, in the search for different trees and parameters of the evolutionary model. I usually have from a couple of days to a week on 2 16-core AMD Opteron 6276 processors with 64 Gb of RAM for several hundred genes of medium length. There are also polynomial methods of phylogenetic analysis, but they are less accurate and publishing an article based on them in a decent journal will be unrealistic.
So, you need to take from this set the correct sample: select a relatively small set of sequences of a given size and draw conclusions from it about the entire set. Further, some phylogenetic terminology will be used, explanations - under the spoiler.
Basic concepts and terms
For a start, what is a phylogenetic tree? This is a binary tree describing the emergence of many modern DNA sequences or proteins from a single ancestor by successive divergences. The genes (or proteins) united by such an ancestor are homologous to each other. Even if it existed billions of years ago, there must have been a single ancestor, otherwise the entire analysis does not make sense.
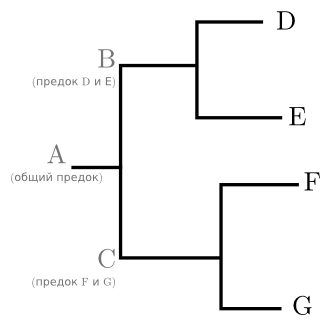
For example (picture below): once there was an ancestral gene A, which had descendants B and C. B left descendants D and E, and C - F and G. There are only four sequences D, E, F and G; ancestors from A to C existed once upon a time and have disappeared to our days. Accordingly, we can reason about them exclusively on the basis of modern sequences and mainly in terms of the type “common ancestor of such and such and such and such”. A part of a tree united by a common ancestor is called a treasure . This term can be applied both to the actual part of the graph and to the sequences at its ends. In the tree in the picture, for example, there are clades (D, E) and (F, G). Although nominally a treasure in a tree is the same as internal nodes, usually the researcher is only interested in a few treasures that are significant to his work.
One might ask: why am I talking about the evolution of sequences , although everyone is used to thinking about the evolution of species . In the end, whole organisms feed, multiply and die out, not small pieces of DNA. This is generally true. The “Tree of Life” was originally invented for species, and phylogenetic trees perfectly describe their evolution. But there are two reasons for discussing trees of sequences: first, phylogenetics as a field of bioinformatics most often deals with sequences. The evolution of organisms with a set of features is an intricate and difficult to formalize process, moreover, it took place millions of years ago under the influence of unknown factors and in general it is not very clear with whom. Disputes about what exactly the first eukaryote was, for example, are unlikely to end before the invention of the time machine. On the other hand, replacing, inserting and deleting letters in a string is quite amenable to mathematical modeling.
Secondly, the evolution of an individual gene may differ from the evolution of the species in which it is represented. The simplest scenario is described on the tree above - the common ancestor of the species studied had one copy of the gene under study, and during evolution it was simply inherited, gradually accumulating small mutations. Such genes are attributed to each other by orthologs . By definition, orthologs are genes of different species, going back to the single gene of their common ancestor.
But suppose that ancestor C had a duplication of the gene under study. There was one gene, and it became two identical, which began to be inherited and mutate independently of each other. It is likely that one of the copies of the gene continued to do the same as before, and the second (once its old function and without it has someone to perform) mutates and brings some new advantage to the mind. But the species E or one of his recent ancestors lost this gene altogether. This happens if the gene is not so vital. Although the relationships of the species have not changed, the tree will take the following form:
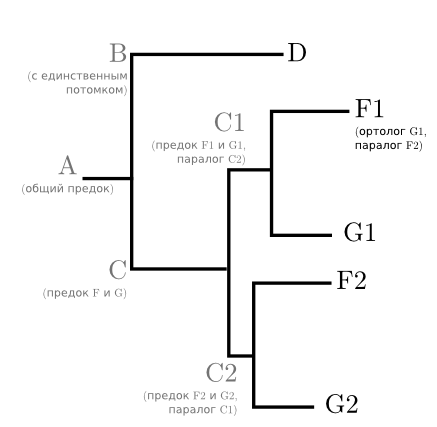
Based on this tree, it is already quite difficult to talk about the evolution of species. E is not at all, and F and G occur twice each. But it makes it possible to understand when the genes * 1 and * 2 appeared and how far they diverged. The F1 and G1 genes are parallels to each other - genes of the same species, dating back to the single gene of its ancestor.
In addition to duplications and deletions, there are other events: sometimes genes are acquired by organisms not from parents, but from other non-related organisms (called horizontal gene transfer or HGT), sometimes a piece from some other gene is added to one gene or, vice versa , a piece is cut off, sometimes several genes are combined into one. A lot of interesting things happen. So it is not known in advance what the result will be if you throw all homologous sequences into the analysis.
For example (picture below): once there was an ancestral gene A, which had descendants B and C. B left descendants D and E, and C - F and G. There are only four sequences D, E, F and G; ancestors from A to C existed once upon a time and have disappeared to our days. Accordingly, we can reason about them exclusively on the basis of modern sequences and mainly in terms of the type “common ancestor of such and such and such and such”. A part of a tree united by a common ancestor is called a treasure . This term can be applied both to the actual part of the graph and to the sequences at its ends. In the tree in the picture, for example, there are clades (D, E) and (F, G). Although nominally a treasure in a tree is the same as internal nodes, usually the researcher is only interested in a few treasures that are significant to his work.
One might ask: why am I talking about the evolution of sequences , although everyone is used to thinking about the evolution of species . In the end, whole organisms feed, multiply and die out, not small pieces of DNA. This is generally true. The “Tree of Life” was originally invented for species, and phylogenetic trees perfectly describe their evolution. But there are two reasons for discussing trees of sequences: first, phylogenetics as a field of bioinformatics most often deals with sequences. The evolution of organisms with a set of features is an intricate and difficult to formalize process, moreover, it took place millions of years ago under the influence of unknown factors and in general it is not very clear with whom. Disputes about what exactly the first eukaryote was, for example, are unlikely to end before the invention of the time machine. On the other hand, replacing, inserting and deleting letters in a string is quite amenable to mathematical modeling.
Secondly, the evolution of an individual gene may differ from the evolution of the species in which it is represented. The simplest scenario is described on the tree above - the common ancestor of the species studied had one copy of the gene under study, and during evolution it was simply inherited, gradually accumulating small mutations. Such genes are attributed to each other by orthologs . By definition, orthologs are genes of different species, going back to the single gene of their common ancestor.
But suppose that ancestor C had a duplication of the gene under study. There was one gene, and it became two identical, which began to be inherited and mutate independently of each other. It is likely that one of the copies of the gene continued to do the same as before, and the second (once its old function and without it has someone to perform) mutates and brings some new advantage to the mind. But the species E or one of his recent ancestors lost this gene altogether. This happens if the gene is not so vital. Although the relationships of the species have not changed, the tree will take the following form:
Based on this tree, it is already quite difficult to talk about the evolution of species. E is not at all, and F and G occur twice each. But it makes it possible to understand when the genes * 1 and * 2 appeared and how far they diverged. The F1 and G1 genes are parallels to each other - genes of the same species, dating back to the single gene of its ancestor.
In addition to duplications and deletions, there are other events: sometimes genes are acquired by organisms not from parents, but from other non-related organisms (called horizontal gene transfer or HGT), sometimes a piece from some other gene is added to one gene or, vice versa , a piece is cut off, sometimes several genes are combined into one. A lot of interesting things happen. So it is not known in advance what the result will be if you throw all homologous sequences into the analysis.
Let us define the “correct sample” as follows: let there be a certain number of treasure in the tree that includes all the sequences from the set. What is their biological meaning, it does not matter; the main thing is that they are mostly monophyletic (that is, they go back to a single ancestor each) and are basically separated by a more or less long branch from the rest of the tree. Each clade corresponds to a subset of its sequences. We shall assume that the correct sample is such that each of these subsets is represented in it by at least one sequence.
')
What we will not do
The most obvious idea is to take sequences at random and hope that the sample will be more or less correct. But an accident - it is an accident; may be correct, and maybe not. In practice, most likely it will not, because the biosphere is studied unevenly. A person and a number of model objects (the front sight of Drosophila, Baker's yeast, Escherichia coli E. coli , etc.) are studied in great detail and everything that can be sequenced is repeatedly sequenced for them. Economically or medically significant objects (for example, rice and HIV) and close relatives of significant objects (for example, primates as human relatives) are studied a little worse, but also very well. But single-celled plankton, no matter how diverse it may be, is of little interest to anyone and is sequenced relatively rarely. Therefore, there may well be 30 sequences of animals, 30 sequences of plants, 20 sequences of fungi, and one or two sequences of all other eukaryotic groups in a set of 100 homologous genes.
For a random sample, the ratio of the number of groups as a whole will remain. But we do not need to save it at all; it still reflects more the number of scientists involved in one or another taxon and their financing than some kind of biological reality. We need to cover as many groups as possible, including small ones.
Okay, the next idea is that since we already have taxonomic meta information (which organism has which sequence), why not use it? Take one human gene, more or less evenly take a dozen of the genes of other animals, a dozen of the genes of fungi, and so on. The idea is not bad, people do it , but not universal. If all the genes in the original set are each other orthologs, that is, their evolution fully coincides with the evolution of their owners, then it is best to do so. But this is not always the case. Take a look, for example, at the picture:
Eukaryotic chitin synthase tree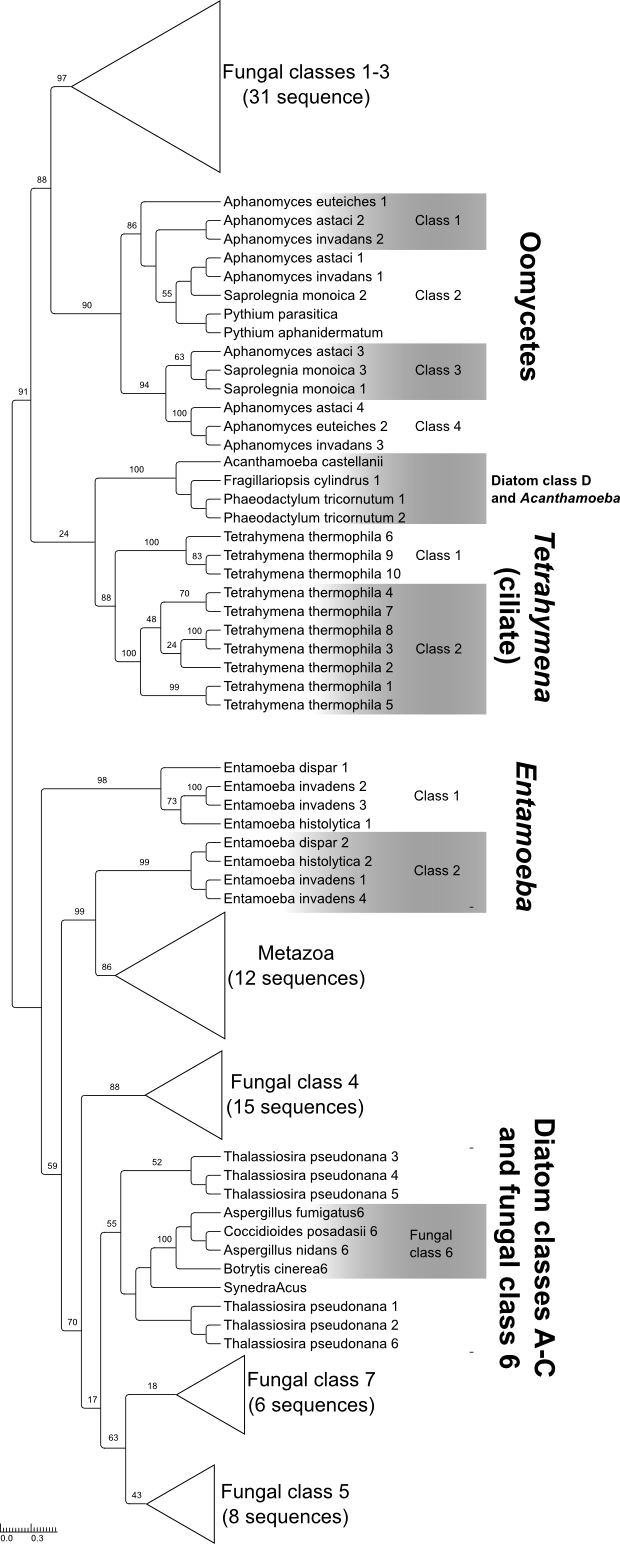
This is the evolution of chitin synthases (proteins responsible for the synthesis of chitin) from our previous article . As can be seen, the fungi proteins (Fungal class *) do not form a single treasure; instead, they are scattered around two different ends of the tree. The same thing happens with other organisms: for example, most oomycete species have one gene from each of the four oomycete treasures. Even if we take for simplicity that the treasure is only two, they still need to be taken into account.
The conditional “ten genes of fungi” should not be a dozen of the genes of one of the treasure, it should be several genes from one clade and several from another. The same is true for the other groups.
Chitin synthases have a rather complicated evolution, and for most genes the tree will be much simpler. But the complexity of the tree cannot be estimated before it is built, and therefore the universal sampling method must be able to work with such data.
Finally, the third idea. Somewhere at the beginning casually mentioned were quick and less reliable methods of phylogenetic analysis. Why not build some tree with their help, select treasures in it and not take a sample of them already? Yes, the tree will not be very accurate, but most likely it will be more or less similar to the true one. You can make a selection on the basis of such a tree, and already calculate it properly. In this form, the idea is not very practical, because “isolating treasures” is not a trivial task. I mentioned above that the treasure is actually the same as the number of nodes in the tree, and it is not known in advance which ones interest the user. But you can build on this idea.
What do we do
One of the most common ways to quickly get a tree is to build a distance matrix for sequences (and there are a lot of different distance metrics for biological sequences) and on its basis build a tree with some kind of NJ or UPGMA . Of course, the construction of the distance matrix is quadratic in time and memory of the number of sequences, but unlike ML or Bayes phylogenetics, it is at least polynomial.
Even without building a tree, on the basis of the distance matrix, you can get a sample that will include as many different sequences as possible. Since the sequences in any clade are by definition more similar to each other than to other sequences, this method should cover most of the treasure. The algorithm is quite simple: we include in the sample an arbitrary sequence, for each of the remaining ones we remember the distance to it. Then we include in the sample the remaining one, for which this distance is maximal, for the others we remember the distance and to it too. Then, from the rest, choose the one with the largest minimum distance to one of the sequences in the sample, add it to the sample and memorize the distance. Repeat until the sample reaches the desired size. For similarities to the Neighbor Joining algorithm, we called this method Distant Joining. In code, it looks like this:
leader = not_sampled[0] reduced_list.append(leader) minima = {x: dist(leader, x) for x in not_sampled[1:]} while len(reduced_list) < final_count: leader = max(minima.items(), key=lambda a: a[1]) reduced_list.append(leader[0]) del minima[leader[0]] not_sampled.remove(leader[0]) for i in not_sampled: d = self[(leader[0], i)] if d < minima[i]: minima[i] = d Or picture:
Red - added at this iteration, black - already added.
As it turned out, the described method works quite well. Here are the results on a thousand simulated sequence sets (blue - Distant Joining, black - RS, random, red - SS, the choice of how many sequences closest to a given one):
For each simulation, a tree of about a dozen or so treasure (a normal distribution with an average of 15 and a standard deviation of 5) of different sizes, from units to hundreds of sequences each, was created. According to this tree, random nucleotide sequences were generated, and then from the generated set, samples were taken from 10% to 90% of the sequences. Efficiency was estimated as the fraction of the treasure represented in the reduced sample in at least one sequence. As you can see, choosing a small number of DJ sequences is much more efficient than the other two methods.
By the way, what is this monstrously inefficient and obviously meaningless choice of n sequences closest to any one? This, of course, is not a method of reducing samples; it is a possible artifact. Roughly speaking, a request to the biological database can be formulated either as “give me 100 sequences most similar to this one”, or as “give me all the sequences that look like this at least that much”. The first formulation is useful for other tasks (and most often it is by default), but in the case of phylogenetic analysis it can lead to serious distortions in the data set.
On real data, testing can also include the taxonomy-based AST method. The results on two data sets are shown below: on the left a large set of ribosomal RNAs. This is a classic marker gene, inherited almost without any duplication or deletion and therefore widely used to study the evolution of species. On the right is a set of wood chitin synthases above.
The result is fairly predictable: in the case of rRNA, taxonomic metadata ideally describes the evolution and therefore AST bypasses other methods. But with chitin synthases he can not cope for the reasons described above. The horizontal straight line at the top is not a frame around the graph, this DJ covers all the clades even if the data set is reduced five times.
Conclusion
Strictly speaking, in the described algorithm there is nothing specifically biological. Yes, in this case, I used the sequence and biological metrics of the distance between them. But in the same way, it is possible to take samples from the aggregates of any objects for which there is a matrix of distances and the variety of which needs to be sampled fairly evenly.
It is only necessary to keep in mind that Distant Joining does not struggle with emissions (which it perceives as a significant diversity and is one of the first in the sample) and does not preserve the ratio of cluster sizes.
A prototype in Python 3 is available on github . If he suddenly comes in handy in scientific work, please quote this article .
Source: https://habr.com/ru/post/351324/
All Articles