Own game analytics for $ 300 per month

There are many products on the market that are suitable for game analytics: Mixpanel, Localytics, Flurry, devtodev, deltaDNA, GameAnalytics. But still many game studios are building their decision.
I have worked and work with many gaming companies. I noticed that as projects grow, studios need advanced analytics scenarios. After several gaming companies became interested in this approach, it was decided to document it in a series of two articles.
Answers to the questions "Why?", "How to do it?" and how much does it cost?" You will find under the cut.
Why?
Universal harvester is good for simple tasks. But if you need to do something more complicated, its capabilities are not enough. For example, the aforementioned analytics systems, in varying degrees, have limitations in the functional:
- on the number of parameters in the event
- on the number of parameters in the funnel events
- to update frequency
- on the amount of data
- for the period of calculation of data
- on the number of funnel conditions
- and other restrictions of the same kind
Turnkey solutions do not give access to raw data. For example, if you need to conduct a more detailed study. We should not forget about machine learning and predictive analytics. With a significant amount of analytical data, you can play around with machine learning scenarios: predicting user behavior, recommending purchases, personalized offers, etc.
Game studios often build their own solutions not to replace, but in addition to the existing ones.
So, what does your analytics system look like?
A common approach when building analytics is lambda architecture , the analytics is divided into “hot” and “cold” ways. The hot path is the data that must be processed with a minimum delay (the number of players online, payments, etc.).
The cold path is the data that is processed periodically (reports for the day / month / year), as well as raw data for long-term storage.

For example, this is useful when launching marketing campaigns. It is convenient to see how many users came from the campaigns, how many of them made the payment. This will help to disable ineffective advertising channels as quickly as possible. Given the marketing budgets of games, it can save a lot of money.
Everything else belongs to the cold path: periodic cuts, custom reports, etc.
Lack of flexibility of the universal system, just, and pushes to develop their own solutions. As the game evolves, the need for a detailed analysis of user behavior increases. No universal analytics system can compare with the ability to build SQL queries on data.
Therefore, studios are developing their own solutions. Moreover, the solution is often sharpened for a specific project.
The studios that developed their system were unhappy that it had to be constantly maintained and optimized. After all, if there are many projects, or they are very large, the amount of data collected is growing very quickly. Its system begins to slow down more and require significant investments in optimization.
How?
Technical risks
The development of an analytics system is not an easy task.
Below is an example of the requirements from the studio that I was targeting.
- Storage of large amounts of data:> 3Tb
- High service load: from 1000 events per second
- Query language support (preferably SQL)
- Ensuring an acceptable request processing rate: <10 min
- Infrastructure resiliency
- Providing data visualization tools
- Aggregation of regular reports
This is not a complete list.
When I wondered how to make a decision, I was guided by the following priorities / Wishlist:
- quickly
- cheap
- reliably
- SQL support
- possibility of horizontal scaling
- effective work with at least 3Tb data, again scaling
- the ability to process data real time
Since the activity in games is periodic, the solution should ideally adapt to the peaks of the load. For example, during featureing, the load increases many times.
Take, for example, Playerunknown's Battleground. We will see clearly defined peaks during the day.

Source: SteamDB
And if you look at the growth of Daily Active Users (DAU) over the course of a year, you can see a rather fast pace.

Source: SteamDB
Despite the fact that the game is a hit, I have seen similar growth charts in regular projects. During the month, the number of users increased from 2 to 5 times.
You need a solution that is easy to scale, but you don’t want to pay for pre-reserved capacity, but add them as the load increases.
SQL based solution
The solution to the forehead is to take some SQL database, send all the data there in raw form. Out of the box solves the problem of the query language.
Directly, data from gaming clients cannot be sent to the repository, so a separate service is needed, which will deal with buffering events from clients and sending them to the database.
In this scheme, analysts should directly send requests to the database, which is fraught. If the query is heavy, the database can get up. Therefore, we need a replica database purely for analysts.
An example of the architecture below.
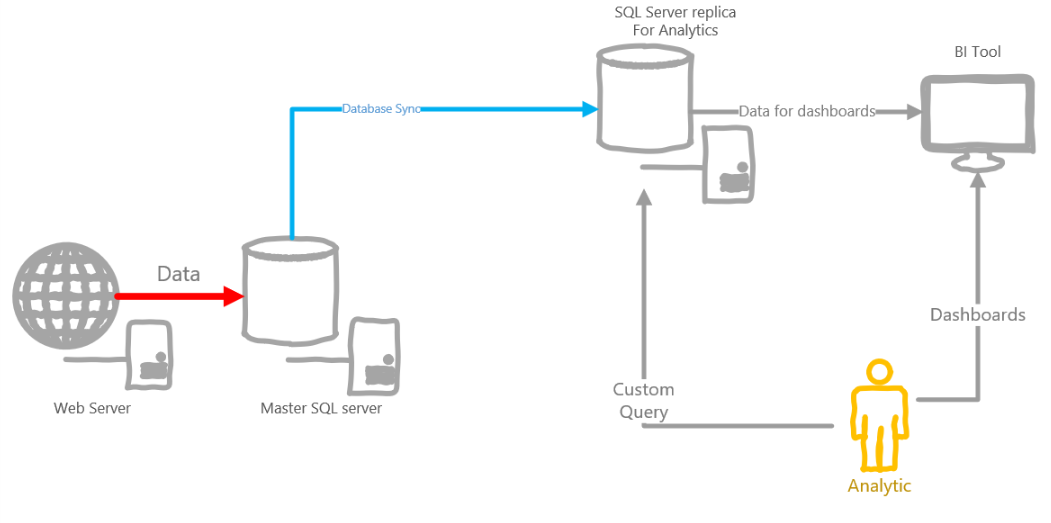
This architecture has several disadvantages:
- You can forget about real-time data.
- SQL is a powerful tool, but event data often does not fall on the relational schema, so you have to invent crutches, such as p0-p100500 parameters for events
- Given the amount of analytical data collected per day, the size of the database will grow by leaps and bounds, you need to partition, etc.
- The analyst can give birth to a request that will be executed for several hours, or maybe even a day, thereby blocking other users. Do not give everyone their own replica of the database?
- If SQL is on-prem, you will need to constantly take care of fault tolerance, sufficient free space, and so on. If in the cloud - can fly into a pretty penny
Apache Stack Solution
Here the stack is quite large: Hadoop, Spark, Hive, NiFi, Kafka, Storm, etc.
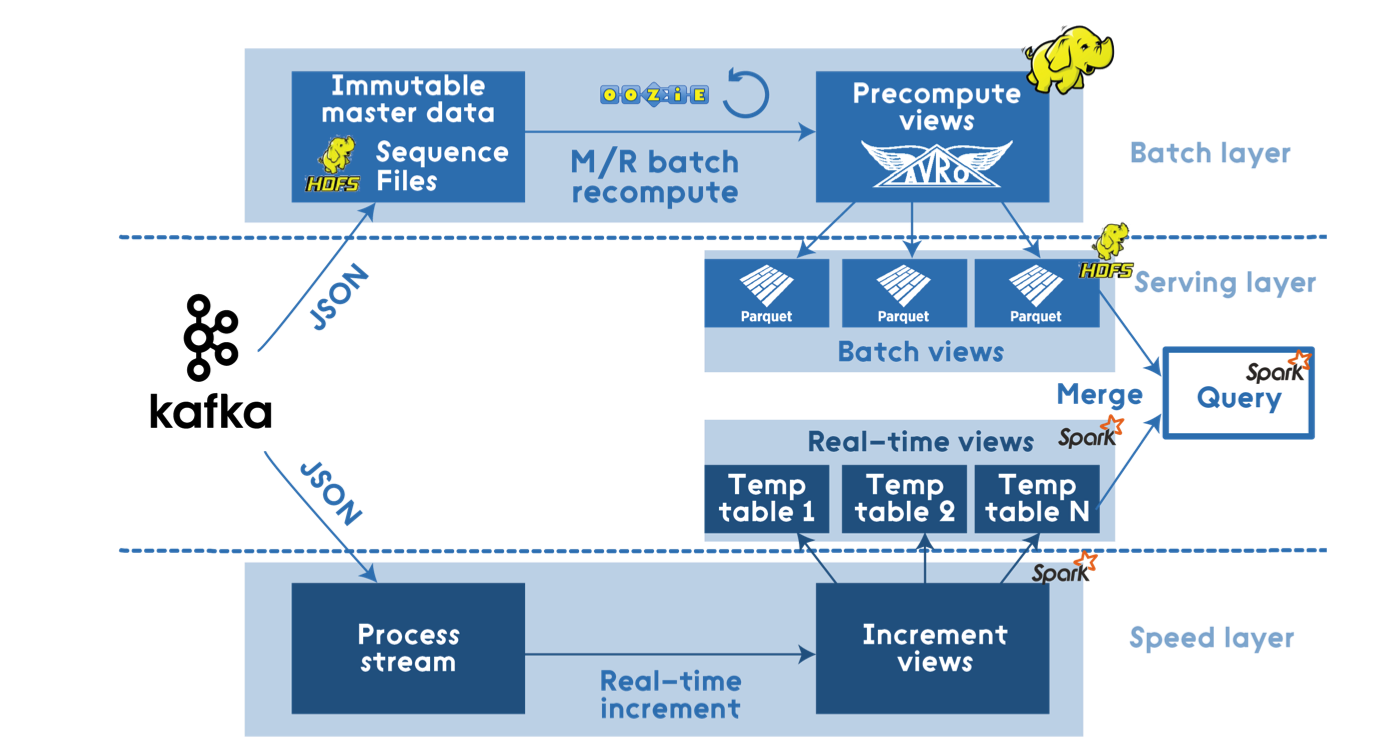
Source: dzone.com
Such architecture will precisely cope with any loads and will be as flexible as possible. This is a complete solution that will allow you to process data in real time, and build furious queries on cold data.
But, in fact, the load specified in the requirements is difficult to call BigData, they can be counted on a single node. Therefore, Hadoop-based solutions are an obvious overkill.
You can start with Spark Standalone, it will be much easier and cheaper.
For receiving and preprocessing events, I would prefer Apache NiFi instead of Spark.
Cluster management can greatly simplify Kubernetes on AKS .
Pros :
- The most flexible solution, data handlers can be written as pure code, and use Spark SQL
- Open Source stack, big community
- Good scalability, you can always throw everything on Hadoop
Cons :
- Managing and maintaining the infrastructure manually, although it can be simplified with AKS
- Virtualka billing is not very profitable if they are idle most of the time.
- Ensuring the resiliency of the solution is not an easy task, which also needs to be addressed by yourself.
- Since requests are written by code - not everyone is suitable, everyone is used to SQL, the code can not be mastered
Cloud Platform Solution
Azure Event Hubs
Azure Event Hubs is the simplest high-throughput event hub. From cloud platforms - the most suitable option for receiving large volumes of analytics from clients.
Pros :
- Autoscale
- Guaranteed reliability and fault tolerance
- Pretty low price
Cons :
- Scanty event / queue management capabilities
- No duplicate message tracking mechanisms
- Auto scaling up only
HDInsight
HDInsight is a platform that allows you to deploy a ready-to-use Hadoop cluster, with certain products like Spark. You can fold it away immediately, since it is an obvious search for such volumes of data, and it is very expensive.
Azure databricks
Azure Databricks is such a Spark on steroids in the cloud. Databricks is a product from Spark authors. A comparison of the two products can be found here . From the buns that I personally liked:
- Support for multiple versions of Spark
- Complex solution, can work with stream of events
- Faster than vanilla Spark, due to various optimizations (data skipping, auto caching)
- Nice web-interface, honed under the teamwork
- Interactive notepads with support for SQL, Python, R, Scala
- Real Time Collaboration
- Notebook versioning, github integration
- Publishing notebooks as interactive dashboards
- Native support for cloud storage
- All buns clouds:
- Easy scaling
- Billing for the cluster, but with autoscaling and auto-terminate
- Job system that creates and kills an on-demand cluster
Pros :
- Autoscale
- No need to maintain infrastructure
- Convenient buns for analytics in the form of interactive Notebooks
- Flexible minute billing for the actual computing time
Cons :
- Inconvenient job debug
- Lack of local emulator for job debugging
Azure Data Lake Analytics (ADLA)
Azure Data Lake Analytics is a cloud platform from Microsoft, which is in many ways similar to Databricks.
Billing is about the same, but a little more understandable, in my opinion. There is no cluster concept at all, there is no concept of node and its size. There is an abstract Analytics Unit (AU). We can say that 1 AU = hour of work of one abstract node.
Since ADLA is a Microsoft product, it is better integrated into the ecosystem. For example, jobs for ADLA can be written both in the Azure portal and in Visual Studio. There is a local emulator ADLA, you can debug the job on your machine before running on big data. Normal debugging of custom C # code is supported, with breakpoint.
With job parallelization, the approach is slightly different than in databricks. Since there is no cluster concept, when running a job, you can specify the number of allocated AUs. Thus, you yourself can choose how much the job should parallel.
Among the cool features - a detailed job'a plan. Shows how much and what data was processed, how much processing took at each stage. This is a powerful tool for optimization and debugging.
The main job language is U-SQL. As for the custom code - there is no choice, only C #. But many see this as an advantage.
Pros :
- Scaling at job level
- Convenient U-SQL
- Good integration with Microsoft's ecosystem of products, including Azure services
- Convenient job debugging on a local machine
- Delatal job plans
- The ability to work through the portal Azure
Cons :
- Can not handle stream of events, for this you need a separate solution
- No interactive collaboration tools like Azure Databricks
- Only one language for custom code
- Additional tools are needed to set up timer processing.
Azure Stream Analytics
Cloud platform for streaming events. Pretty handy thing. Out of the box has a tool for debugging / testing directly in the portal. Talking in T-SQL dialect. It supports different types of windows for aggregation. Able to work with many data sources as input and output.
In spite of all the advantages, it is hardly suitable for something complex. Stay either in performance or in cost.
The functional due to which it is worth considering is integration with PowerBI, which allows you to set up real-time statistics in a couple of clicks.
Pros:
- Scaling
- Integration with all cloud services out of the box
- T-SQL support
- Convenient debugging of requests
Minuses:
- You cannot scale without shutting down the job
- There are no tools for breeding job'a between prod / dev scripts
- High price
- Poor performance with heavy queries like DISTINCT
Hybrid solution
No one forbids combining cloud platforms and OSS solutions. For example, instead of Apache Kafka / NiFi, you can use Azure Event Hubs if there is no additional logic for event transformation.
For everything else, you can leave Apache Spark, for example.
Specific Numbers
With the possibilities figured out, now about the price. Below is an example of the calculation that I did for one of the studios.
I used the Azure Pricing Calculator to calculate the cost.
I calculated prices for working with cold data in the West Europe region.
For simplicity, I only considered compute power. I did not take into account the repository, since its size strongly depends on the specific project.
At this stage, I have included in the table prices for buffer systems only for comparison. There are prices for minimum clusters / sizes from which to start.
Apache Stack Cost on Bare VM
| Decision | Price |
|---|---|
| Spark | $ 204 |
| Kafka | $ 219 |
| Total | $ 433 |
Cost of platform solution based on ADLA
| Decision | Price |
|---|---|
| Azure Data Lake Analytics | $ 108 |
| Azure Event Hubs | $ 11 |
| Total | $ 119 |
Cost of a platform solution based on Azure Databricks
| Decision | Price |
|---|---|
| Azure databriks | $ 292 |
| Azure Event Hubs | $ 11 |
| Total | $ 303 |
More details on calculations
Kafka on Bare VMs
In order to provide a more or less reliable solution, you need at least 3 nodes:
1 x Zookeeper (Standard A1) = $43.8 / month2 x Kafka Nodes (Standard A2) = $175.2 / monthTotal: $219
For the sake of fairness, it is worth noting that such a Kafka configuration will pull a much larger bandwidth than is needed in the requirements. Therefore, Kafka can be more profitable if you need higher bandwidth.
Spark on Bare VMs
I think the minimum configuration is worth talking about: 4 vCPU, 14GB RAM.
From the cheapest VM I chose Standard D3v2.
1 x Standard D3v2 = $203.67 / month
Azure databricks
Databricks has two types of clusters: Standard and Serverless (beta).
Standard cluster in Azure Databricks includes at least 2 nodes:
- Driver - hosts notepads and processes requests related to them, as well as being a Spark Master and supporting SparkContext.
- Worker - actually, a worker who handles all requests
Honestly, I do not know what is meant by serverless, but what I noticed about this type is:
- All the same, choose the type of worker node, their number (from and to)
- Serverless creates nodes right in a subscription, in a separate resource group.
- Auto terminate feature is missing
- Supports only R / Python / SQL queries.
- Includes at least 2 nodes
Databricks also includes two shooting galleries, Premium has several of its own features, such as access control on notebooks. But I considered the minimum Standard.
Considering in the calculator, I came across one interesting point - the Driver node is missing there. Since the minimum size of any cluster, as a result, 2 nodes, the cost in the calculator is not complete. Therefore, I counted pens.
Databricks itself is billed for DBU - computational power. Each type of node has its DBU ratio per hour.
For a worker, I took the minimum DSv2 (\ $ 0.272 / hour), it corresponds to 0.75 DBU.
For the driver, I took the cheapest F4 instance (\ $ 0.227 / hour), it corresponds to 0.5 DBU.
DSv2 = ($0.272 + $0.2 * 0.75 DBU ) * 730 = $308.06 F4 = ($0.227 + $0.2 * 0.75 DBU ) * 730 = $275.21 Total: $583.27 This is a calculation based on the work of this small cluster 24/7. But in fact, thanks to the possibilities of auto-terminate, this figure can be significantly reduced. The minimum idle-timeout for the cluster is 10 minutes.
If we take the axiom that 12 hours a day are working with the cluster (full-time, taking into account floating hours), then the cost will already be $583 * 0.5 = $291.5 .
If analysts do not dispose of the cluster 100% of the working time, then the figure may be even less.
Azure Data Lake Analytics
Price in Europe \ $ 2 per Analytics Unit per hour.
Analytics Unit - in fact, one node. $ 2 / hour for a node is a little expensive, but it’s billed every minute. Usually Job takes at least a minute.
If Job is large, then you need more AU to parallelize it.
Then I realized that it’s not very good to poke a finger into the sky. Therefore, previously conducted a small test. I generated json files of 100 MB each, only 1 GB, put them into the store, launched a simple query in Azure Data Lake Analytics for data aggregation and looked at how long it would take to process 1 GB. I got 0.09 AU / h.
Now you can roughly calculate how much data processing will cost. Suppose that per month we have accumulated 600 GB of data. We must process all this data at least once.
600 * 0.09AU * $2 = $108
These are fairly rough calculations of the minimum configuration for analytics.
Brief summary
The solution based on SQL database does not have sufficient flexibility and performance.
The Apache Stack-based solution is very strong and flexible, although expensive for the stated requirements. Plus requires cluster support handles. This is Open Source, so vendor lock'a can not be afraid. Plus, the Apache Stack can cover two tasks at once, processing cold and hot data, which is a plus.
If you are not afraid of administrative difficulties, then this is the perfect solution.
If you are constantly working with analytics, with large volumes, then having your own cluster can be a more profitable solution.
There are several solutions among cloud platforms.
For event buffering - EventHub. With small volumes it turns out cheaper Kafka.
For processing cold data - two suitable options:
- Azure Databricks (Preview) is a cool tool with interactive notebooks and built-in Spark. It can handle both hot and cold data. Not very expensive, support for many languages, cluster auto-management, and many more goodies.
- Azure Data Lake Analytics - does not have a cluster, job-level parallelization, good integration with Visual Studio, convenient debugging tools, billing by the minute
If there are no resources to support the infrastructure, as well as a fairly cheap start is needed, then these options will be very attractive.
Azure Databricks can be a cheaper option if jobs are running continuously and in large quantities.
Having offered the designated options to several studios, many became interested in platform solutions. They can be fairly painlessly integrated into existing processes and systems, without unnecessary administrative effort.
Below, I review a detailed overview of the architecture based on the Azure Data Lake Analytics platform solution.
Game analytics on Azure Event Hub / Azure Data / Azure Data Factory / Azure Data Analytics / Azure Stream Analytics / Power BI
Architecture
Having estimated the pros and cons, I took up the implementation of lambda architecture on Azure. It looks like this:
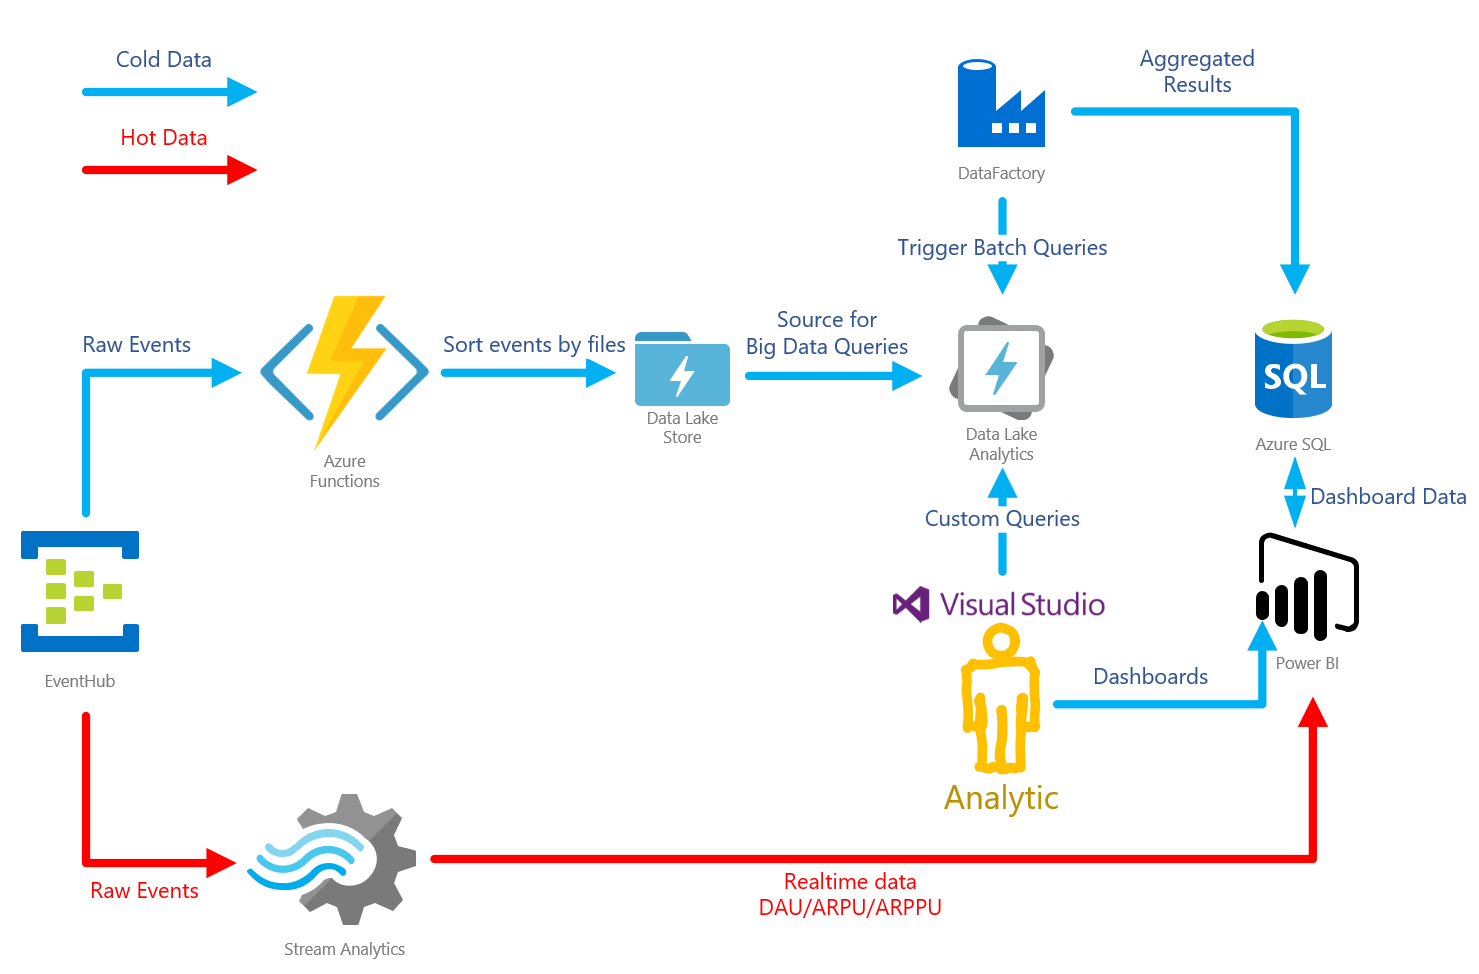
Azure Event Hub is a queue, a buffer that can receive a huge number of messages. There is also a nice feature of writing raw data to the storage. In this case, Azure Data Lake Storage (ADLS).
Azure Data Lake Store is a repository based on HDFS. Used in conjunction with the Azure Data Lake Analytics service.
Azure Data Lake Analytics - analytics service. Allows you to build U-SQL queries to the data lying in different sources. The fastest source is ADLS. In particularly difficult cases, you can write custom code for queries in C #. There is a handy toolset in Visual Studio, with detailed query profiling.
Azure Stream Analytics is a service for processing data flow. In this case, it is used to aggregate "hot" data and transfer it for visualization in PowerB
Azure Functions is a service for hosting serverless applications. This architecture is used for "custom" processing of the event queue.
Azure Data Factory is a rather controversial tool. Allows you to organize data pipelines. In this particular architecture, it is used to run batchy. That is, it runs queries in the ADLA, calculating slices for a certain time.
PowerBI is a business analytics tool. Used to organize all dashboards on the game. Able to display realtime data.
The same solution, but in a different perspective.
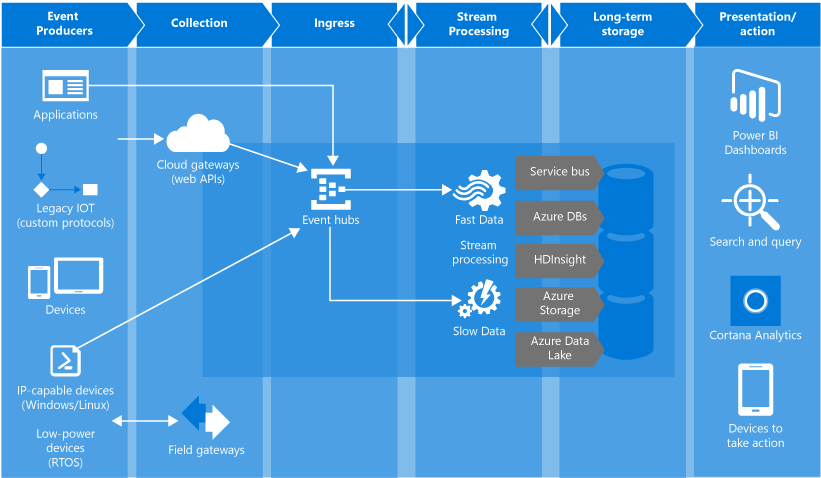
Here you can clearly see that in the Event Hubs, clients can both directly and through API Gateway. Similarly, in the Event Hubs, you can throw and server analytics.
Event queue handling
Cold data
After entering the EventHub, events take two paths: cold and hot. The cold road leads to the ADLS repository. There are several options for saving events.
EventHub's Capture
The easiest way is to use the Capture feature of EventHub. It allows you to automatically save the raw data entering the hub in one of the storages: Azure Storage or ADLS. The feature allows you to customize the file naming pattern, although it is very limited.
Although the feature is useful, it is not suitable in all cases. For example, it did not suit me, since the time used in the file pattern corresponds to the arrival time of an event in the EventHub.
In fact, in games, events can be accumulated by customers, and then sent in bundles. In this case, the events will get into the wrong file.
The organization of the data in the file structure is very important for the effectiveness of the ADLA. The overhead of opening / closing a file is quite large, so ADLA will be most effective when working with large files. Experimentally, I found the optimal size - from 30 to 50 MB. Depending on the load, it may be necessary to split files by day / hour.
Another reason is the lack of the ability to decompose events into folders, depending on the type of the event itself. When it comes to analytics, queries will have to be as efficient as possible. The best way to filter unnecessary data is to not read the files at all.
If events are mixed within the file by type (for example, authorization events and economic events), then some of the computing power of the analytics will be spent on discarding unnecessary data.
Pros:
- Quickly set up
- It just works without any problems.
- Cheap
Minuses:
- Supports only AVRO format when saving events to storage
- It has quite limited file naming capabilities.
Stream Analytics (Cold Data)
Stream Analytics allows you to write SQL-like queries to the stream of events. There is support for EventHub'a as a data source and ADLS as output. Thanks to these requests, already transformed / aggregated data can be added to the storage.
Similarly, it has scant file naming capabilities.
Pros:
- Quick and easy setup
- Supports multiple formats for I / O events
Minuses:
- It has quite limited file naming capabilities.
- High price
- Lack of dynamic scaling
Azure Functions (Cold Data)
The most flexible solution. In Azure Functions there is a binding for the EventHub, and do not bother with the analysis of the queue. Azure Functions are also automatically colored.
It was on this decision that I stopped, since I was able to place events in folders corresponding to the time when the event was generated, and not its arrival. Also, the events themselves could be scattered in folders, according to the type of event.
There are two options for billing:
- Consumption Plan - trash serverless, pay for the used memory per second. Under heavy loads can be expensive
- App Service Plan - in this embodiment, Azure Functions has a server, its type can be selected, up to free, there is the possibility of autoscaling. This option in my case turned out to be cheaper.
Pros:
- Raw File Naming Flexibility
- Dynamic scaling
- There is a built-in integration with EventHub
- Low cost solution, with correctly selected billing
Minuses:
- It is necessary to write custom code
Hot data
Stream Analytics (Hot Data)
Again, Stream Analytics is the easiest solution to aggregate hot data. The pros and cons are about the same as for the cold road. The main advantage of Stream Analytics is integration with PowerBI. Hot data can be shipped in "real" time.
Pros:
- Quick and easy setup
- It has many conclusions, including SQL, Blob Storage, PowerBI
Minuses:
- The submobility T-SQL used in Stream Analytics still has its limitations, for solving some problems you can rest on the limits
- Price
- Lack of dynamic scaling
Azure Functions (Hot Data)
All the same as in cold data. I will not describe in detail.
Pros:
- Fully custom logic
- Dynamic scaling
- Integrated EventHub Integration
- Low cost solution, with correctly selected billing
Minuses:
- It is necessary to write custom code
- Since stateless functions, separate state storage is needed
We consider the price of a complete solution.
So, the calculation for the load is 1000 events per second.
| Decision | Price |
|---|---|
| Azure EventHub | $ 10.95 |
| Azure Stream Analytics | $ 80.30 |
| Azure functions | $ 73.00 |
| Azure Data Lake Store | $ 26.29 |
| Azure Data Lake Analytics | $ 108.00 |
In most cases, Stream Analytics may not be needed, so the total will be from $ 217 to $ 297.
Now, about how I thought. The cost of Azure Data Lake Analytics I took from the calculations above.
Calculate Azure Event Hub
Azure Event Hub - bills for every million messages, as well as for bandwidth per second.
The capacity of one throughput unit (TU) is 1000 events / s or 1MB / s, whichever comes first.
We count for 1000 messages per second, that is, 1 TUs are needed. Price for TU at the time of writing $0.015 for Basic shooting. It is believed that in the month of 730 hours.
1 TU * $0.015 * 730 = $10.95
We count the number of messages per month, taking into account the same load during the month (ha! This does not happen):
1000 * 3600 * 730 = 2 628 000 000
We consider the price for the number of incoming events. For Western Europe, at the time of this writing, the price was $0.028 per million events:
2 628 000 000 / 1 000 000 * $0.028 = $73.584
Total $10.95 + $73.584 = $84.534 .
Something comes out a lot. Given that the events are usually quite small - it is not profitable.
It is necessary for the client to write an algorithm for packing several events into one (most often they do this). This will not only reduce the number of events, but also reduce the number of required TUs with a further increase in load .
I took the unloading of real events from the existing system and counted the average size - 0.24KB. The maximum allowable event size in an EventHub is 256KB. Thus, we can pack approximately 1000 events into one.
But there is a subtle point: even though the maximum size of the event and 256KB, they are multiplied in multiples of 64KB . That is, the maximum packed message will be counted as 4 events.
We recalculate taking into account this optimization.
$73.584 / 1000 * 4 = $0.294
Now this is much better. Now let's calculate what bandwidth we need.
1000 events per second / 1000 events in batch * 256KB = 256KB/s
This calculation shows another important feature. Without a batching event, you would need 2.5MB / s, which would require 3TU. And we thought that only 1TU was needed, because we send 1000 events per second. But the bandwidth limit would have come sooner.
In any case, we can keep within 1 TU instead of 3! And the calculations can not be changed.
We consider the price for TU.
Total we get $10.95 + $0.294 = $11.244 .
Compare with the price excluding the package of events: (1 - $11.244 / $84.534) * 100 = 86.7% .
86% more profitable!
Event packaging must be considered when implementing this architecture.
Calculation Azure Data Lake Store
So, let's estimate the approximate growth order of the storage size. We have already calculated that with a load of 1000 events per second, we get 256KB / s.256 * 3600 * 730 = 657 000 M = 641
This is a pretty big number. Most likely 1000 events per second will be only part of the time of day, but nevertheless, it is worthwhile to calculate the worst variant.
641 * $0.04 = $25.64
Another ADLS is billed for every 10,000 file transactions. Transactions is any action with a file: read, write, delete. Fortunately, the removal is free =).
Let's calculate what we are worth only the data record. We will use the previous calculations, we collect 2,628,000,000 events per month, but we pack 1,000 of them into one event, therefore 2,628,000 events.
2 628 000 / 10000 * $0.05 = $13.14
Something is not very expensive, but can be reduced if you record 1000 events in batches. Packaging should be done at the client application level, and batch records at the event processing level from the EventHub.
$13.14 / 1000 = $0.0134
Now this is not bad. But again, you need to consider the batching when parsing the EventHub queue.
Total $26.28 + $0.0134 = $26.2934
Calculate Azure Functions
Using Azure Functions is possible for both cold and hot paths. Similarly, they can be deployed as one application, or separately.
I will consider the easiest option when they are spinning as one application.
So, we have a load of 1000 events per second. This is not very much, but not a little. Earlier, I said that Azure Functions can handle events in batches, and this is done more efficiently than processing events separately.
If you take the size of a batch of 1000 events, then the load becomes 1000 / 1000 = 1 . What a ridiculous figure.
Therefore, you can deploy everything into one application, and such a load will be pulled by one minimum instance S1. Its cost is $ 73. You can, of course, take B1, it is even cheaper, but I would be reinsured, and would stop at S1.
Stream Analytics calculation
Stream Analytics is only needed for advanced real-time scenarios when you need sliding window mechanics. This is a rather rare scenario for games, since the main statistics are calculated on the basis of the window per day, and are reset when the next day arrives.
If you need Stream Analytics, the guidelines recommend starting with a size of 6 Streaming Units (SUs), which is equal to one selected node. Next, you need to look at the workload, and scale SUs accordingly.
In my experience, if the queries do not include DISTINCT, or the window is rather small (an hour), one SU is enough.
1 SU * $0.110 * 730 hours = $80.3
Results
The existing solutions offered on the market are quite powerful. But they are still not enough for advanced tasks, they always have either performance limits or restrictions on customization. And even the average games begin to abut pretty quickly. This prompts to develop your own solution.
Having faced the choice of a stack of technologies, I estimated the price. The Apache stack is capable of handling all tasks and workloads, but they need to be managed manually. If you can not easily scale it, then it is very expensive, especially if the machines are not 100% loaded 24/7. Plus, if you are not familiar with the stack, such a solution is not suitable for a cheap and quick start.
If you don’t want to invest in infrastructure development and support, you need to look towards cloud platforms. Game analytics requires mainly periodic calculations. Once a day, for example. Therefore, the ability to pay only for what you use - just to the point.
The cheapest and fastest start will give a solution based on ADLA. A richer and more flexible solution - Azure Databricks.
There may also be hybrid options.
Those studios we worked with preferred cloud solutions as the easiest option to integrate into existing processes and systems.
When using cloud services, you need to be very careful when building a solution. It is necessary to study the principles of pricing and take into account the necessary optimization to reduce cost.
As a result, calculations show that for 1000 requests per second, which is an average, a custom analytics system can be obtained for $ 300 per month. Which is pretty cheap. At the same time, there is no need to invest anything in the development of your solution. What is interesting is that the variant with ADLA, unlike other solutions, when idle does not consume any money at all. Therefore, it is very interesting for dev & test scripts.
In the following articles I will talk in detail about the technical aspects of implementation.
In the same place I will tell about unpleasant moments. For example, Azure Stream Analytics for gaming scenarios did not perform well. Many queries are tied to the DAU, and its calculation requires the calculation of the unique using DISTINCT. It killed productivity, and poured out in kopek. Solved the problem with simple code on Azure Functions + Redis.
I like, I want, I want, I want
— Microsoft, . , , . .
, , , , , . . .
, , .
')
Source: https://habr.com/ru/post/351206/
All Articles