Development of high-loaded WebSocket-service
How to create a web service that will interact with users in real time, while maintaining several hundred thousand connections at the same time?
Hello everyone, my name is Andrey Klyuev, I am a developer. Recently, I was faced with such a task - to create an interactive service where the user can receive quick bonuses for their actions. The case was complicated by the fact that the project had rather high demands on the load, and the deadlines were extremely small.
In this article, I will tell you how I chose a solution for implementing a websocket server for the complex project requirements, what problems I encountered during the development process, and also say a few words about how the Linux kernel configuration can help in achieving the above goals.
')
At the end of the article are useful links to development tools, testing and monitoring.
The implementation period is 1 month.
Having compared the tasks and requirements of the project, I came to the conclusion that for its development it is more expedient to use the WebSocket technology. It provides a permanent connection to the server, eliminating the overhead from a new connection with each message that is present in the implementation on ajax and long-polling technologies. This allows you to get the necessary high rate of messaging in combination with adequate resource consumption, which is very important for high loads.
Also, due to the fact that the installation and disconnection are two clear events, it is possible to track the user’s time on the site with high accuracy.
Given the relatively limited time frame of the project, I decided to develop using the WebSocket framework. I studied several options, the most interesting of which seemed to me PHP ReactPHP, PHP Ratchet, Node.JS websockets / ws, PHP Swoole, PHP Workerman, Go Gorilla, Elixir Phoenix. Their capacity in terms of load tested on a laptop with an Intel Core i5 processor and 4 GB of RAM (these resources were quite enough for research).
PHP Workerman is an asynchronous event-oriented framework. Its capabilities are limited to the simplest implementation of a websocket server and the ability to work with the libevent library needed to handle asynchronous event notifications. The code is at the level of PHP 5.3 and does not meet any standards. For me, the main disadvantage was that the framework does not allow to implement high-load projects. On the test bench, the developed application of the “Hello World” level was unable to keep thousands of connections.
ReactPHP and Ratchet are generally comparable in their capabilities to Workerman. Ratchet inside depends on ReactPHP, it also works through libevent and does not allow creating a solution for high loads.
Swoole - an interesting framework written in C, connects as an extension for PHP, has the means for parallel programming. Unfortunately, I found that the framework is not stable enough: on the test bench, it broke off every second connection.
Next, I looked at Node.JS WS . This framework showed quite good results - about 5 thousand connections on a test bench without additional settings. However, my project meant significantly higher loads, so I opted for the Go Gorilla + Echo Framework and Elixir Phoenix frameworks. These options have been tested in more detail.
Tools such as artillery, gatling and the flood.io service were used for testing.
The purpose of the test was to study the consumption of processor and memory resources. Characteristics of the machine were the same - Intel iCore processor 5 and 4 GB of RAM. Tests were conducted on the example of the simplest chats on Go and Phoenix:
Here is a simple chat application that functioned normally on a specified power machine with a load of 25-30 thousand users:
Test runs showed that everything works quietly on a machine of the specified power with a load of 25-30 thousand users.
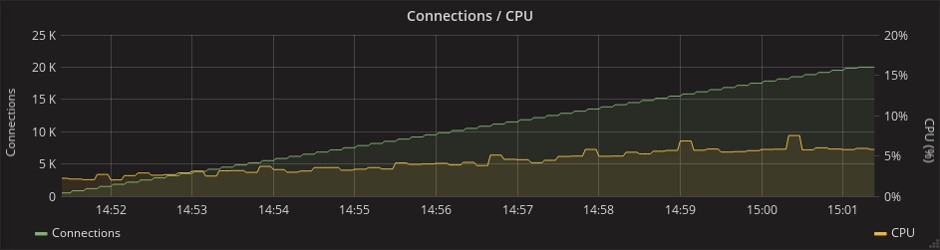
CPU consumption:
Phoenix
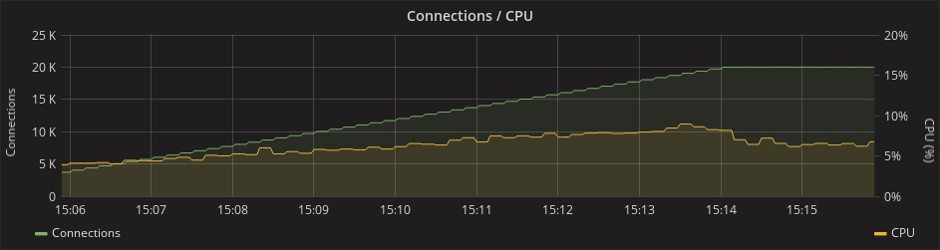
Gorilla
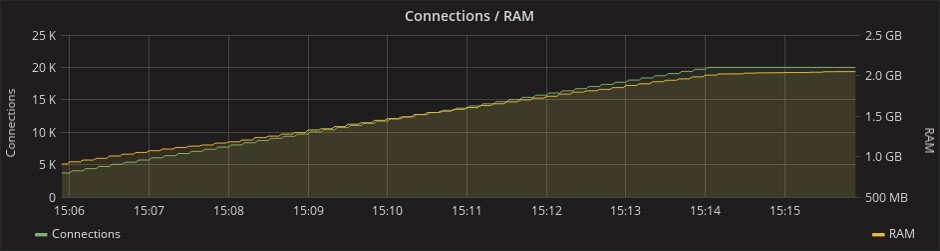
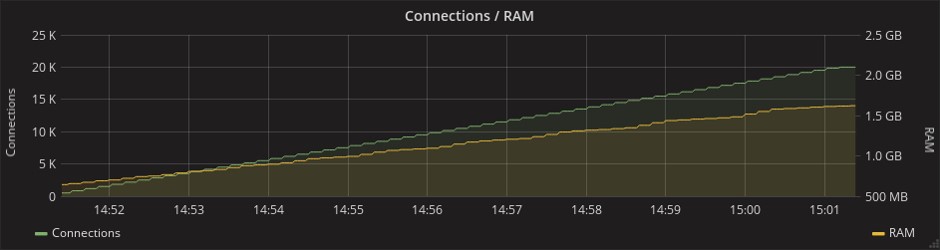
The consumption of RAM with a load of 20 thousand connections reached 2 GB in the case of both frameworks:
Phoenix
Gorilla
At the same time, Go even outperforms Elixir in performance, but the Phoenix Framework provides much more features. On the graph below, which shows the consumption of network resources, you can see that in the Phoenix test, 1.5 times more messages are transmitted. This is due to the fact that this framework already in the original “boxed” version has a mechanism of heartbeats (periodic synchronizing signals), which in Gorilla will have to be implemented independently. With limited deadlines, any additional work was a weighty argument in favor of Phoenix.
Phoenix
Gorilla
Phoenix is a classic MVC framework, quite similar to Rails, which is not surprising, since one of its developers and creator of the Elixir language is Jose Valim, one of the main creators of Ruby on Rails. Some similarities can be seen even in syntax.
Phoenix :
Rails:
When using Phoenix and the Elixir language, a significant part of the processes is performed using the Mix utility. This is a build tool that solves many different tasks for creating, compiling and testing an application, managing its dependencies, and some other processes.
Mix is a key part of any Elixir project. This utility is not inferior and does not exceed analogs from other languages, but it does its job perfectly well. And because the Elixir code is executed on the Erlang virtual machine, it is possible to add any libraries from the Erlang world to dependencies. In addition, together with Erlang VM, you get convenient and secure parallelism, as well as high fault tolerance.
For all its merits, Phoenix has its drawbacks. One of them is the difficulty of solving such tasks as tracking active users on the site under high load conditions.
The fact is that users can connect to different application nodes, and each node will only know about its own clients. To display a list of active users, you will have to poll all application nodes.
To solve these problems, there is a Presence module in Phoenix that allows the developer to track active users in just three lines of code. It uses the mechanism of hartbits and conflict-free replication within the cluster, as well as the PubSub server for exchanging messages between nodes.
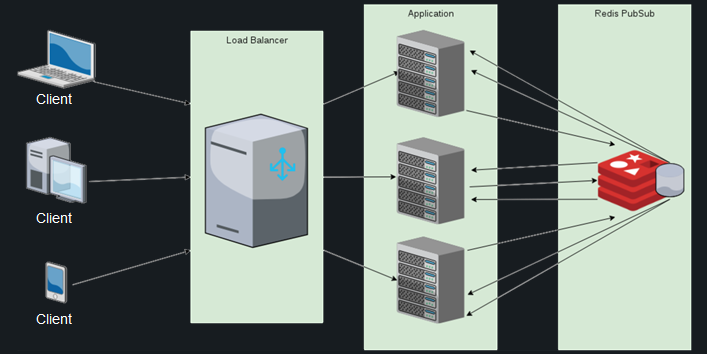
It sounds good, but in fact it turns out about the following. Hundreds of thousands of connecting and disconnecting users generate millions of messages for synchronization between nodes, which is why the consumption of processor resources goes beyond all acceptable limits, and even connecting Redis PubSub does not save the situation. The list of users is duplicated on each node, and the calculation of differential with each new connection becomes more and more expensive - and this is considering that the calculation is carried out on each of the existing nodes.
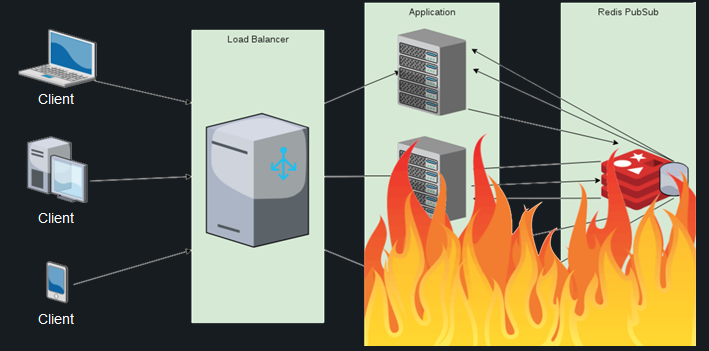
In this situation, even the mark of 100 thousand customers becomes unattainable. I couldn’t find any other ready-made solutions for this task, so I decided to do the following: assign the responsibility for monitoring the online users presence to the database.
At first glance, this is a good idea, in which there is nothing difficult: it is enough to store the last activity field in the database and update it periodically. Unfortunately, for projects with a high load, this is not an option: when the number of users reaches several hundred thousand, the system will not cope with the millions of hits coming from them.
I chose a less trivial, but more productive solution. When a user connects, a unique row is created for him in the table, which stores his identifier, the exact time of entry and the list of nodes to which he is connected. The list of nodes is stored in a JSONB field, and if there is a conflict of lines, it is enough to update it.
This request is responsible for the user login:
The list of nodes looks like this:

If the user opens the service in the second window or on another device, he can go to another node, and then it will also be added to the list. If it falls on the same node as in the first window, the number opposite the name of this node in the list will increase. This number reflects the number of active user connections to a particular node.
Here is the query that goes to the database when the session is closed:
List of nodes:

When a session is closed at a certain node, the connection counter in the database is decremented by one, and when it reaches zero, the node is removed from the list. When the list of nodes is completely empty, this moment will be fixed as the final time for the user to exit.
This approach made it possible not only to track the user's online presence and viewing time, but also to filter these sessions according to various criteria.
In all this, there is only one drawback - if a node falls, all its users “hang” online. To solve this problem, we have a demon that periodically cleans the database from such records, but so far this has not been required. Analysis of the load and monitoring of the cluster's work, carried out after the release of the project in production, showed that there were no drops of nodes and this mechanism was not used.
There were other difficulties, but they are more specific, so it is worth turning to the issue of application resiliency.
To write a good application in a productive language is only half the battle, without literate DevOps it is impossible to achieve any good results.
The first obstacle in the path to the target load was the network kernel Linux. It took some adjustments to achieve a more rational use of its resources.
Each open socket is a file descriptor in Linux, and their number is limited. The reason for the limit is that for each open file in the kernel, a C-structure is created that takes up the unreclaimable memory of the kernel.
In order to use the memory to the maximum, I set very high values for the sizes of the receive and transmit buffers, and also increased the size of the TCP socket buffers. The values here are not set in bytes, but in memory pages, usually one page is 4 KB, and I set the value of 15 thousand for the maximum number of open sockets waiting for connections for high-load servers.
If you use nginx in front of a cowboy server, then you should also think about increasing its limits. The directive worker_connections and worker_rlimit_nofile are responsible for this.
The second barrier is not so obvious. If you run such an application in distributed mode, you can see a sharp increase in processor resource consumption with an increase in the number of connections. The problem is that by default Erlang works with the system calls Poll. In version 2.6 of the Linux kernel, there is Epoll, which can provide a more efficient mechanism for applications that process a large number of simultaneously open connections - with O (1) complexity, unlike Poll, which has O (n) complexity.
Fortunately, Epoll mode is enabled with one flag: + K true, I also recommend increasing the maximum number of processes spawned by your application and the maximum number of open ports using the + P and + Q flags, respectively.
The third problem is more individual, and not everyone can face it. On this project, the process of automatic deployment and dynamic scaling with the help of hef and Kubernetes was organized. Kubernetes allows you to quickly deploy Docker-containers on a large number of hosts, and it is very convenient, but you cannot learn the ip-address of a new host in advance, and if you do not register it in the Erlang config, you will not be able to connect the new node to the distributed application.
Fortunately, the libcluster library exists to solve these problems. Communicating with Kubernetes via the API, she learns in real time about the creation of new nodes and registers them in the erlang cluster.
The chosen framework in combination with the correct server configuration allowed to achieve all the goals of the project: in the set time frame (1 month) to develop an interactive web service that communicates with users in real time and at the same time withstands loads of 150 thousand connections and more.
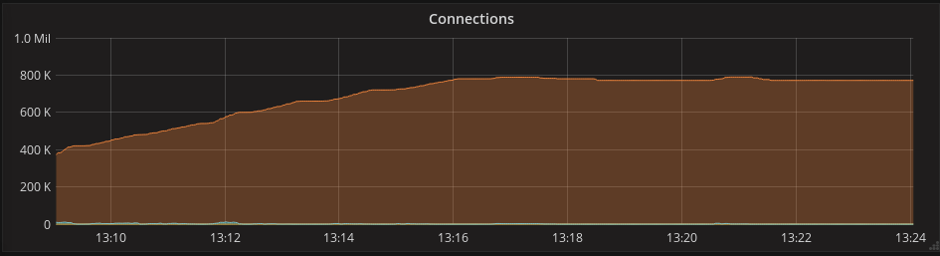
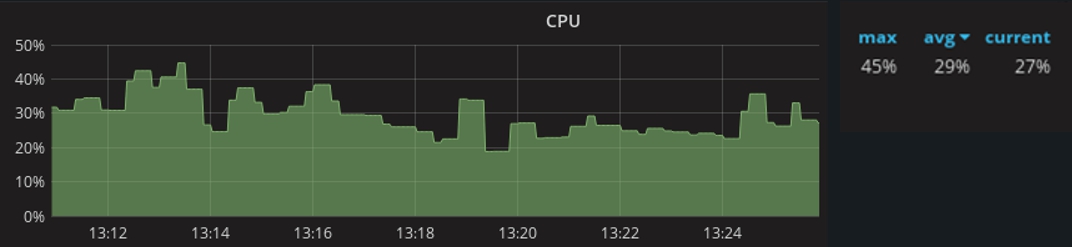
After the launch of the project in production, monitoring was conducted, which showed the following results: with a maximum number of connections up to 800 thousand, the consumption of processor resources reaches 45%. The average load is 29% at 600 thousand connections.
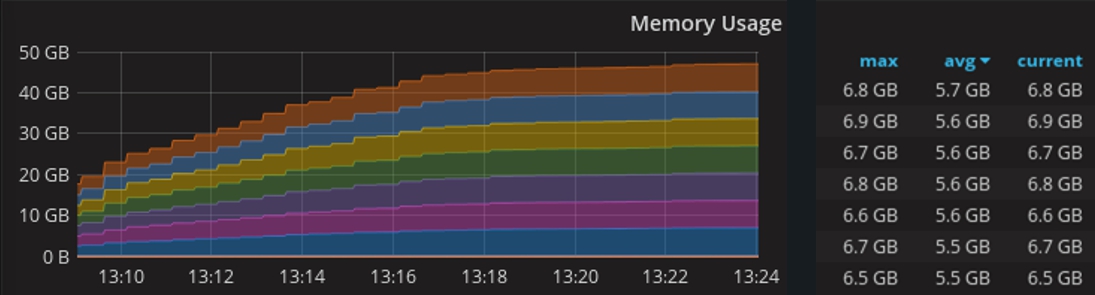
On this graph - memory consumption when working in a cluster of 10 machines, each of which has 8 GB of RAM.
As for the main working tools in this project, Elixir and Phoenix Framework, I have every reason to believe that in the coming years they will become as popular as Ruby and Rails in due time, so it makes sense to start mastering them now.
Thanks for attention!
Development:
elixir-lang.org
phoenixframework.org
Stress Testing:
gatling.io
flood.io
Monitoring:
prometheus.io
grafana.com
Hello everyone, my name is Andrey Klyuev, I am a developer. Recently, I was faced with such a task - to create an interactive service where the user can receive quick bonuses for their actions. The case was complicated by the fact that the project had rather high demands on the load, and the deadlines were extremely small.
In this article, I will tell you how I chose a solution for implementing a websocket server for the complex project requirements, what problems I encountered during the development process, and also say a few words about how the Linux kernel configuration can help in achieving the above goals.
')
At the end of the article are useful links to development tools, testing and monitoring.
Tasks and requirements
Requirements for the project functionality:
- make it possible to track the presence of the user on the resource and track the viewing time;
- provide quick messaging between the client and the server, since the time for the user to receive the bonus is strictly limited;
- create a dynamic interactive interface with synchronization of all actions when the user works with the service through several tabs or devices simultaneously.
Load requirements:
- The application must be able to withstand at least 150 thousand users online.
The implementation period is 1 month.
Technology selection
Having compared the tasks and requirements of the project, I came to the conclusion that for its development it is more expedient to use the WebSocket technology. It provides a permanent connection to the server, eliminating the overhead from a new connection with each message that is present in the implementation on ajax and long-polling technologies. This allows you to get the necessary high rate of messaging in combination with adequate resource consumption, which is very important for high loads.
Also, due to the fact that the installation and disconnection are two clear events, it is possible to track the user’s time on the site with high accuracy.
Given the relatively limited time frame of the project, I decided to develop using the WebSocket framework. I studied several options, the most interesting of which seemed to me PHP ReactPHP, PHP Ratchet, Node.JS websockets / ws, PHP Swoole, PHP Workerman, Go Gorilla, Elixir Phoenix. Their capacity in terms of load tested on a laptop with an Intel Core i5 processor and 4 GB of RAM (these resources were quite enough for research).
PHP Workerman is an asynchronous event-oriented framework. Its capabilities are limited to the simplest implementation of a websocket server and the ability to work with the libevent library needed to handle asynchronous event notifications. The code is at the level of PHP 5.3 and does not meet any standards. For me, the main disadvantage was that the framework does not allow to implement high-load projects. On the test bench, the developed application of the “Hello World” level was unable to keep thousands of connections.
ReactPHP and Ratchet are generally comparable in their capabilities to Workerman. Ratchet inside depends on ReactPHP, it also works through libevent and does not allow creating a solution for high loads.
Swoole - an interesting framework written in C, connects as an extension for PHP, has the means for parallel programming. Unfortunately, I found that the framework is not stable enough: on the test bench, it broke off every second connection.
Next, I looked at Node.JS WS . This framework showed quite good results - about 5 thousand connections on a test bench without additional settings. However, my project meant significantly higher loads, so I opted for the Go Gorilla + Echo Framework and Elixir Phoenix frameworks. These options have been tested in more detail.
Stress Testing
Tools such as artillery, gatling and the flood.io service were used for testing.
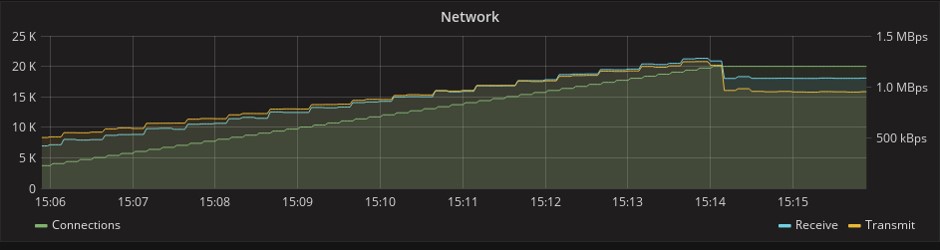
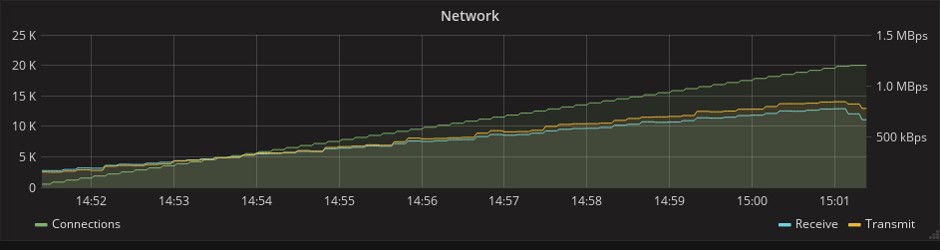
The purpose of the test was to study the consumption of processor and memory resources. Characteristics of the machine were the same - Intel iCore processor 5 and 4 GB of RAM. Tests were conducted on the example of the simplest chats on Go and Phoenix:
Here is a simple chat application that functioned normally on a specified power machine with a load of 25-30 thousand users:
config: target: "ws://127.0.0.1:8080/ws" phases - duration:6 arrivalCount: 10000 ws: rejectUnauthorized: false scenarios: - engine: “ws” flow - send “hello” - think 2 - send “world” Class LoadSimulation extends Simulation { val users = Integer.getInteger (“threads”, 30000) val rampup = java.lang.Long.getLong (“rampup”, 30L) val duration = java.lang.Long.getLong (“duration”, 1200L) val httpConf = http .wsBaseURL(“ws://8.8.8.8/socket”) val scn = scenario(“WebSocket”) .exes(ws(“Connect WS”).open(“/websocket?vsn=2.0.0”)) .exes( ws(“Auth”) sendText(“““[“1”, “1”, “my:channel”, “php_join”, {}]”””) ) .forever() { exes( ws(“Heartbeat”).sendText(“““[null, “2”, “phoenix”, “heartbeat”, {}]”””) ) .pause(30) } .exes(ws(“Close WS”).close) setUp(scn.inject(rampUsers(users) over (rampup seconds))) .maxDuration(duration) .protocols(httpConf) Test runs showed that everything works quietly on a machine of the specified power with a load of 25-30 thousand users.
CPU consumption:
Phoenix
Gorilla
The consumption of RAM with a load of 20 thousand connections reached 2 GB in the case of both frameworks:
Phoenix
Gorilla
At the same time, Go even outperforms Elixir in performance, but the Phoenix Framework provides much more features. On the graph below, which shows the consumption of network resources, you can see that in the Phoenix test, 1.5 times more messages are transmitted. This is due to the fact that this framework already in the original “boxed” version has a mechanism of heartbeats (periodic synchronizing signals), which in Gorilla will have to be implemented independently. With limited deadlines, any additional work was a weighty argument in favor of Phoenix.
Phoenix
Gorilla
About Phoenix Framework
Phoenix is a classic MVC framework, quite similar to Rails, which is not surprising, since one of its developers and creator of the Elixir language is Jose Valim, one of the main creators of Ruby on Rails. Some similarities can be seen even in syntax.
Phoenix :
defmodule Benchmarker.Router do use Phoenix.Router alias Benchmarker.Controllers get "/:title", Controllers.Pages, :index, as: :page end Rails:
Benchmarker::Application.routes.draw do root to: "pages#index" get "/:title", to: "pages#index", as: :page end Mix is an automating utility for Elixir projects
When using Phoenix and the Elixir language, a significant part of the processes is performed using the Mix utility. This is a build tool that solves many different tasks for creating, compiling and testing an application, managing its dependencies, and some other processes.
Mix is a key part of any Elixir project. This utility is not inferior and does not exceed analogs from other languages, but it does its job perfectly well. And because the Elixir code is executed on the Erlang virtual machine, it is possible to add any libraries from the Erlang world to dependencies. In addition, together with Erlang VM, you get convenient and secure parallelism, as well as high fault tolerance.
Problems and Solutions
For all its merits, Phoenix has its drawbacks. One of them is the difficulty of solving such tasks as tracking active users on the site under high load conditions.
The fact is that users can connect to different application nodes, and each node will only know about its own clients. To display a list of active users, you will have to poll all application nodes.
To solve these problems, there is a Presence module in Phoenix that allows the developer to track active users in just three lines of code. It uses the mechanism of hartbits and conflict-free replication within the cluster, as well as the PubSub server for exchanging messages between nodes.
It sounds good, but in fact it turns out about the following. Hundreds of thousands of connecting and disconnecting users generate millions of messages for synchronization between nodes, which is why the consumption of processor resources goes beyond all acceptable limits, and even connecting Redis PubSub does not save the situation. The list of users is duplicated on each node, and the calculation of differential with each new connection becomes more and more expensive - and this is considering that the calculation is carried out on each of the existing nodes.
In this situation, even the mark of 100 thousand customers becomes unattainable. I couldn’t find any other ready-made solutions for this task, so I decided to do the following: assign the responsibility for monitoring the online users presence to the database.
At first glance, this is a good idea, in which there is nothing difficult: it is enough to store the last activity field in the database and update it periodically. Unfortunately, for projects with a high load, this is not an option: when the number of users reaches several hundred thousand, the system will not cope with the millions of hits coming from them.
I chose a less trivial, but more productive solution. When a user connects, a unique row is created for him in the table, which stores his identifier, the exact time of entry and the list of nodes to which he is connected. The list of nodes is stored in a JSONB field, and if there is a conflict of lines, it is enough to update it.
create table watching_times ( id serial not null constraint watching_times_pkey primary key, user_id integer, join_at timestamp, terminate_at timestamp, nodes jsonb ); create unique index watching_times_not_null_uni_idx on watching_times (user_id, terminate_at) where (terminate_at IS NOT NULL); create unique index watching_times_null_uni_idx on watching_times (user_id) where (terminate_at IS NULL); This request is responsible for the user login:
INSERT INTO watching_times ( user_id, join_at, terminate_at, nodes ) VALUES (1, NOW(), NULL, '{nl@192.168.1.101”: 1}') ON CONFLICT (user_id) WHERE terminate_at IS NULL DO UPDATE SET nodes = watching_times.nodes || CONCAT( '{nl@192.168.1.101:', COALESCE(watching_times.nodes->>'nl@192.168.1.101', '0')::int + 1, '}' )::JSONB RETURNING id; The list of nodes looks like this:
If the user opens the service in the second window or on another device, he can go to another node, and then it will also be added to the list. If it falls on the same node as in the first window, the number opposite the name of this node in the list will increase. This number reflects the number of active user connections to a particular node.
Here is the query that goes to the database when the session is closed:
UPDATE watching_times SET nodes CASE WHEN ( CONCAT( '{“nl@192.168.1.101”: ', COALESCE(watching_times.nodes ->> 'nl@192.168.1.101', '0') :: INT - 1, '}' )::JSONB ->>'nl@192.168.1.101' )::INT <= 0 THEN (watching_times.nodes - 'nl@192.168.1.101') ELSE CONCAT( '{“nl@192.168.1.101”: ', COALESCE(watching_times.nodes ->> 'nl@192.168.1.101', '0') :: INT - 1, '}' )::JSONB END ), terminate_at = (CASE WHEN ... = '{}' :: JSONB THEN NOW() ELSE NULL END) WHERE id = 1; List of nodes:
When a session is closed at a certain node, the connection counter in the database is decremented by one, and when it reaches zero, the node is removed from the list. When the list of nodes is completely empty, this moment will be fixed as the final time for the user to exit.
This approach made it possible not only to track the user's online presence and viewing time, but also to filter these sessions according to various criteria.
In all this, there is only one drawback - if a node falls, all its users “hang” online. To solve this problem, we have a demon that periodically cleans the database from such records, but so far this has not been required. Analysis of the load and monitoring of the cluster's work, carried out after the release of the project in production, showed that there were no drops of nodes and this mechanism was not used.
There were other difficulties, but they are more specific, so it is worth turning to the issue of application resiliency.
Configuring the Linux kernel to improve performance
To write a good application in a productive language is only half the battle, without literate DevOps it is impossible to achieve any good results.
The first obstacle in the path to the target load was the network kernel Linux. It took some adjustments to achieve a more rational use of its resources.
Each open socket is a file descriptor in Linux, and their number is limited. The reason for the limit is that for each open file in the kernel, a C-structure is created that takes up the unreclaimable memory of the kernel.
In order to use the memory to the maximum, I set very high values for the sizes of the receive and transmit buffers, and also increased the size of the TCP socket buffers. The values here are not set in bytes, but in memory pages, usually one page is 4 KB, and I set the value of 15 thousand for the maximum number of open sockets waiting for connections for high-load servers.
File Descriptor Limits:
#!/usr/bin/env bash sysctl -w 'fs.nr_open=10000000' # sysctl -w 'net.core.rmem_max=12582912' # sysctl -w 'net.core.wmem_max=12582912' # sysctl -w 'net.ipv4.tcp_mem=10240 87380 12582912' # TCP sysctl -w 'net.ipv4.tcp_rmem=10240 87380 12582912' # sysctl -w 'net.ipv4.tcp_wmem=10240 87380 12582912'# <code>sysctl -w 'net.core.somaxconn=15000' # , If you use nginx in front of a cowboy server, then you should also think about increasing its limits. The directive worker_connections and worker_rlimit_nofile are responsible for this.
The second barrier is not so obvious. If you run such an application in distributed mode, you can see a sharp increase in processor resource consumption with an increase in the number of connections. The problem is that by default Erlang works with the system calls Poll. In version 2.6 of the Linux kernel, there is Epoll, which can provide a more efficient mechanism for applications that process a large number of simultaneously open connections - with O (1) complexity, unlike Poll, which has O (n) complexity.
Fortunately, Epoll mode is enabled with one flag: + K true, I also recommend increasing the maximum number of processes spawned by your application and the maximum number of open ports using the + P and + Q flags, respectively.
Poll vs. Epoll
#!/usr/bin/env bash Elixir --name ${MIX_NODE_NAME}@${MIX_HOST} --erl “-config sys.config -setcookie ${ERL_MAGIC_COOKIE} +K true +Q 500000 +P 4194304” -S mix phx.server The third problem is more individual, and not everyone can face it. On this project, the process of automatic deployment and dynamic scaling with the help of hef and Kubernetes was organized. Kubernetes allows you to quickly deploy Docker-containers on a large number of hosts, and it is very convenient, but you cannot learn the ip-address of a new host in advance, and if you do not register it in the Erlang config, you will not be able to connect the new node to the distributed application.
Fortunately, the libcluster library exists to solve these problems. Communicating with Kubernetes via the API, she learns in real time about the creation of new nodes and registers them in the erlang cluster.
config :libcluster, topologies: [ k8s: [ strategy: Cluster.Strategy.Kubernetes, config: [ kubernetes_selector: “app=my -backend”, kubernetes_node_basename: “my -backend”]]] Results and prospects
The chosen framework in combination with the correct server configuration allowed to achieve all the goals of the project: in the set time frame (1 month) to develop an interactive web service that communicates with users in real time and at the same time withstands loads of 150 thousand connections and more.
After the launch of the project in production, monitoring was conducted, which showed the following results: with a maximum number of connections up to 800 thousand, the consumption of processor resources reaches 45%. The average load is 29% at 600 thousand connections.
On this graph - memory consumption when working in a cluster of 10 machines, each of which has 8 GB of RAM.
As for the main working tools in this project, Elixir and Phoenix Framework, I have every reason to believe that in the coming years they will become as popular as Ruby and Rails in due time, so it makes sense to start mastering them now.
Thanks for attention!
Links
Development:
elixir-lang.org
phoenixframework.org
Stress Testing:
gatling.io
flood.io
Monitoring:
prometheus.io
grafana.com
Source: https://habr.com/ru/post/351012/
All Articles