Integration between monitoring and ITSM
 At the request of the workers, we present new material from a series of articles on the integration of various IT systems in the customer's infrastructure. At this time, we will dwell on such a symbiosis as a monitoring system and ITSM system.
What are these systems separately can tell a long time. Properly configured and working monitoring system helps to avoid many troubles or prevent them, and ITSM-system allows you to manage IT-processes and record events occurring in the infrastructure. We will not delve into the subtleties of the work of these systems separately, but learn how to connect these systems for the benefit of the customer in general and the service company serving the IT infrastructure, in particular.
In the case of monitoring integration, we are interested, first of all, that events registered in the monitoring system, alerts, initiate the creation of an incident in the ITSM system.
Alert is an event registered by the monitoring system at the moment when the device or service has reached a set threshold.
')
An incident is any event that is not part of the standard operations of the service and causes or may cause an interruption of service or a decrease in the quality of service.
We will consider integration on the example of one of the most popular and sought-after systems on the market - ServiceNow and Microsoft System Center Operation Manager (SCOM). However, the approach can be implemented on other similar systems.
There are two main ways to integrate the monitoring system and the ITSM system.
1. Using the connector, the so-called MID-server. Since ServiceNow is a cloud platform, the use of an intermediate link is a preferred condition for the normal functioning of such a bundle.

2. Using the REST API (REpresentational State Transfer Application Program Interface). Most modern web applications, which is also ServiceNow, provide the user with such an interface.

REST API is a software architecture style for building distributed, scalable web services.
Each implementation path has its pros and cons. In the first case, you need to install a MID server, open certain ports, and so on. The interaction of two support teams is also required, which in some cases can be difficult. In the second case, we need only an account with certain rights in the ServiceNow and, in principle, everything. The rest of the work can be done by the monitoring team.
After weighing all the pros and cons, as well as evaluating the existing experience, it was decided to follow the path number two, namely to use the REST API.
Baseline analysis
So, there was a task to automate the raising of incidents on events in the monitoring system. Depending on the source of the event, incidents should be ranked by priority and assigned to certain responsible teams.
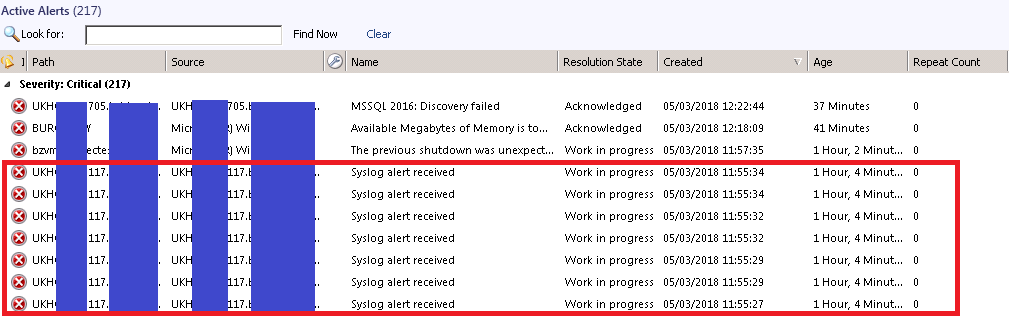
To begin with, events in the monitoring system were analyzed. Identified some of the laws that need to be considered when building integration. For example, there are cases when several alerts or one location arrive on one device. As a rule, such events are grouped, and only one incident is created per group.
A list of responsible teams was determined, and a list of priorities was compiled depending on the type of event.
Implementation
We will conduct most of the work on the SCOM side, so it’s more convenient to use PowerShell in conjunction with the OperationsManager module included in the distribution kit of the monitoring system. ServiceNow will be accessed through the REST API for specific data, as well as to create incidents directly.
ServiceNow has a fairly advanced software interface (API) and allows you to almost completely manage the system. We only need the Table API method. This method allows you to create, update, read and delete records in the ServiceNow. In our case, this is the Table API - GET / api / now / table /, with which we will read data from ServiceNow, and the Table API - POST / api / now / table /, with the help of which we will actually add new incidents.
More methods are described here docs.servicenow.com/bundle/geneva-servicenow-platform/page/integrate/inbound_rest/concept/c_TableAPI.html . As parameters to the methods, a structured hash table with the data we need is transferred. On the piece of the script below you can see which parameters are used in our case:
#Define Hash Table $HashTable = @{ 'u_snow_category' = 'Infrastructure'; 'u_affected_user' = 'scom'; 'caller_id' = 'scom'; 'assignment_group' = $record.ResolverGroup; 'cmdb_ci' = $record.CI.name; 'location' = $record.Location; 'short_description' = [System.Web.HttpUtility]::HtmlEncode($record.ShortDescription); 'description' = [System.Web.HttpUtility]::HtmlEncode($record.Description); 'impact' = $record.Impact; "contact_type" = "Own Observation"; #Posting new incident $RaisedIncident = Invoke-RestMethod -uri "$SNOW$SNOWtable`incident" -Headers $PostHeader -Method Post -Body ($HashTable | ConvertTo-Json); In the example above, the string
$RaisedIncident = Invoke-RestMethod -uri "$SNOW$SNOWtable`incident" -Headers $PostHeader -Method Post -Body ($Body | ConvertTo-Json); Directly creates an incident in ServiceNow, where:
"$ SNOW $ SNOWtable`incident" - the address of the software interface, which in general is as follows CustomDomain.service-now.com/api/now/table/incident
$ PostHeader - variable transmitting the content type;
$ HashTable - directly hash table with the necessary data.
Simplified script algorithm is as follows:
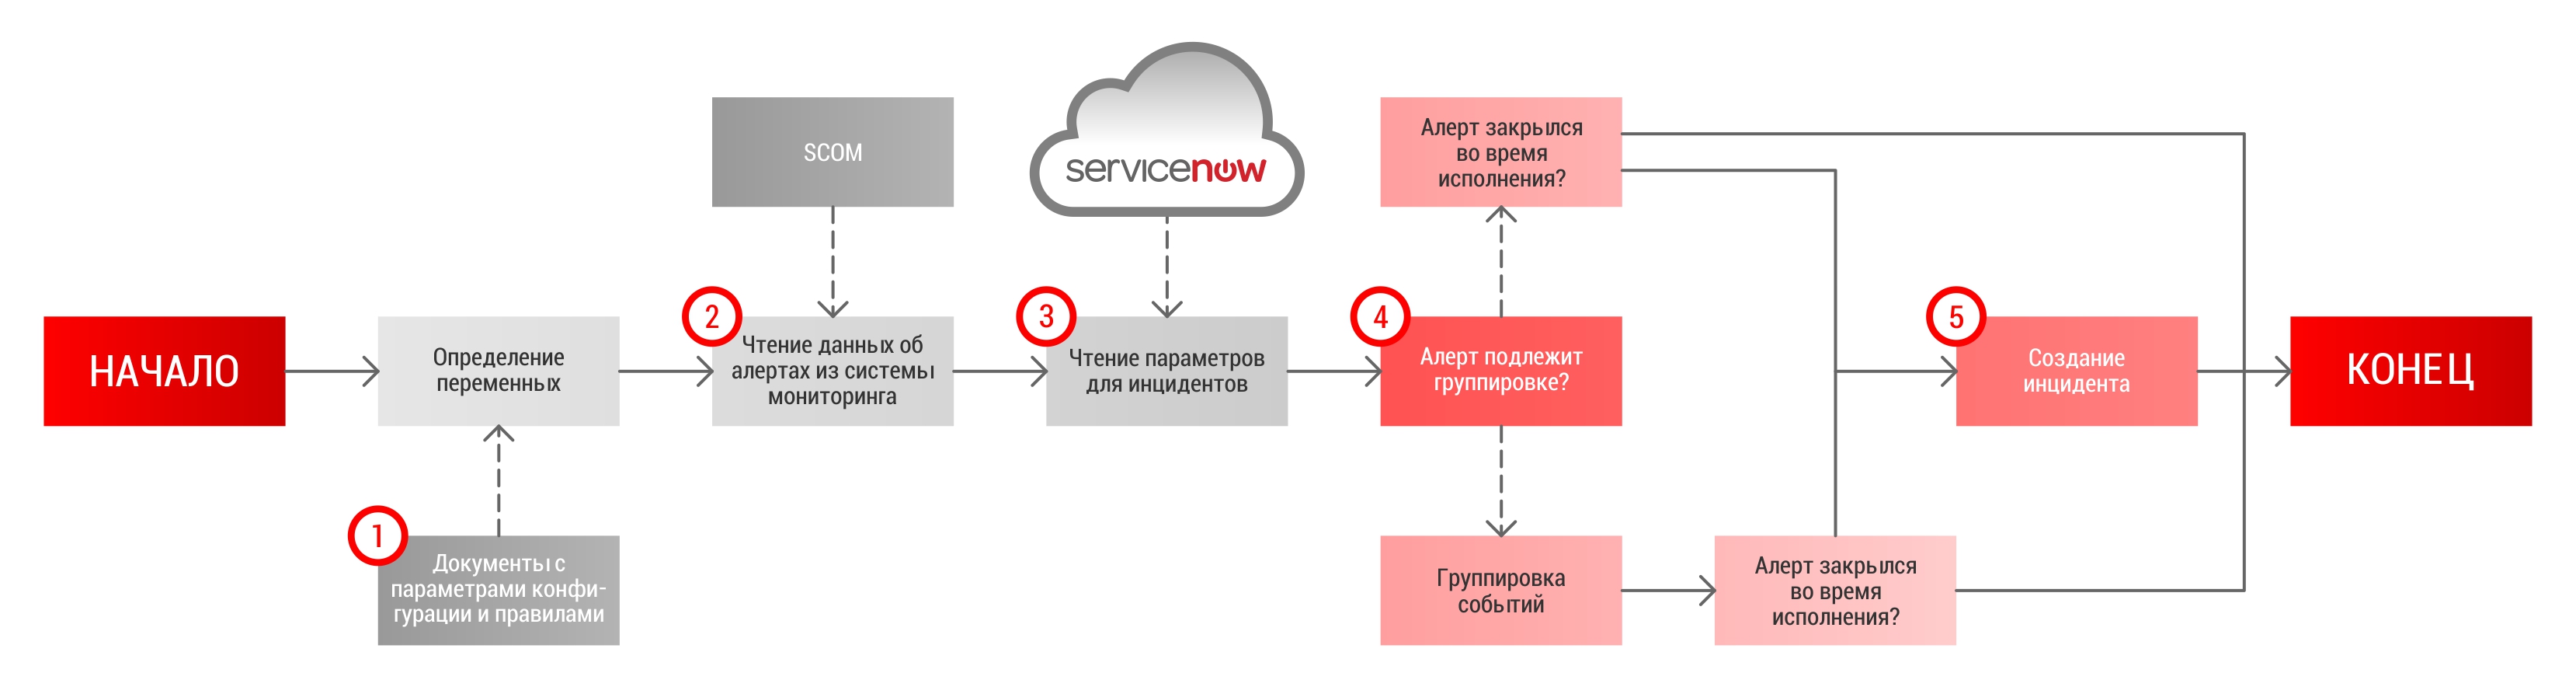
1. Reading environment parameters
We define all the variables that we read for the entire osprey so that in the future we can access them from the functions.
Example of reading variables:
New-Variable -Name ScriptConfiguraion -Value (Get-Content '.\Configuration.txt' -Raw -ErrorAction Stop | ConvertFrom-Json -ErrorAction Stop) -Option AllScope, ReadOnly -ErrorAction Stop; In addition to the file with configuration settings, we will need a list of rules by which we will determine whether the event belongs to a particular priority and one or another responsible command:
New-Variable -Name DefaultRules -Value (Import-Csv $ScriptConfiguraion.Configuration.Rules.DefaultRules -ErrorAction Stop) -Option AllScope, ReadOnly -ErrorAction Stop; An example of a file with rules in our case is as follows:
{ "Parameters":"", "Properties":"Name", "Expression":"{0} -match \"http\\://www\\.domainname\\.com/\"", "ResolverGroup":"Application Team", "Priority":"2" }, Settings for connecting to ServiceNow:
New-Variable -Name SNOW -Value $ScriptConfiguraion.Configuration.SNOW.APIURL -Option AllScope, ReadOnly -ErrorAction Stop; New-Variable -Name SNOWtable -Value $ScriptConfiguraion.Configuration.SNOW.APITables -Option AllScope, ReadOnly -ErrorAction Stop; New-Variable -Name GetHeader -Value (@{"Authorization" = "Basic " + [System.Convert]::ToBase64String([System.Text.Encoding]::UTF8.GetBytes($SNOWacc+":"+$SNOWaccPass))}) -Option AllScope, ReadOnly -ErrorAction Stop; New-Variable -Name PostHeader -Value (@{"Authorization" = "Basic " + [System.Convert]::ToBase64String([System.Text.Encoding]::UTF8.GetBytes($SNOWacc+":"+$SNOWaccPass));"Content-Type" = "application/json"}) -Option AllScope, ReadOnly -ErrorAction Stop; If you have noticed, then we take the paths to the files, settings, and service data from the main configuration file, which we initially read and put the contents into the $ ScriptConfiguraion variable.
Next, load the modules for working with ServiceNow and SCOM:
Add-Type -AssemblyName System.Web -ErrorAction Stop; Import-Module OperationsManager -ErrorAction Stop; 2. Reading data from the monitoring system
To upload data from SCOM you need to establish a connection:
#Connecting to SCOM API if(-not(Get-SCOMManagementGroupConnection | ?{$_.IsActive})){ foreach($ManagementServer in $ScriptConfiguraion.Configuration.SCOM.ManagementServers){ New-SCManagementGroupConnection $ManagementServer; if(Get-SCOMManagementGroupConnection | ?{$_.IsActive}){ break; } } if(-not(Get-SCOMManagementGroupConnection | ?{$_.IsActive})){ Write-CustomLog "Script failed to connect to all SCOM management servers [$($ScriptConfiguraion.Configuration.SCOM.ManagementServers)] supplied in the configuration file. Please review debug log for more info."; exit; } } And read the alert data:
$AlertList = Get-SCOMAlert -Criteria "$($ScriptConfiguraion.Configuration.SCOM.AlertCriteria)"; At the exit in $ AlertList we will have a list of all the alerts from SCOM that meet the criteria $ ScriptConfiguraion.Configuration.SCOM.AlertCriteria. We set the following criteria:
(CustomField2 IS NULL OR CustomField2 = '') AND Severity = 2 AND ResolutionState <> 255 In CustomField2, we store incident number data in our infrastructure. Thus, in the future, it will be easy to find the necessary alert by the incident number, and with the help of this field we will group the incidents for the same type of alerts.
3. Reading data from an ITSM system
After you have received the incident data, you must read the information on the CI (Configuration Item) - a configuration unit in the ITSM system. This is necessary in order to compare the data from the monitoring system with the data from the ITSM system and set the priority for the incident created.
A piece of script for uploading CI data is as follows:
$CI = (Invoke-RestMethod -uri "$SNOW$SNOWtable`cmdb_ci" -Headers $GetHeader -Method Get -Body @{sysparm_query="nameLIKE$SourceObject";sysparm_fields='name,location,u_environment,u_service_level,sys_updated_on,install_status'}).result; 4. Grouping alerts by location
To group events, we group all alerts in SCOM by location:
$Alerts = $Alerts | group Location; And check if there is an incident for a given group in the ITSM system. Since we record information on incidents in the SCOM database, we will also check on the side of SCOM.
foreach($entry in ($OperationalData | ?{$_.GroupingType -eq 'LocationAndMonitorID'})){ if($entry.Location -eq $Location -and $entry.MonitorId -eq $MonitorId){ return(@{sysID=$entry.sysID;Number=$entry.Number}); } } 5. Check the status of the alert over time and create an incident
The last check before raising the incident is to see if the alert did not close while we were all checking.
($record.Alert.ResolutionState -ne 255){} Well, when all the information is received, it raises the incident itself, as described above:
#Define Hash Table $HashTable = @{ 'u_snow_category' = 'Infrastructure'; 'u_affected_user' = 'scom'; 'caller_id' = 'scom'; 'assignment_group' = $record.ResolverGroup; 'cmdb_ci' = $record.CI.name; 'location' = $record.Location; 'short_description' = [System.Web.HttpUtility]::HtmlEncode($record.ShortDescription); 'description' = [System.Web.HttpUtility]::HtmlEncode($record.Description); 'impact' = $record.Impact; "contact_type" = "Own Observation"; #Posting new incident $RaisedIncident = Invoke-RestMethod -uri "$SNOW$SNOWtable`incident" -Headers $PostHeader -Method Post -Body ($HashTable | ConvertTo-Json); 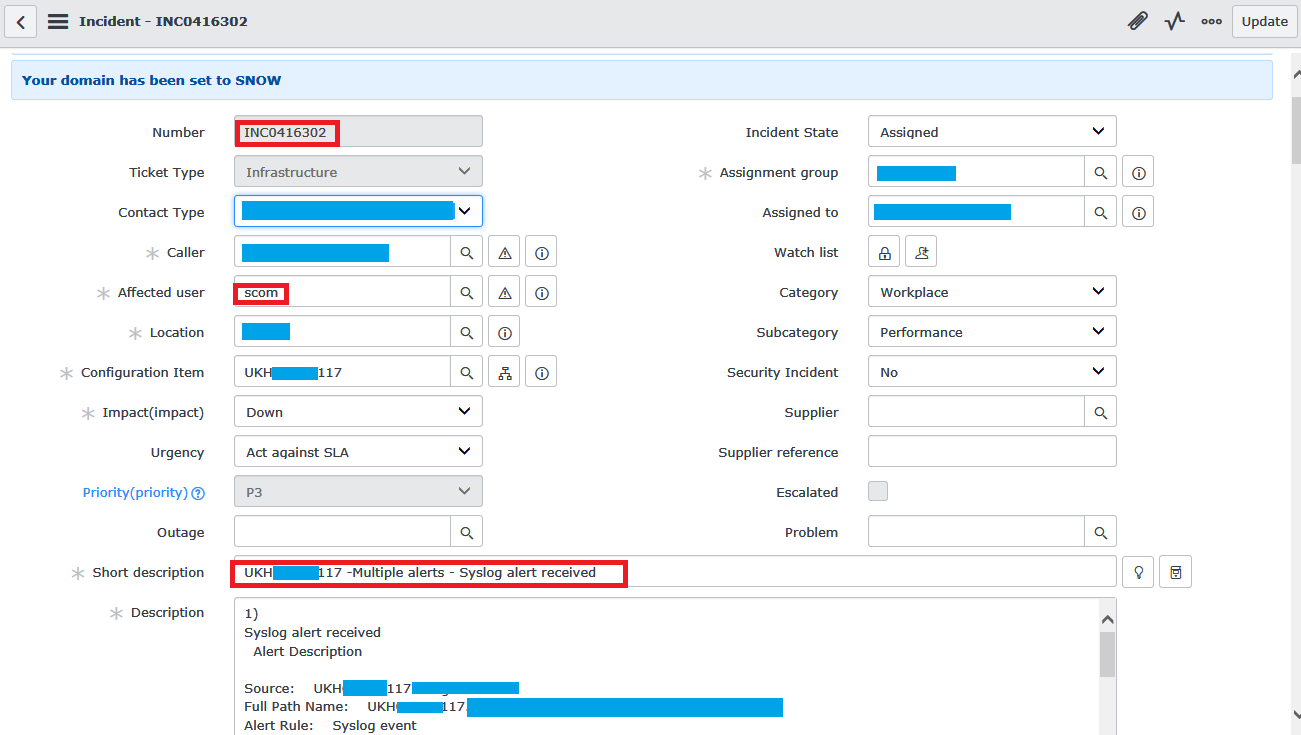
Do not forget to update the CustomField2, so that later not to go into ServiceNow for this information.
$AlertUpdateResult = $Alert | Update-Alert -ParamStr "-CustomField2 'Raised' -CustomField3 '$($result['IncidentNumber'])' 
findings
As you can see, in a simple form to implement integration with ServiceNow is not so difficult. If you don’t go into details, all the integration comes down to running the script on a schedule that will download the data from the monitoring system and, on their basis, bring the incident to the ITSM system. Further, the incident will be processed by Service Desk or directly to the responsible team.
When integration is implemented, the overall response time to events in the system is reduced, which allows responding to the problems that have arisen in time and eliminating them in time. Human errors are reduced when an incident is raised (incorrect assignment to another team, incorrect incident priority, not filling in the data necessary for the initial diagnosis). Reduced total labor costs.
Source: https://habr.com/ru/post/350960/
All Articles