Excel instead of PowerShell: queries to AD and system reports "on the knee"

In the comments to the previous article, we remembered accounting in Excel instead of 1C. Well, let's see how you know Excel. Today I will show how to get data from Active Directory and work with them without macros and PowerShell - only with regular Office mechanisms. For example, you can easily get analytics on the use of operating systems in an organization if you do not already have something like Microsoft SCOM. Well, or just warm up and get away from the scripts.
Of course, you can get data as in the examples below in literally one line on PowerShell. But, firstly, PowerShell is too boring, and secondly, Excel is able to dynamically update the data - the resulting documents can be published online and forget about updating them.
To work with data, I will use the mechanism of Power Query . For office 2010 and 2013, you will have to install a plugin , in Microsoft Office 2016 this module is already built in. Unfortunately, the standard edition is not enough for us, we need Professional.
The mechanism itself is designed to receive and process data from a variety of sources - from old ODBC and text files, to Exchange, Oracle and Facebook. More information about the mechanism and the built-in scripting language "M" has already been written on Habré , but I will analyze a couple of examples of using Power Query to get data from Active Directory.
Warm-up: see when our users have logged in
The request itself to the domain database is created on the “Data - New request - From other sources - From Active Directory” tab.
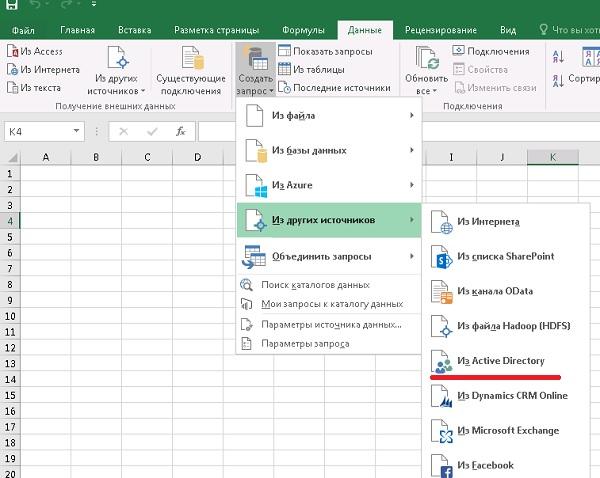
Specify the data source.
You will need to choose a domain name, specify the necessary data for the connection. Next, select the type of objects, in this example - user . On the right in the preview window, the request is already running, showing a preview of the data.
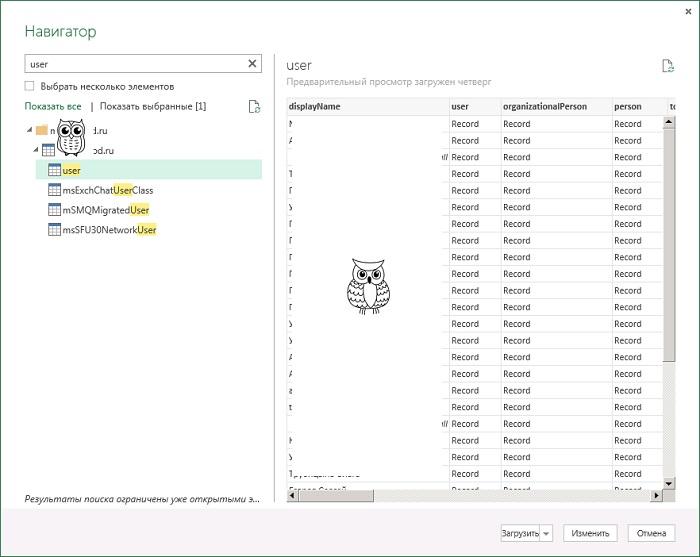
We prepare the request, admiring the preview.
Preliminary inquiry should be prepared by clicking the "change" button and selecting the necessary columns. In essence, these columns are classes. Each of them contains a set of specific attributes of an Active Directory object, except for the main displayName column, which is itself an attribute. I will focus on the user , person , top, and securityPrincipal classes. Now it is necessary to select the necessary attributes from each class using the "extension" - an icon with two arrows at the column heading:
- The user class is expanded by selecting lastLogonTimestamp and userAccountControl ;
- in person, select telephoneNumber ;
- in top - whenCreated ;
- and in securityPrincipal , SamAccountName .
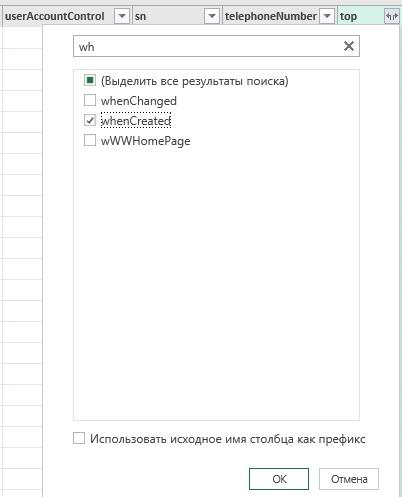
Expand the query.
Now we’ll configure the filter: in particular, in order not to get blocked accounts, the userAccountControl attribute must be set to 512 or 66048. The filter may be different in your environment. More information about the attribute can be found in the Microsoft documentation.
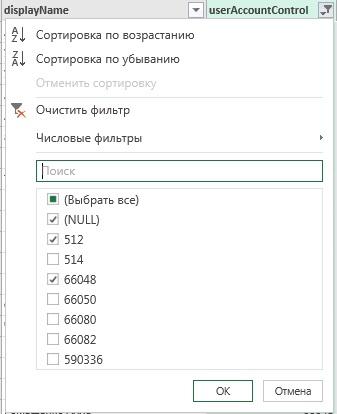
Apply the filter .
Sometimes Excel incorrectly defines the data format, especially the values of the lastLogonTimestamp attribute. If you suddenly suffer such a misfortune, you can set the correct format on the “Convert” tab.
Now the userAccountControl column should be removed - in the display it is not needed at all. And click "Download and close."
The result was a sign that remained quite a bit to bring to mind. For example, rename columns to something readable. And set up automatic data update.
Automatic updating when opening a table or by timeout is configured in the “Data” tab in “Properties”.
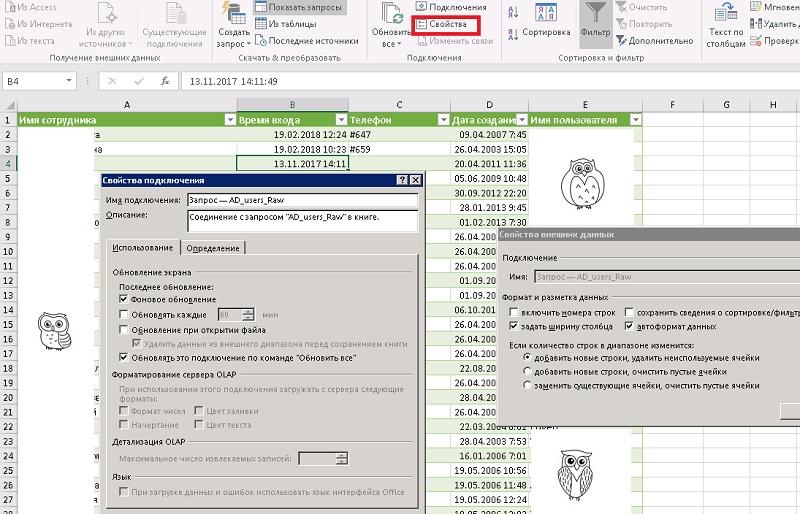
Configure update data.
After the update setup is completed, you can safely give the table to the staff of the personnel department or the security service - let them know who logged in and when.
let = ActiveDirectory.Domains("domain.ru"), domain.ru = {[Domain="domain.ru"]}[#"Object Categories"], user1 = domain.ru{[Category="user"]}[Objects], #" " = Table.RemoveColumns(user1,{"organizationalPerson", "shadowAccount", "posixAccount", "msExchOmaUser", "msExchBaseClass", "msExchIMRecipient", "msExchCertificateInformation", "msExchMultiMediaUser", "msExchMailStorage", "msExchCustomAttributes", "mailRecipient", "distinguishedName"}), #" securityPrincipal" = Table.ExpandRecordColumn(#" ", "securityPrincipal", {"sAMAccountName"}, {"sAMAccountName"}), #" top" = Table.ExpandRecordColumn(#" securityPrincipal", "top", {"whenCreated"}, {"whenCreated"}), #" person" = Table.ExpandRecordColumn(#" top", "person", {"telephoneNumber"}, {"telephoneNumber"}), #" user" = Table.ExpandRecordColumn(#" person", "user", {"lastLogonTimestamp", "userAccountControl"}, {"lastLogonTimestamp", "userAccountControl"}), #" " = Table.SelectRows(#" user", each ([userAccountControl] = 512 or [userAccountControl] = 66048)), #" " = Table.TransformColumnTypes(#" ",{{"lastLogonTimestamp", type datetime}}), #" 1" = Table.RemoveColumns(#" ",{"userAccountControl"}) in #" 1" Create an address book, or what to do when the corporate portal with AD is not friendly
Another way to use Excel in conjunction with Active Directory is to create an address book based on AD data. It is clear that the address book will be relevant only if the domain is in order.
Create a query on the user object, expand the user class in the mail , and the person class in the telephoneNumber . Let's delete all columns, except distinguishedName - the domain structure repeats the structure of the enterprise, therefore the names of Organizational Units correspond to the names of the divisions. Similarly, security groups can be used as the basis of unit names.
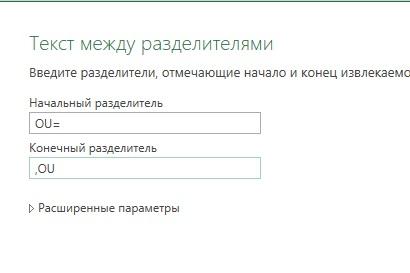
Now, from the line CN = User Name, OU = Accounting Department, OU = Divisions, DC = domain, DC = ru, you must directly extract the department name. The easiest way to do this is with the delimiters on the Transform tab.

Extract the text.
I use OU = and , OU = as separators. In principle, a comma is sufficient, but I am reinsured.
Enter separators.
Now, using the filter, you can cut off unnecessary OUs , like blocked users and Builtin , set up sorting and load data into the table.

View summary table.
Quick report on the composition of workstations, without the introduction of agents and other training
Now we will try to create a useful table by obtaining data on computers. Let's make a report on the operating systems used by the company: for this we will create a query, but in the navigator this time we will select computer .
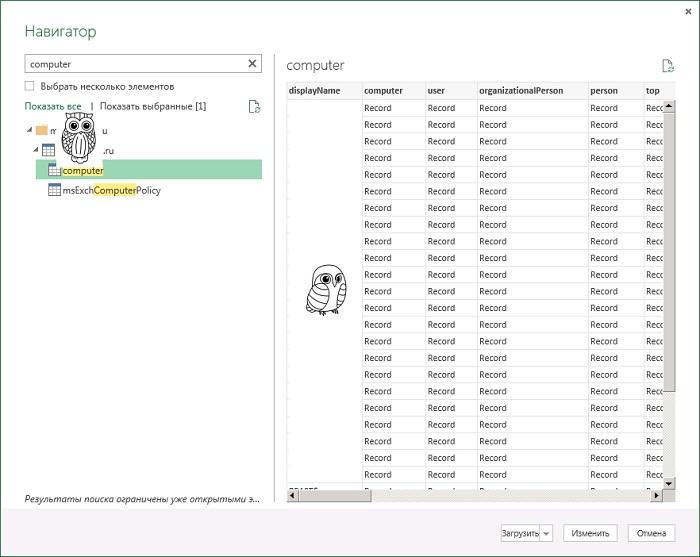
Make a request for the computer object.
Let's leave the computer and top column classes and expand them:
- We will expand the computer class by selecting cn , operatingSystem , operatingSystemServicePack and operatingSystemVersion ;
- in the top class, select whenCreated .

Advanced Request.
If desired, you can make a report only on server operating systems. For example, apply a filter on the operatingSystem attribute or operatingSystemVersion. I will not do this, but I will correct the display of the creation time - only a year is interesting to me. To do this, on the “Conversion” tab, select the column we need and select “Year” in the “Date” menu.
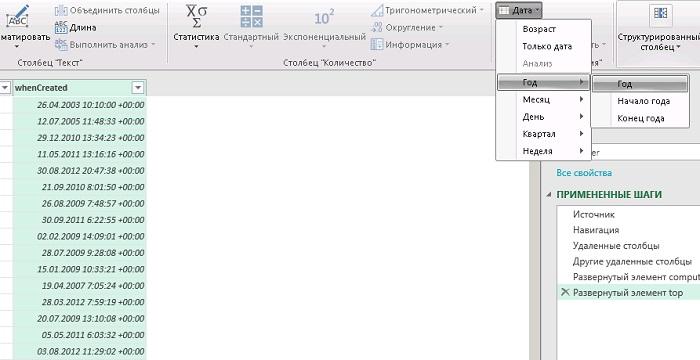
We retrieve the year from the time the computer entered the domain.
It now remains to remove the displayname column as unnecessary and load the result. Data is ready. Now you can work with them as with a regular table. To begin with, we will make a pivot table on the “Insert” tab - “Pivot table”. We agree with the choice of the data source and configure its fields.
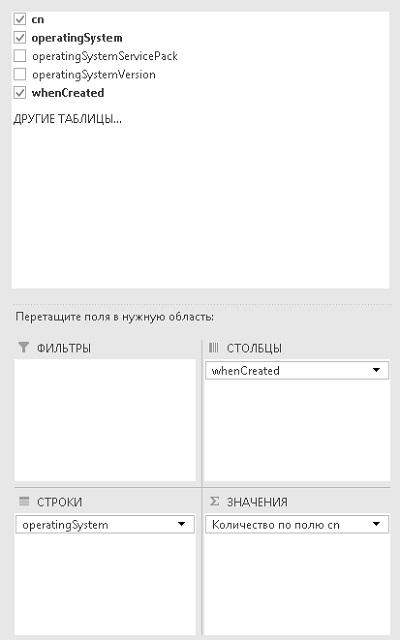
Pivot table field settings.
It now remains to customize the design and enjoy the result:
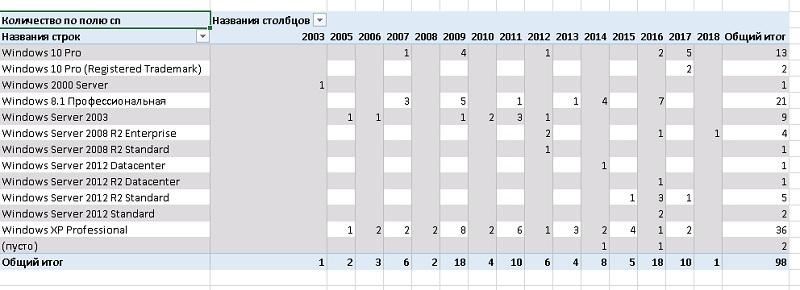
Pivot table for computers in AD.
If you wish, you can add a summary graph, also on the "Insert" tab. In the "Categories" (or in the "Rows", to taste) we add the operatingSystem , in the data - cn . On the "Designer" tab, you can select the type of chart you like, I prefer a circular one.
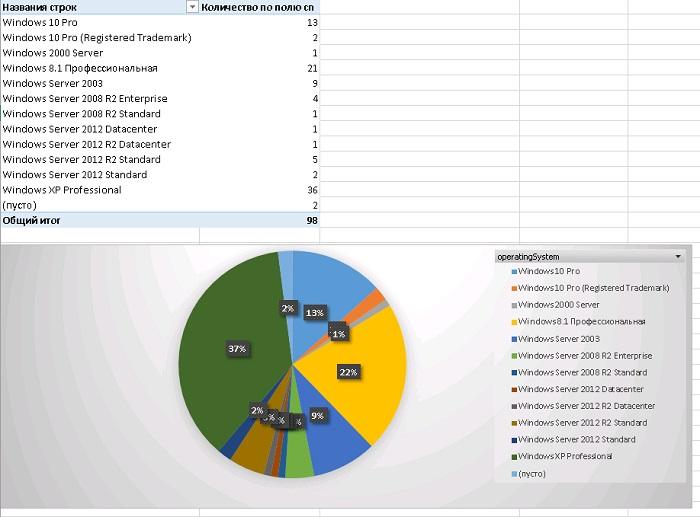
Pie chart.
Now you can clearly see that, despite the ongoing update, the total number of workstations running Windows XP and servers running Windows 2003 is quite large. And there is something to strive for.
let = ActiveDirectory.Domains("domain.ru"), domain.ru = {[Domain="domain.ru"]}[#"Object Categories"], computer1 = domain.ru{[Category="computer"]}[Objects], #" " = Table.RemoveColumns(computer1,{"user", "organizationalPerson", "person"}), #" " = Table.SelectColumns(#" ",{"displayName", "computer", "top"}), #" computer" = Table.ExpandRecordColumn(#" ", "computer", {"cn", "operatingSystem", "operatingSystemServicePack", "operatingSystemVersion"}, {"cn", "operatingSystem", "operatingSystemServicePack", "operatingSystemVersion"}), #" top" = Table.ExpandRecordColumn(#" computer", "top", {"whenCreated"}, {"whenCreated"}), #" " = Table.TransformColumns(#" top",{{"whenCreated", Date.Year}}), #" 1" = Table.RemoveColumns(#" ",{"displayName"}) in #" 1" But that's not all.
It should be noted that Excel is able to compile not only the favorite tables of accounting. With a skillful approach, he is on the shoulder of both multidimensional data analytics (OLAP-cubes), and solving a system of equations using matrices . And for those who have a certificate from Microsoft on the wall, there is an option to be confused even with 3D games . Not a Doom, of course, but it will take an evening.
What do you think about Excel as an admin tool? Have you ever used something from the above?
')
Source: https://habr.com/ru/post/350582/
All Articles