Own data in the system crash dump of Windows
By the nature of my activity (Windows Kernel), I regularly have to parse BSOD dumps. There are not single cases when the end-user successfully writes only mini-dumps, in which only the value of the processor registers and the drop stack are stored. There is simply no other way to debug the client machine. But what if the stack does not have our driver, and the customer insists that the crashes started after installing the product and ended after the driver of this product was turned off? In my case, a good solution was to keep a small log of the latest events in a circular buffer. It remains only to save this cyclic buffer in the dump.
Under the cut, I'll tell you how to add data from the driver to the dump. And then extract them using pykd .
Beginning with Windows XP SP1 and 2003 Server, the system provides drivers with the ability to add their own data to the kernel dump: Secondary Callback Data . In order for the system to request this data from the driver, you need to register your callback function by calling KeRegisterBugCheckReasonCallback . When registering, you need to specify the address of the function that will be called when the kernel crashes and, in our case ( BugCheckSecondaryDumpDataCallback ), provide data that you need to supplement the system dump. The specified callback function will be called twice:
- The first time the system calls the driver to determine the size of the buffer. Already at this stage in the input data of the OS indicates the maximum data size ( KBUGCHECK_SECONDARY_DUMP_DATA .MaximumAllowed), which can be stored in data. This size depends on the type of system dump that will be generated. In Windows XP, with the Mini-dump entry setting set, the system provides 4096 bytes (one page of memory).
- The second time the system requests the data itself.
Due to the fact that the callback function is called when the kernel of the operating system crashes, serious restrictions are imposed on the function code: do not use memory allocation (everything is allocated in advance), do not access Paged memory (page paging is impossible), do not use mechanisms synchronization (risk of deadlocks). More details can be found in the article MSDN Writing Bug Check Callback Routine .
Strangely enough, there is no example of using the KeRegisterBugCheckReasonCallback function in the collection of WDK examples . But the example was found in the open source Microsoft KMDF source code (Kernel-Mode Driver Framework) - fxbugcheckcallback.cpp :
// // The KeRegisterBugCheckReasonCallback exists for xp sp1 and above. So // check whether this function is defined on the current OS and register // for the bugcheck callback only if this function is defined. // RtlInitUnicodeString(&funcName, L"KeRegisterBugCheckReasonCallback"); funcPtr = (PFN_KE_REGISTER_BUGCHECK_REASON_CALLBACK) MmGetSystemRoutineAddress(&funcName); if (NULL == funcPtr) { goto Done; } // // Initialize the callback record. // KeInitializeCallbackRecord(callbackRecord); // // Register the bugcheck callback. // funcPtr(callbackRecord, FxpLibraryBugCheckCallback, KbCallbackSecondaryDumpData, (PUCHAR)WdfLdrType); ASSERT(callbackRecord->CallbackRoutine != NULL); VOID FxpLibraryBugCheckCallback( __in KBUGCHECK_CALLBACK_REASON Reason, __in PKBUGCHECK_REASON_CALLBACK_RECORD /* Record */, __inout PVOID ReasonSpecificData, __in ULONG ReasonSpecificLength ) /*++ Routine Description: Global (framework-library) BugCheck callback routine for WDF Arguments: Reason - Must be KbCallbackSecondaryData Record - Supplies the bugcheck record previously registered ReasonSpecificData - Pointer to KBUGCHECK_SECONDARY_DUMP_DATA ReasonSpecificLength - Sizeof(ReasonSpecificData) Return Value: None Notes: When a bugcheck happens the kernel bugcheck processor will make two passes of all registered BugCheckCallbackRecord routines. The first pass, called the "sizing pass" essentially queries all the callbacks to collect the total size of the secondary dump data. In the second pass the actual data is captured to the dump. --*/ { PKBUGCHECK_SECONDARY_DUMP_DATA dumpData; ULONG dumpSize; UNREFERENCED_PARAMETER(Reason); UNREFERENCED_PARAMETER(ReasonSpecificLength); ASSERT(ReasonSpecificLength >= sizeof(KBUGCHECK_SECONDARY_DUMP_DATA)); ASSERT(Reason == KbCallbackSecondaryDumpData); dumpData = (PKBUGCHECK_SECONDARY_DUMP_DATA) ReasonSpecificData; dumpSize = FxLibraryGlobals.BugCheckDriverInfoIndex * sizeof(FX_DUMP_DRIVER_INFO_ENTRY); // // See if the bugcheck driver info is more than can fit in the dump // if (dumpData->MaximumAllowed < dumpSize) { dumpSize = EXP_ALIGN_DOWN_ON_BOUNDARY( dumpData->MaximumAllowed, sizeof(FX_DUMP_DRIVER_INFO_ENTRY)); } if (0 == dumpSize) { goto Done; } // // Ok, provide the info about the bugcheck data. // dumpData->OutBuffer = FxLibraryGlobals.BugCheckDriverInfo; dumpData->OutBufferLength = dumpSize; dumpData->Guid = WdfDumpGuid2; Done:; } As a demonstration, it is this data that we will extract from the dump. The data is an array of structures FX_DUMP_DRIVER_INFO_ENTRY , each structure has in its fields the version and the name of the driver. The key to the data in the dump is the GUID specified when writing, in our case it is {F87E4A4C-C5A1-4d2f-BFF0-D5DE63A5E4C3} .
To view the data stored in the dump there is a command debugger. Enumtag . As a result of the command, we will see a raw memory dump. Here is an example of the data we are interested in:
1: kd> .enumtag {65755A40-F146-43EA-8C9136B85728FD35} - 0x0 bytes <...> {F87E4A4C-C5A1-4D2F-BFF0D5DE63A5E4C3} - 0x508 bytes 00 00 00 00 00 00 00 00 01 00 00 00 0D 00 00 00 ................ 00 00 00 00 57 64 66 30 31 30 30 30 00 00 00 00 ....Wdf01000.... 00 00 00 00 00 00 00 00 00 00 00 00 00 00 00 00 ................ 00 00 00 00 00 00 00 00 90 AC 55 00 00 E0 FF FF ..........U..... 01 00 00 00 0B 00 00 00 00 00 00 00 61 63 70 69 ............acpi 65 78 00 00 00 00 00 00 00 00 00 00 00 00 00 00 ex.............. 00 00 00 00 00 00 00 00 00 00 00 00 00 00 00 00 ................ 30 81 F6 00 00 E0 FF FF 01 00 00 00 0B 00 00 00 0............... 00 00 00 00 6D 73 69 73 61 64 72 76 00 00 00 00 ....msisadrv.... 00 00 00 00 00 00 00 00 00 00 00 00 00 00 00 00 ................ 00 00 00 00 00 00 00 00 A0 D3 EB 00 00 E0 FF FF ................ 01 00 00 00 0B 00 00 00 00 00 00 00 76 64 72 76 ............vdrv <...> Working with this format is possible, but not convenient. Microsoft offers to write your extension to the debugger :
It is recommended that you use your own debugger extension.
But I am one of the developers of the pykd project. The pykd module can be a debugger extension that allows you to use Python to automate debugging. Therefore, I will show how to extract and visualize data with it. At once I will make a reservation that the transfer and retrieval of the Secondary Callback Data was added in the latest (at the time of writing) release - 0.3.3.3. Therefore, if you have an older version already installed, you need to upgrade pykd ( Last Release ).
As a test dump, I will use the file used for pykd unit tests - win8_x64_mem.cab
Actually, the whole script is reading and formatting data:
import os import sys import pykd import struct def print_command(command): if pykd.getDebugOptions() & pykd.debugOptions.PreferDml: pykd.dprint( '<exec cmd="{}">{}</exec>'.format(command, command), dml = True ) else: pykd.dprint( command ) def parse(): buff = bytearray( pykd.loadTaggedBuffer("F87E4A4C-C5A1-4d2f-BFF0-D5DE63A5E4C3") ) entry_type = pykd.typeInfo("Wdf01000!_FX_DUMP_DRIVER_INFO_ENTRY") _struct = struct.Struct( "<{}III".format("Q" if pykd.is64bitSystem() else "L") ) name_offset = entry_type.fieldOffset("DriverName") name_size = entry_type.DriverName.size() entry_size = entry_type.size() if len(buff) % entry_size: raise RuntimeError( "The buffer size ({}) is not a multiple of entry size ({})".format(len(buff), entry_size) ) print("[FxLibraryGlobals.BugCheckDriverInfo]") while len(buff): ptr, mj, mn, build = _struct.unpack_from(buff) name = str(buff[name_offset : name_offset + name_size]).strip("\0") command = "!drvobj {} 7".format(name) print_command( command ) pykd.dprint( " " * (24 - len(name)) ) pykd.dprint( " {:12} ".format("({}.{}.{})".format(mj, mn, build)) ) if ptr: command = "dx ((Wdf01000!{})0x{:x})".format(entry_type.FxDriverGlobals.name(), ptr) print_command( command ) pykd.dprintln( "" ) buff = buff[entry_size:] if __name__ == "__main__": if len(sys.argv) == 1: parse() else: for file_name in sys.argv[1:]: print(file_name) dump_id = pykd.loadDump(file_name) parse() pykd.closeDump(dump_id) The contents of the skipt, in my opinion, is quite simple (parse function):
- By calling pykd.loadTaggedBuffer, we read the contents of the saved data, specifying the GUID as a string argument.
- Using information from the debugging symbols (creating an instance of the pykd.typeInfo object), we get the offset to the driver name (name_offset), the driver name buffer size (name_size), and the size of a single structure FX_DUMP_DRIVER_INFO_ENTRY (entry_size).
- For each structure FX_DUMP_DRIVER_INFO_ENTRY in the read buffer, use the standard python module struct to unpack the structure fields containing a pointer to the global driver object and version. And then we get the name of the driver, converting it into a string, discarding 0-characters. And we print the received data using DML , if the current environment allows using this markup language (the print_command function).
Execute the script in the WinDbg debugger: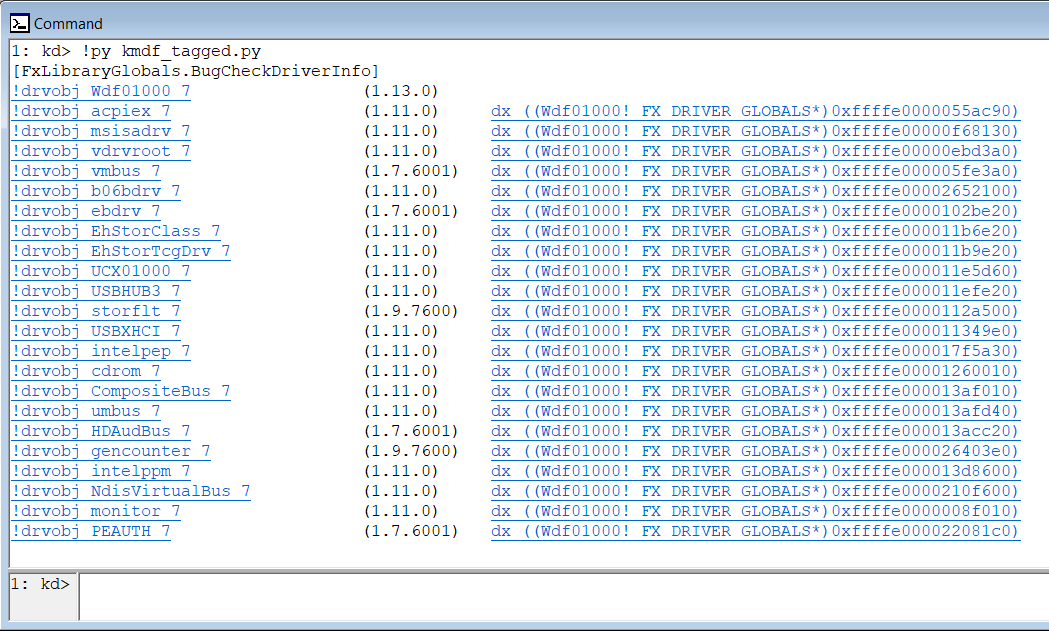
If you look at the contents of the script after the parse function, you will notice that the script can take an argument. The kmdf_tagged.py script is written to demonstrate how to work offline (outside the debugger) if it is given a command line argument. Each argument passed to the script treats as a path in the dump file, loads this dump and extracts target data from it. In particular, the script can in a batch mode process the dump files:
~> for /R .\dumps %i in (*.*) do @python.exe kmdf_tagged.py %i ~\dumps\win8_x64_mem.cab [FxLibraryGlobals.BugCheckDriverInfo] !drvobj Wdf01000 7 (1.13.0) !drvobj acpiex 7 (1.11.0) dx ((Wdf01000!_FX_DRIVER_GLOBALS*)0xffffe0000055ac90) <...> !drvobj PEAUTH 7 (1.7.6001) dx ((Wdf01000!_FX_DRIVER_GLOBALS*)0xffffe000022081c0) ~\dumps\win8_x64_mem2.cab [FxLibraryGlobals.BugCheckDriverInfo] !drvobj Wdf01000 7 (1.13.0) !drvobj acpiex 7 (1.11.0) dx ((Wdf01000!_FX_DRIVER_GLOBALS*)0xffffe0000055ac90) <...> !drvobj PEAUTH 7 (1.7.6001) dx ((Wdf01000!_FX_DRIVER_GLOBALS*)0xffffe000022081c0) I hope that my experience (and the contents of this article) will be useful to someone. And the number of BSODs, the cause of which remains a mystery, will tend to 0.
')
Source: https://habr.com/ru/post/350406/
All Articles