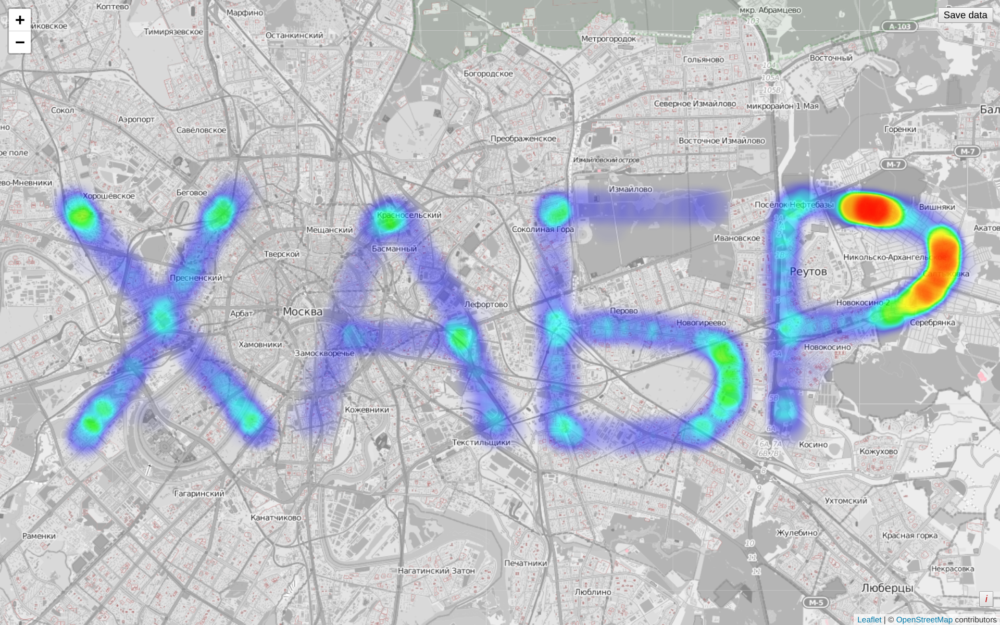
Heatmap painter

Heat map is a cartogram that visually shows the intensity of a point indicator within the territory on the map. Intensity is coded by color and transparency. Surely you have seen such pictures more than once. So, what if you need to make such a cartogram, but you don’t have the data on hand. Heatmap Painter will allow you to interactively transfer data to a map and save the result for future use. The thing is very interesting and can be useful to many people: developers, analysts, designers. Read on how it works and how to use it.
How does it work
Under the hood JavaScript: Leaflet library and Leaflet.heat plugin. We have an array where we can add equivalent (by weight / intensity) points. Points can be deleted. When drawn, an array with coordinates can be saved as JSON. Sources on githab: heatmap-painter . The Leaflet.heat plug- in has various visual display settings: point radius, intensity, blur, gradient (color scheme). Now, if the default settings are not satisfied, it needs to be edited in the code, but if all of a sudden these options are in demand, I will bring them into a separate control. Yes, do not forget to limit the zoom of the map so that it cannot be increased to individual points, or there may be questions about "strange patterns". Or make noise when adding points.
How to use
To add points, hold down the space bar and move the mouse. To delete points, hold down the Ctrl key and also move the mouse. In the upper right corner save button. The saved file can be dragged using drag'n drop . In the hash, you can set the zoom level and the coordinates of the center of the map. That's all.
Usage scenarios
Developer Analyst
An urgent task, after 4 hours an unscheduled meeting with the customer, there is no real data yet, and there will not be until tomorrow. We need at least plausible screenshots, and better demo prototype. You sit down, charge coffee creative and in 30 minutes give the result.
Development Analyst Manager
You are already thinking how to justify to the customer for unintelligible screenshots. And here the link to the demo arrives in the messenger. After 5 minutes, you are already at the analyst-developer and jointly correct the "plausible" data. Now you know how to draw a beautiful screenshot in the presentation.
Designer
You read the article on Habré and now you know how to make a beautiful picture with a heat map for your cool layout. Yes, and there will be the city you need, and not what you found in Google.
Copter Operator
You had the idea to draw something on the ground / roof and remove it from the copter. Where to estimate the coordinates you now know.
Write your own ideas for use in the comments.
')
Source: https://habr.com/ru/post/350248/
All Articles