Monitoring system organization
Monitoring is the main thing that the admin has. Admins are needed for monitoring, and monitoring is needed for admins.

Over the past few years, the monitoring paradigm itself has changed. A new era has already arrived, and if now you are monitoring the infrastructure as a set of servers, you are not monitoring almost anything. Because now “infrastructure” is a multi-layered architecture, and there are tools for monitoring each level.
In addition to problems like "server fell", "you need to replace the screw in the raid", now you need to understand the problems of the application level and business level: "interaction with microservice is so slowed down", "there are too few messages in the queue for the current time", "execution time requests to the database in the application grows, requests - such and such. "
We support about five thousand servers in a variety of configurations: from systems of three servers with custom Docker networks, to large projects with hundreds of servers in Kubernetes. And we need to somehow monitor all of this, understand in time that something has broken and quickly repaired. To do this, we need to understand what monitoring is, how it is built in modern realities, how to design it and what it should do. About this and I would like to tell.
As it was before
Ten years ago monitoring was much easier than now. However, the applications were simpler.
Mainly monitored system indicators: CPU, memory, disks, network. This was quite enough, because there was one application spinning on php, and nothing else was used. The problem is that according to such indicators there is usually little that can be said. Either working or not. What exactly happens to the application itself is difficult to understand above the level of system indicators.
If the problem was at the application level (not just “the site is not working”, but “the site is working, but something is wrong”), then the client himself wrote or called, informed that there was such a problem, we went and understood, because we ourselves could not notice such problems.
Like now
Now there are completely different systems: with scaling, autoscaling, microservices, dockers. Systems have become dynamic. Often, no one really knows exactly how everything works, on how many servers, how exactly it is deployed. It lives its own life. Sometimes it is even unknown what and where is running (if it is Kubernetes, for example).
The increasing complexity of the systems themselves, of course, entailed a greater number of possible problems. Appeared application metrics, the number of threads running in a Java application, the frequency of garbage collector pauses, the number of events in the queue. It is very important that monitoring also monitors system scaling. Suppose you have Kubernetes HPA. It is necessary to understand how many pods are launched, and from each pod launched there should be metrics to the application monitoring system, to apm.
All this needs to be monitored, because all this is reflected in the operation of the system.
And the problems themselves became less obvious.
Conventionally, the problems can be divided into two large groups:
Problems of the first kind - the basic, “user functionality” does not work.
Problems of the second kind - something does not work as it should, and can lead somewhere not there.
That is, now it is necessary to monitor not only the discrete “works / does not work”, but much more gradations. Which, in turn, allows you to catch the problem before everything collapses.
In addition, it is now necessary to monitor the business performance. The business wanted to have charts about money, how often orders go, how much time has passed since the last order, and so on - this is now also the task of monitoring.
Proper monitoring
Design and generally
The idea of what exactly needs to be monitored should be laid at the time of developing the application and architecture, and it’s not so much about the server architecture as about the architecture of the application as a whole.
Developers / architects should understand which parts of the system are critical for the operation of the project and business, and think in advance that their performance should be checked.
Monitoring should be convenient for the admin, and give an idea of what is happening. The purpose of monitoring is to receive an alert in time, quickly understand from schedules what is happening and what needs to be repaired.
Metrics and alerts (alerts)
Alerts should be as clear as possible: the administrator, having received an alert, even if he is not familiar with the system, must understand what this alert is about, what documentation to look at, or at least whom to call. There should be clear instructions on what to do and how to solve the problem.
When a problem occurs, I really want to understand what caused it. Receiving an alert that the application does not work for you, you would very much like to know what other related systems behave differently, what other deviations from the norm there are. There should be clear graphics collected in dashboards, from which you will immediately see where the deviation is.
To do this, you need to understand exactly what is normal and what is not normal. That is, there must be sufficient historical information about the state of the system. The task is to cover all possible deviations from the norm with alerts.
When an admin receives an alert, he either needs to know what to do with it, or who to ask. There should be an instruction on how exactly to react, and it should be regularly updated. If everything works for you through the orchestration system, then probably you are fine, if all changes occur only through it, including monitoring. The orchestration system allows you to adequately monitor the relevance of monitoring.
Monitoring should be expanded after each accident - if suddenly there is some problem that has slipped past monitoring, then obviously it is necessary to monitor this situation so that the next time the problem is not sudden.
Business performance
It is useful to monitor the time from the last sale, the number of sales for the period. If you posted a release, then what has changed: is there a drawdown on business indicators? This is answered, of course, by A / B testing, but I would also like to have graphics. And it is necessary to monitor the actions of the end user: write scripts on phantomjs, which repeat the purchase, go through all stages of the main business process.
Also, you are probably interested to know whether the logistics service is working, or whether IpGeoBase has failed once again. (Editor's comment: IpGeoBase is a service that uses a large number of online stores on 1C-Bitrix to determine the user's location. Most often, this is done directly in the page load code, and when IpGeoBase falls, dozens of websites stop responding. Someone please , tell the programmers that this needs to be processed and timed out, and someone - please ask IpGeoBase not to fall).
It is necessary to understand whether the drawdown of business indicators depends on your system, or on the external one.
Monitoring monitoring
The monitoring itself should also be monitored somehow. There should be some external custom script that will check that monitoring is working properly. No one wants to wake up from the call, because your monitoring system has dropped along with the entire data center, and nobody has told you about it.
Basic tools
In modern systems that scale, you probably use Prometheus, because there are no analogues in principle. In order to view convenient graphics from Prometheus, Grafana is needed, because in Prometheus, graphics are so-so. We also need some kind of APM. Either this is a self-written system on Open Trace, jaeger, or something like that. But it rarely does. Mostly used is either New Relic, or specific systems for stacks, such as Dripstat. If you have more than one monitoring system, not one Zabbix, you still need to understand how to collect these metrics and how to distribute alerts; whom to notify, whom to raise, in what order, to whom what alert belongs, and what to do with it in general.
Now in order.
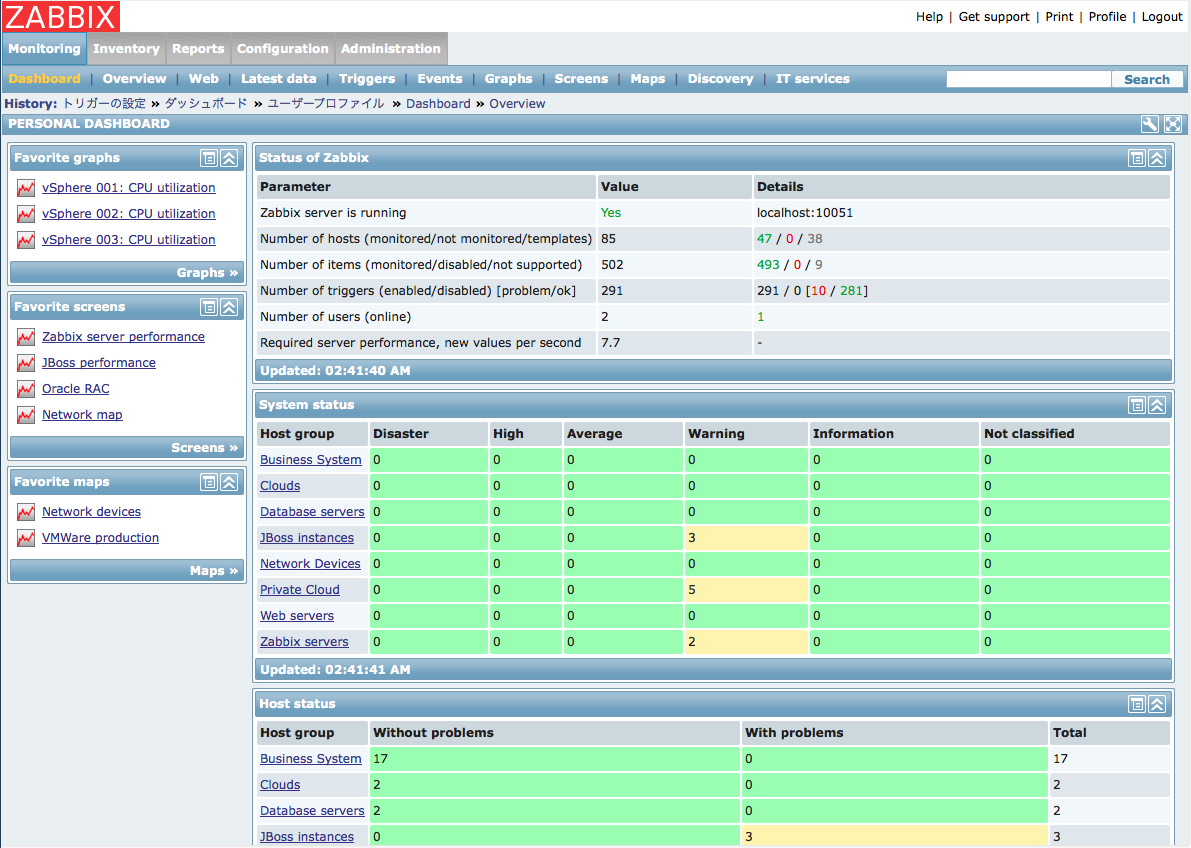
Zabbix is not the most convenient system. There are problems with custom metrics, especially if the system is scaled, and you need to define roles. And although you can build very custom charts, alerts and dashboards, all this is not very inconvenient and non-dynamic. This is a static monitoring system.
Prometheus is a great solution for building a huge number of metrics. He has about the same opportunities as Zabbix for custom alerts. You can display graphs and build alerts for any wild combinations of several parameters. And all this is very cool, but very uncomfortable to watch, so Grafana is added to it. Grafana is very beautiful. But by itself, it does not really help to monitor systems. But on it is convenient to read everything. Better charts, probably not.

ELK and Graylog - to collect logs for events in the application. It may be useful for developers, but for detailed analytics is usually not enough.

New Relic - APM, also useful for developers. It is possible to understand when something is wrong in your application right now. It is clear which of the external services do not work very well, or which of the bases is slowly responding, or which system interaction is squandering.

Your APM - if you wrote your system on Open Tracing, zipkin or jaeger, then you probably know exactly how this should work, and what exactly, and in which part of the code goes wrong. New Relic also allows you to understand this, but it is not always convenient.
Conclusion
It is better to think about what indicators should be monitored during the system design, to think in advance about which parts of the system are critical for its work and how to check their work.
Alerts should not be too many, alerts should be relevant. It should be immediately clear what was broken and how to fix it.
In order to properly monitor business indicators, you need to understand how business processes are organized, what your analysts need, whether there are enough tools to measure the necessary indicators, and how quickly you can find out if something goes wrong.
In the next post we will describe how to properly plan the monitoring of modern infrastructure, at all levels: at the system, application and business levels.
')
Source: https://habr.com/ru/post/350200/
All Articles