You may not need Rust to speed up your JS
A few weeks ago, I discovered the post "Oxidize Source Maps with Rust and WebAssembly"
spreading on Twitter and telling about performance gains from replacing regular JavaScript in the source-map library with Rust compiled into WebAssembly.
Post excited my interest not because I was a big fan of Rust or WASM, rather because I was always interested in the features of languages and optimizations that Javascript lacks in order to achieve similar performance.
So I downloaded the library from GitHub and went into a little performance study, which I document here almost verbatim.
Content
- Getting the code
- We profile the version on pure JavaScript
- Optimizing sorting - Adapting arguments
- Optimizing sorting - Monomorphization
- We optimize analysis - We delete a cache of segments
- Optimizing sorting - Improvements in algorithms
- Optimizing the sort of generatedMappings
- Optimizing parsing - Reducing the load on the GC
- Optimizing parsing - Using Uint8Array instead of string
- General improvements from start
- Comparison with the "oxidized" version of the source-map
- Lessons learned
- Afterword
Getting the code
For my research, I use an almost standard x64.release V8 build, with committer 69abb960c97606df99408e6869d66e014aa0fb51 of January 20th. My discrepancy with the standard configuration is only that I turned on the disassembler through the GN-flags in order to dive deeper into the generated machine code, if necessary.
╭─ ~/src/v8/v8 ‹master› ╰─$ gn args out.gn/x64.release --list --short --overrides-only is_debug = false target_cpu = "x64" use_goma = true v8_enable_disassembler = true Then I got the source code for the source-map module from:
- the c97d38b commit , which was the last to update
dist/source-map.jsbefore the Rust / WASM implementation; - commit 51cf770 , which was the last commit at the time of the study;
We profile the version on pure JavaScript
Running the benchmark for a clean JS version was simple:
╭─ ~/src/source-map/bench ‹ c97d38b› ╰─$ d8 bench-shell-bindings.js Parsing source map console.timeEnd: iteration, 4655.638000 console.timeEnd: iteration, 4751.122000 console.timeEnd: iteration, 4820.566000 console.timeEnd: iteration, 4996.942000 console.timeEnd: iteration, 4644.619000 [Stats samples: 5, total: 23868 ms, mean: 4773.6 ms, stddev: 161.22112144505135 ms] The first thing I did was turn off the serialization part of the benchmark:
diff --git a/bench/bench-shell-bindings.js b/bench/bench-shell-bindings.js index 811df40..c97d38b 100644 --- a/bench/bench-shell-bindings.js +++ b/bench/bench-shell-bindings.js @@ -19,5 +19,5 @@ load("./bench.js"); print("Parsing source map"); print(benchmarkParseSourceMap()); print(); -print("Serializing source map"); -print(benchmarkSerializeSourceMap()); +// print("Serializing source map"); +// print(benchmarkSerializeSourceMap()); Then I threw it into the Linux perf profiler:
╭─ ~/src/source-map/bench ‹perf-work› ╰─$ perf record -g d8 --perf-basic-prof bench-shell-bindings.js Parsing source map console.timeEnd: iteration, 4984.464000 ^C[ perf record: Woken up 90 times to write data ] [ perf record: Captured and wrote 24.659 MB perf.data (~1077375 samples) ] Notice that I pass the --perf-basic-prof flag to the d8 binary, which causes V8 to generate an auxiliary mapping file /tmp/perf-$pid.map . This file allows perf report to understand JIT-generated machine code.
This is what I get from the perf report --no-children later when viewing the main thread of performance:
Overhead Symbol 17.02% *doQuickSort ../dist/source-map.js:2752 11.20% Builtin:ArgumentsAdaptorTrampoline 7.17% *compareByOriginalPositions ../dist/source-map.js:1024 4.49% Builtin:CallFunction_ReceiverIsNullOrUndefined 3.58% *compareByGeneratedPositionsDeflated ../dist/source-map.js:1063 2.73% *SourceMapConsumer_parseMappings ../dist/source-map.js:1894 2.11% Builtin:StringEqual 1.93% *SourceMapConsumer_parseMappings ../dist/source-map.js:1894 1.66% *doQuickSort ../dist/source-map.js:2752 1.25% v8::internal::StringTable::LookupStringIfExists_NoAllocate 1.22% *SourceMapConsumer_parseMappings ../dist/source-map.js:1894 1.21% Builtin:StringCharAt 1.16% Builtin:Call_ReceiverIsNullOrUndefined 1.14% v8::internal::(anonymous namespace)::StringTableNoAllocateKey::IsMatch 0.90% Builtin:StringPrototypeSlice 0.86% Builtin:KeyedLoadIC_Megamorphic 0.82% v8::internal::(anonymous namespace)::MakeStringThin 0.80% v8::internal::(anonymous namespace)::CopyObjectToObjectElements 0.76% v8::internal::Scavenger::ScavengeObject 0.72% v8::internal::String::VisitFlat<v8::internal::IteratingStringHasher> 0.68% *SourceMapConsumer_parseMappings ../dist/source-map.js:1894 0.64% *doQuickSort ../dist/source-map.js:2752 0.56% v8::internal::IncrementalMarking::RecordWriteSlow Indeed, as mentioned in the post “Oxidize Source Maps ...” , this benchmark basically loads sorting: the doQuickSort function appears on the top of the profile, and also several times lower in the list (which means that it has been optimized and deoptimized several times) .
We optimize sorting - adaptation of arguments
One thing that stands out in the profiler is suspicious entries, namely Builtin:ArgumentsAdaptorTrampoline and Builtin:CallFunction_ReceiverIsNullOrUndefined , which seem to be part of the V8 implementation. If we ask perf report to reveal the call chains leading to them, we note that these functions are mainly called from the sort code:
- Builtin:ArgumentsAdaptorTrampoline + 96.87% *doQuickSort ../dist/source-map.js:2752 + 1.22% *SourceMapConsumer_parseMappings ../dist/source-map.js:1894 + 0.68% *SourceMapConsumer_parseMappings ../dist/source-map.js:1894 + 0.68% Builtin:InterpreterEntryTrampoline + 0.55% *doQuickSort ../dist/source-map.js:2752 - Builtin:CallFunction_ReceiverIsNullOrUndefined + 93.88% *doQuickSort ../dist/source-map.js:2752 + 2.24% *SourceMapConsumer_parseMappings ../dist/source-map.js:1894 + 2.01% Builtin:InterpreterEntryTrampoline + 1.49% *SourceMapConsumer_parseMappings ../dist/source-map.js:1894 And here is the time to look at the code. The quick sort implementation is located in lib/quick-sort.js and is called from the parser code in lib/source-map-consumer.js .
The comparison functions (comparators) used for sorting are compareByGeneratedPositionsDeflated and compareByOriginalPositions .
Looking at the definitions of these comparison functions and on the way they are called in the quick sort implementation, it turns out that the call sites have a different arity:
function compareByOriginalPositions(mappingA, mappingB, onlyCompareOriginal) { // ... } function compareByGeneratedPositionsDeflated(mappingA, mappingB, onlyCompareGenerated) { // ... } function doQuickSort(ary, comparator, p, r) { // ... if (comparator(ary[j], pivot) <= 0) { // ... } // ... } Browsing library sources shows that, outside of tests, quickSort is called only with these two functions.
What if we correct the arity?
diff --git a/dist/source-map.js b/dist/source-map.js index ade5bb2..2d39b28 100644 --- a/dist/source-map.js +++ b/dist/source-map.js @@ -2779,7 +2779,7 @@ return /* **** */ (function(modules) { // webpackBootstrap // // * Every element in `ary[i+1 .. j-1]` is greater than the pivot. for (var j = p; j < r; j++) { - if (comparator(ary[j], pivot) <= 0) { + if (comparator(ary[j], pivot, false) <= 0) { i += 1; swap(ary, i, j); } [Note: I am editing directly to dist/source-map.js because I didn’t want to waste time on the build process]
╭─ ~/src/source-map/bench ‹perf-work› [Fix comparator invocation arity] ╰─$ d8 bench-shell-bindings.js Parsing source map console.timeEnd: iteration, 4037.084000 console.timeEnd: iteration, 4249.258000 console.timeEnd: iteration, 4241.165000 console.timeEnd: iteration, 3936.664000 console.timeEnd: iteration, 4131.844000 console.timeEnd: iteration, 4140.963000 [Stats samples: 6, total: 24737 ms, mean: 4122.833333333333 ms, stddev: 132.18789657150916 ms] By simply correcting the arity mismatch, we improved the V8 values in the benchmark by 14% from 4774 ms to 4123 ms. If we profile the benchmark again, we will find that the ArgumentsAdaptorTrampoline completely disappeared from there. So why was he there for the first time?
It turns out that ArgumentsAdaptorTrampoline is a V8 mechanism for supporting javascript script variability: you can call a function from three arguments with only two - in this case the third argument will be filled with the value undefined . V8 does this by creating a new frame on the stack, copying the arguments there, then calling the target function:
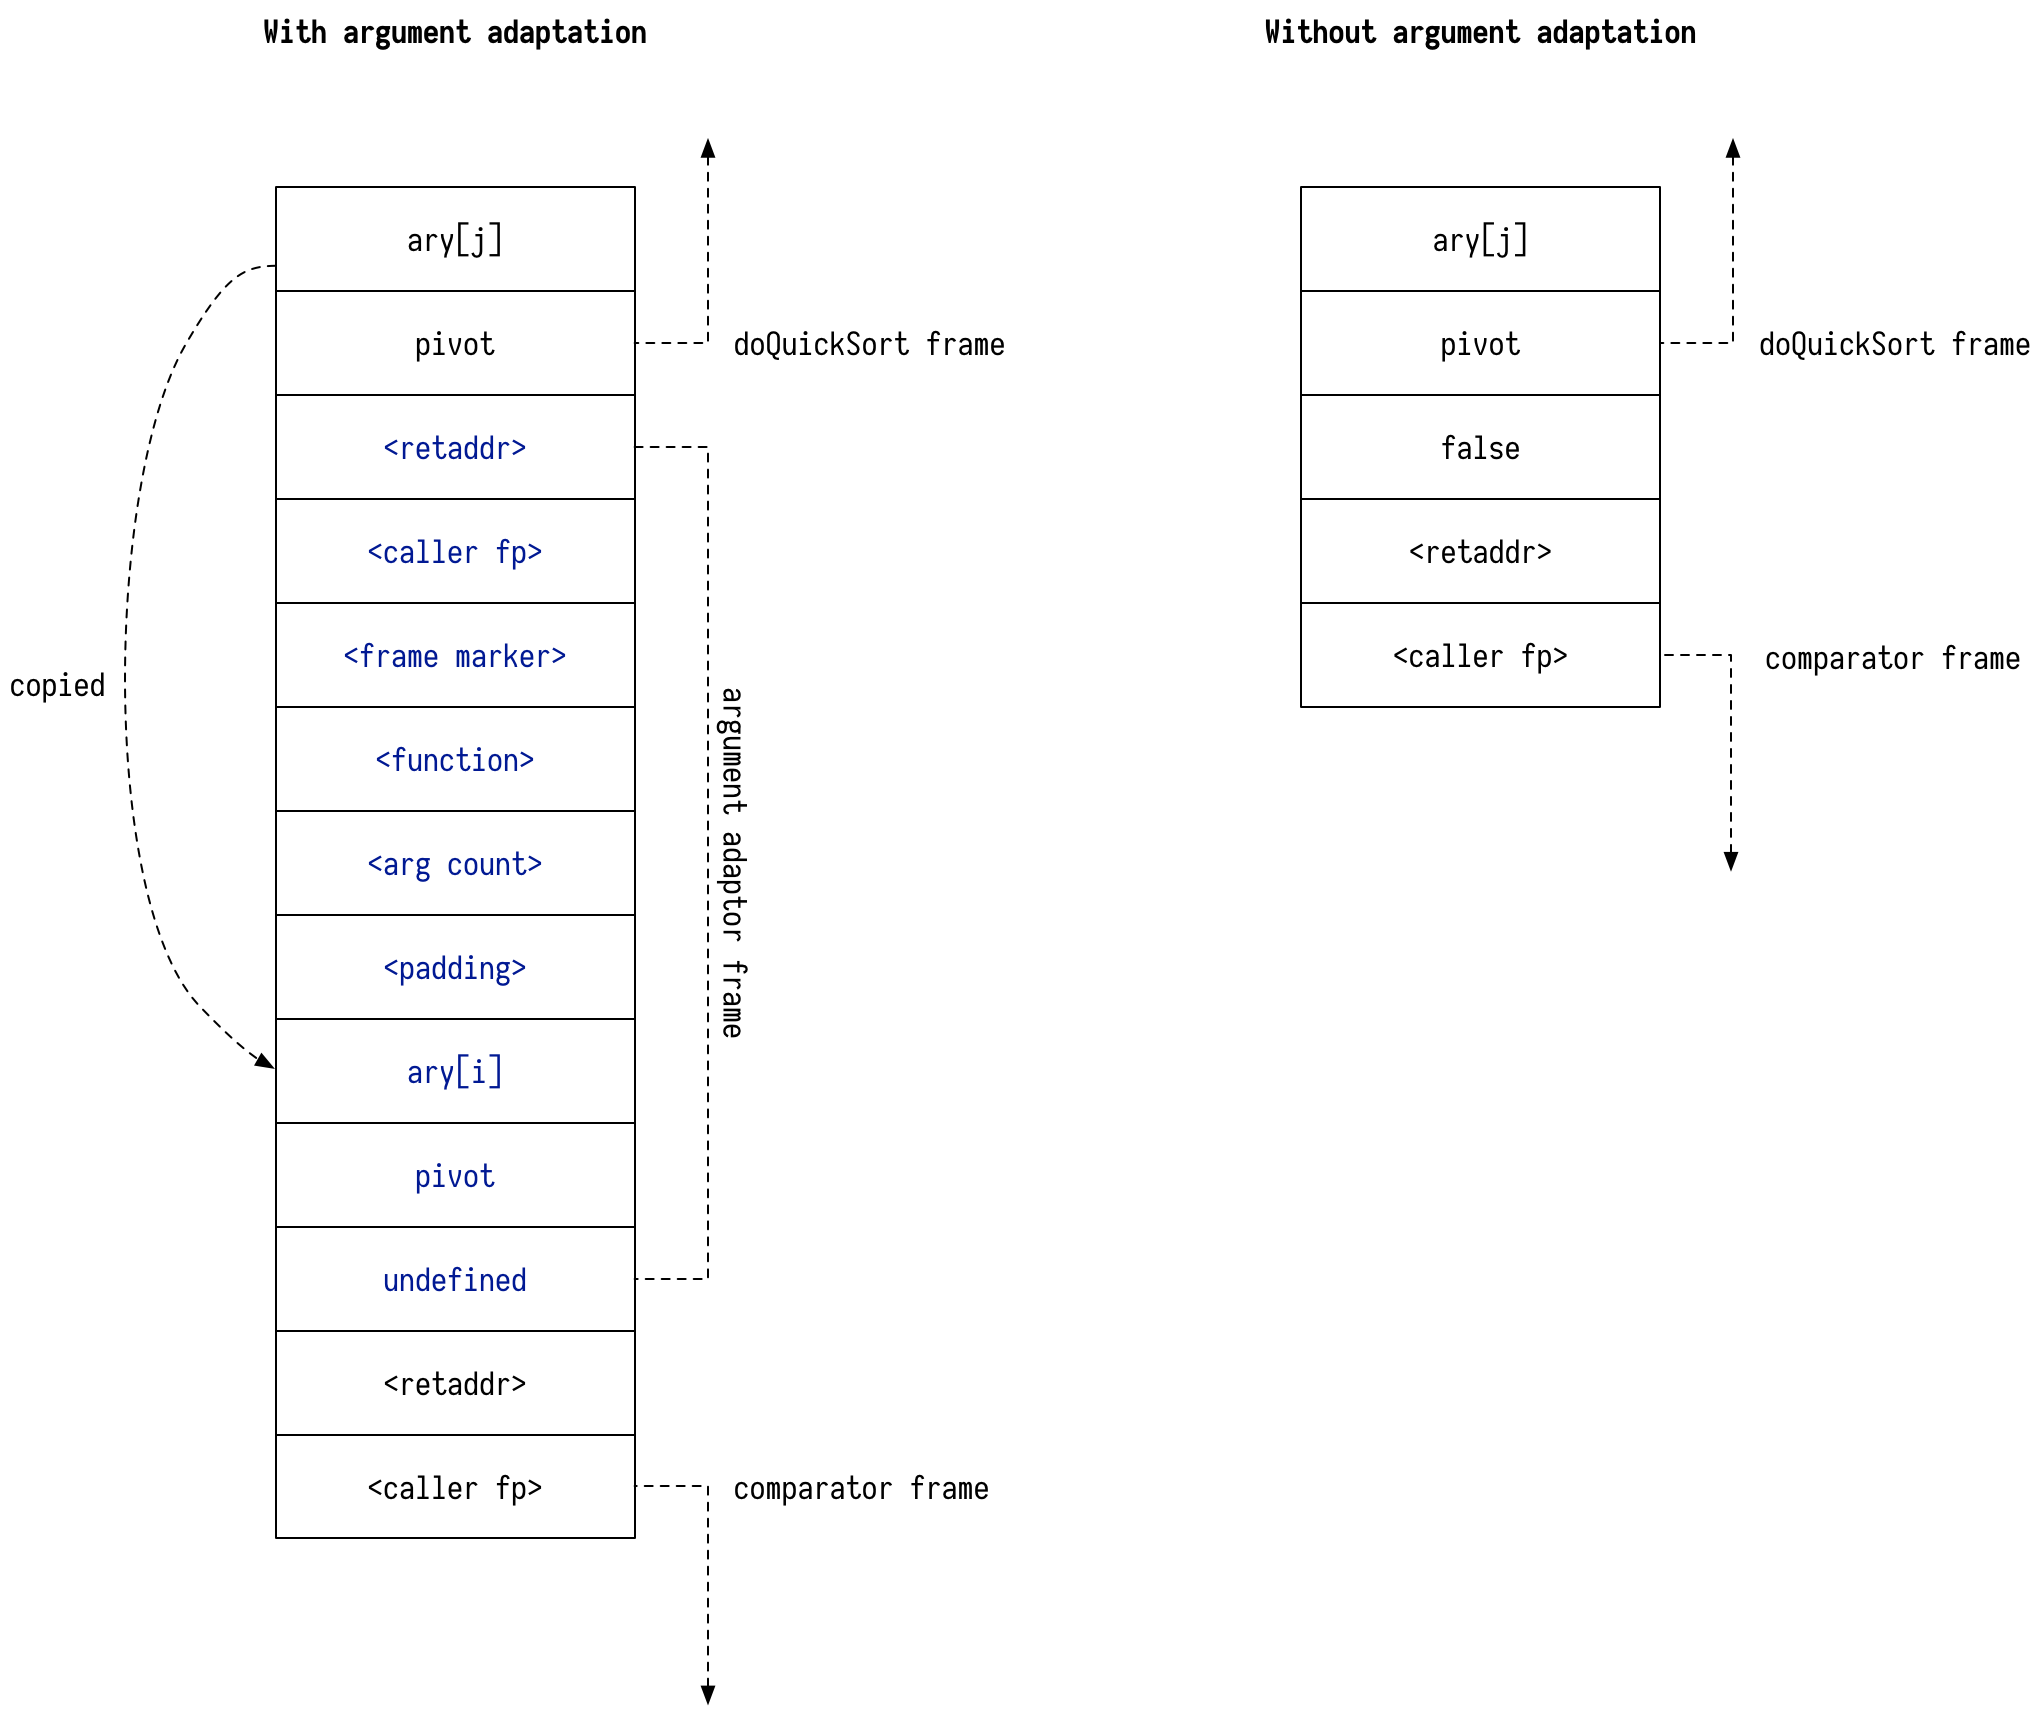
[If you’ve never heard of a performance stack , check out Wikipedia and the post of Francis Hinkelmann.]
While such costs may be insignificant for a cold code, here the comparator was called a million times during the launch of the benchmark, which caused additional costs for the adaptation of the arguments.
An attentive reader may also notice that we explicitly pass false to where previously implicit undefined . This also seems to contribute to improved performance. If we replace false with void 0 , we get slightly worse values:
diff --git a/dist/source-map.js b/dist/source-map.js index 2d39b28..243b2ef 100644 --- a/dist/source-map.js +++ b/dist/source-map.js @@ -2779,7 +2779,7 @@ return /* **** */ (function(modules) { // webpackBootstrap // // * Every element in `ary[i+1 .. j-1]` is greater than the pivot. for (var j = p; j < r; j++) { - if (comparator(ary[j], pivot, false) <= 0) { + if (comparator(ary[j], pivot, void 0) <= 0) { i += 1; swap(ary, i, j); } ╭─ ~/src/source-map/bench ‹perf-work U› [Fix comparator invocation arity] ╰─$ ~/src/v8/v8/out.gn/x64.release/d8 bench-shell-bindings.js Parsing source map console.timeEnd: iteration, 4215.623000 console.timeEnd: iteration, 4247.643000 console.timeEnd: iteration, 4425.871000 console.timeEnd: iteration, 4167.691000 console.timeEnd: iteration, 4343.613000 console.timeEnd: iteration, 4209.427000 [Stats samples: 6, total: 25610 ms, mean: 4268.333333333333 ms, stddev: 106.38947316346669 ms] Be that as it may, the adaptation of the arguments seems very specific to the V8. When I ran the benchmark for SpiderMonkey, I did not see any significant performance gain from matching arity:
╭─ ~/src/source-map/bench ‹ d052ea4› [Disabled serialization part of the benchmark] ╰─$ sm bench-shell-bindings.js Parsing source map [Stats samples: 8, total: 24751 ms, mean: 3093.875 ms, stddev: 327.27966571700836 ms] ╭─ ~/src/source-map/bench ‹perf-work› [Fix comparator invocation arity] ╰─$ sm bench-shell-bindings.js Parsing source map [Stats samples: 8, total: 25397 ms, mean: 3174.625 ms, stddev: 360.4636187025859 ms] [The SpiderMonkey shell is now very easy to install, thanks to Matthias Bayens for the jsvu tool ]
Let's go back to the sort code. If we populate the benchmark again, we notice that the ArgumentsAdaptorTrampoline disappeared from the profile, but CallFunction_ReceiverIsNullOrUndefined is still here. This is not surprising, because we still call the comparator .
Optimizing sorting - Monomorphization
What usually executes faster than a function call? His absence!
The obvious option here is to try to embed the comparison function in doQuickSort . However, we are getting in the way of the fact that doQuickSort is called with different functions.
To get around this, we will try to monomorphize doQuickSort by cloning. Here is how we do it.
Let's start with wrapping doQuickSort and other utility tools in the SortTemplate function:
function SortTemplate(comparator) { function swap(ary, x, y) { // ... } function randomIntInRange(low, high) { // ... } function doQuickSort(ary, p, r) { // ... } return doQuickSort; } Then we will be able to produce clones of our sorting procedures by converting the SortTemplate to a string, passing it and parsing it back to a function through the Function constructor:
function cloneSort(comparator) { let template = SortTemplate.toString(); let templateFn = new Function(`return ${template}`)(); return templateFn(comparator); // Invoke template to get doQuickSort } Now we can use cloneSort to produce a sort function for each comparator used:
let sortCache = new WeakMap(); // Cache for specialized sorts. exports.quickSort = function (ary, comparator) { let doQuickSort = sortCache.get(comparator); if (doQuickSort === void 0) { doQuickSort = cloneSort(comparator); sortCache.set(comparator, doQuickSort); } doQuickSort(ary, 0, ary.length - 1); }; Restarting the benchmark gives us:
╭─ ~/src/source-map/bench ‹perf-work› [Clone sorting functions for each comparator] ╰─$ d8 bench-shell-bindings.js Parsing source map console.timeEnd: iteration, 2955.199000 console.timeEnd: iteration, 3084.979000 console.timeEnd: iteration, 3193.134000 console.timeEnd: iteration, 3480.459000 console.timeEnd: iteration, 3115.011000 console.timeEnd: iteration, 3216.344000 console.timeEnd: iteration, 3343.459000 console.timeEnd: iteration, 3036.211000 [Stats samples: 8, total: 25423 ms, mean: 3177.875 ms, stddev: 181.87633161024556 ms] We see that the average time has dropped from 4268 ms to 3177 ms (25% improvement).
Profiling shows the following picture:
Overhead Symbol 14.95% *doQuickSort :44 11.49% *doQuickSort :44 3.29% Builtin:StringEqual 3.13% *SourceMapConsumer_parseMappings ../dist/source-map.js:1894 1.86% v8::internal::StringTable::LookupStringIfExists_NoAllocate 1.86% *SourceMapConsumer_parseMappings ../dist/source-map.js:1894 1.72% Builtin:StringCharAt 1.67% *SourceMapConsumer_parseMappings ../dist/source-map.js:1894 1.61% v8::internal::Scavenger::ScavengeObject 1.45% v8::internal::(anonymous namespace)::StringTableNoAllocateKey::IsMatch 1.23% Builtin:StringPrototypeSlice 1.17% v8::internal::(anonymous namespace)::MakeStringThin 1.08% Builtin:KeyedLoadIC_Megamorphic 1.05% v8::internal::(anonymous namespace)::CopyObjectToObjectElements 0.99% v8::internal::String::VisitFlat<v8::internal::IteratingStringHasher> 0.86% clear_page_c_e 0.77% v8::internal::IncrementalMarking::RecordWriteSlow 0.48% Builtin:MathRandom 0.41% Builtin:RecordWrite 0.39% Builtin:KeyedLoadIC The overhead costs associated with calling the comparator now completely disappeared from the profile.
At this point, I wondered how much more time we spend on parsing mappings compared to sorting them. I went to the parsing code and added a few calls to Date.now() :
[I’d like to add performance.now() , but SpiderMonkey doesn’t support this.]
diff --git a/dist/source-map.js b/dist/source-map.js index 75ebbdf..7312058 100644 --- a/dist/source-map.js +++ b/dist/source-map.js @@ -1906,6 +1906,8 @@ return /* **** */ (function(modules) { // webpackBootstrap var generatedMappings = []; var mapping, str, segment, end, value; + + var startParsing = Date.now(); while (index < length) { if (aStr.charAt(index) === ';') { generatedLine++; @@ -1986,12 +1988,20 @@ return /* **** */ (function(modules) { // webpackBootstrap } } } + var endParsing = Date.now(); + var startSortGenerated = Date.now(); quickSort(generatedMappings, util.compareByGeneratedPositionsDeflated); this.__generatedMappings = generatedMappings; + var endSortGenerated = Date.now(); + var startSortOriginal = Date.now(); quickSort(originalMappings, util.compareByOriginalPositions); this.__originalMappings = originalMappings; + var endSortOriginal = Date.now(); + + console.log(`${}, ${endSortGenerated - startSortGenerated}, ${endSortOriginal - startSortOriginal}`); + console.log(`sortGenerated: `); + console.log(`sortOriginal: `); }; The result was the following:
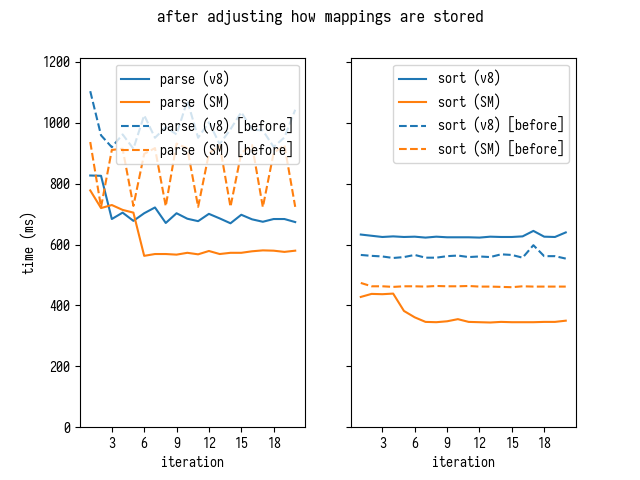
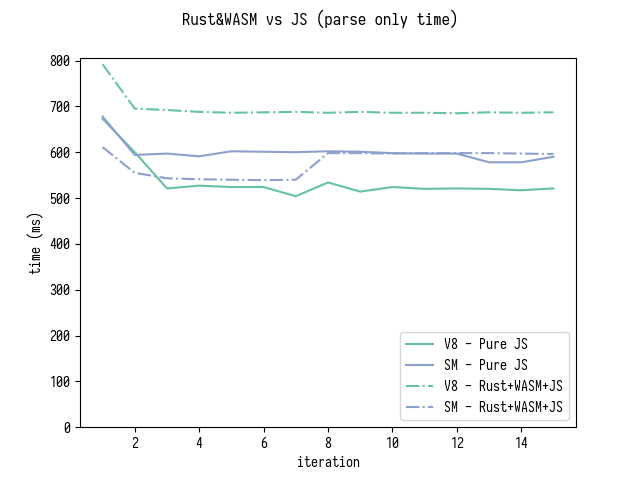
╭─ ~/src/source-map/bench ‹perf-work U› [Clone sorting functions for each comparator] ╰─$ d8 bench-shell-bindings.js Parsing source map parse: 1911.846 sortGenerated: 619.5990000000002 sortOriginal: 905.8220000000001 parse: 1965.4820000000004 sortGenerated: 602.1939999999995 sortOriginal: 896.3589999999995 ^C And so the parsing and sorting times look in V8 and SpiderMonkey for each iteration of the benchmark launch:

In V8, we seem to spend about as much time analyzing the mappings as we did on sorting them. In SpiderMonkey, parsing is much faster - but slower sorting. It made me look at the parsing code.
We optimize analysis - We delete a cache of segments
Let's look at the profile again:
Overhead Symbol 18.23% *doQuickSort :44 12.36% *doQuickSort :44 3.84% *SourceMapConsumer_parseMappings ../dist/source-map.js:1894 3.07% Builtin:StringEqual 1.92% v8::internal::StringTable::LookupStringIfExists_NoAllocate 1.85% *SourceMapConsumer_parseMappings ../dist/source-map.js:1894 1.59% *SourceMapConsumer_parseMappings ../dist/source-map.js:1894 1.54% Builtin:StringCharAt 1.52% v8::internal::(anonymous namespace)::StringTableNoAllocateKey::IsMatch 1.38% v8::internal::Scavenger::ScavengeObject 1.27% Builtin:KeyedLoadIC_Megamorphic 1.22% Builtin:StringPrototypeSlice 1.10% v8::internal::(anonymous namespace)::MakeStringThin 1.05% v8::internal::(anonymous namespace)::CopyObjectToObjectElements 1.03% v8::internal::String::VisitFlat<v8::internal::IteratingStringHasher> 0.88% clear_page_c_e 0.51% Builtin:MathRandom 0.48% Builtin:KeyedLoadIC 0.46% v8::internal::IteratingStringHasher::Hash 0.41% Builtin:RecordWrite Removing the JavaScript code that we already know leaves us with the following:
Overhead Symbol 3.07% Builtin:StringEqual 1.92% v8::internal::StringTable::LookupStringIfExists_NoAllocate 1.54% Builtin:StringCharAt 1.52% v8::internal::(anonymous namespace)::StringTableNoAllocateKey::IsMatch 1.38% v8::internal::Scavenger::ScavengeObject 1.27% Builtin:KeyedLoadIC_Megamorphic 1.22% Builtin:StringPrototypeSlice 1.10% v8::internal::(anonymous namespace)::MakeStringThin 1.05% v8::internal::(anonymous namespace)::CopyObjectToObjectElements 1.03% v8::internal::String::VisitFlat<v8::internal::IteratingStringHasher> 0.88% clear_page_c_e 0.51% Builtin:MathRandom 0.48% Builtin:KeyedLoadIC 0.46% v8::internal::IteratingStringHasher::Hash 0.41% Builtin:RecordWrite When I began to look at the call chains for individual entries, I found that quite a few of them go through KeyedLoadIC_Megamorphic in SourceMapConsumer_parseMappings .
- 1.92% v8::internal::StringTable::LookupStringIfExists_NoAllocate - v8::internal::StringTable::LookupStringIfExists_NoAllocate + 99.80% Builtin:KeyedLoadIC_Megamorphic - 1.52% v8::internal::(anonymous namespace)::StringTableNoAllocateKey::IsMatch - v8::internal::(anonymous namespace)::StringTableNoAllocateKey::IsMatch - 98.32% v8::internal::StringTable::LookupStringIfExists_NoAllocate + Builtin:KeyedLoadIC_Megamorphic + 1.68% Builtin:KeyedLoadIC_Megamorphic - 1.27% Builtin:KeyedLoadIC_Megamorphic - Builtin:KeyedLoadIC_Megamorphic + 57.65% *SourceMapConsumer_parseMappings ../dist/source-map.js:1894 + 22.62% *SourceMapConsumer_parseMappings ../dist/source-map.js:1894 + 15.91% *SourceMapConsumer_parseMappings ../dist/source-map.js:1894 + 2.46% Builtin:InterpreterEntryTrampoline + 0.61% BytecodeHandler:Mul + 0.57% *doQuickSort :44 - 1.10% v8::internal::(anonymous namespace)::MakeStringThin - v8::internal::(anonymous namespace)::MakeStringThin - 94.72% v8::internal::StringTable::LookupStringIfExists_NoAllocate + Builtin:KeyedLoadIC_Megamorphic + 3.63% Builtin:KeyedLoadIC_Megamorphic + 1.66% v8::internal::StringTable::LookupString This sorting of call stacks signaled to me that the code executes multiple key mappings in the form of obj[key] , where key is a dynamically generated string. When I looked at the source, I found the following code :
// Because each offset is encoded relative to the previous one, // many segments often have the same encoding. We can exploit this // fact by caching the parsed variable length fields of each segment, // allowing us to avoid a second parse if we encounter the same // segment again. for (end = index; end < length; end++) { if (this._charIsMappingSeparator(aStr, end)) { break; } } str = aStr.slice(index, end); segment = cachedSegments[str]; if (segment) { index += str.length; } else { segment = []; while (index < end) { base64VLQ.decode(aStr, index, temp); value = temp.value; index = temp.rest; segment.push(value); } // ... cachedSegments[str] = segment; } This code is responsible for decoding Base64 VLQ-coded sequences, that is, line A will be decoded as [0] , and UAAAA decoded into [10,0,0,0,0] . I suggest looking at this post about source maps inside, if you want to better understand the coding process itself.
Instead of decoding each sequence independently, this code tries to cache decrypted segments: looks ahead to the separator ( , or ; ), then extracts the substring from the current position to the separator and checks if we already have such a segment in the cache - and if so , then returns the cached segment, otherwise, it parses it and puts it in the cache.
Caching (it’s also memoisation ) is a very powerful optimization technique - however, it only makes sense if the maintenance of the cache itself and the search for results there turn out to be cheaper than the actual calculation itself again.
Abstract analysis
Let's try to abstractly compare these two operations:
On the one hand, a pure analysis:
When analyzing a segment, we look at each symbol once. For each symbol, several comparisons and arithmetic operations are performed in order to convert the base64 character to an integer value. Then several bitwise operations are performed to combine these numerical values into one large one. Then the declassified value is saved into an array and we move to the next part of the segment. Segments are limited to five elements.
On the other hand, caching:
- To find a cached value, we go around all the characters of a segment once to find its end;
- We extract the substring that requires placement and, possibly, copying, depending on how the strings are implemented in the JS VM.
- We use this line as a key for a dictionary that:
- It first requires the VM to calculate the hash for this string (by passing it again and performing various bitwise operations on characters), this may also require the VM to internalize the string (depending on the implementation).
- The VM must then perform a hash mapping on the table, which requires accessing and comparing the key by value with other keys (this may require viewing the individual characters again);
In general, it looks like direct parsing will be faster, implying that the JS VM works well with separate arithmetic and bitwise operations, simply because it looks at each character only once, while caching requires 2-4 times traversal , just to establish whether we got into the cache or not.
Profiling seems to confirm this too: KeyedLoadIC_Megamorphic used in V8 to implement cachedSegments[str] , like cachedSegments[str] in the code above.
Based on these observations, I conducted several experiments. First, I checked how big the cachedSegments cache cachedSegments at the end of parsing. The smaller it is, the more efficient the caching could be.
It turns out that he grows up quite strongly:
Object.keys(cachedSegments).length = 155478 Selected microbench marks
Now I decided to write a small separate benchmark:
// [n] , [v], // .. 0, v, 2*v, ... , 1, 1 + v, 1 + 2*v, ... // [base] - // // // : [v], [cachedSegments] function makeString(n, v, base) { var arr = []; for (var i = 0; i < n; i++) { arr.push([0, base + (i % v), 0, 0].map(base64VLQ.encode).join('')); } return arr.join(';') + ';'; } // [f] [str]. function bench(f, str) { for (var i = 0; i < 1000; i++) { f(str); } } // [f] [str]. // [v] function measure(v, str, f) { var start = Date.now(); bench(f, str); var end = Date.now(); report(`${v}, ${f.name}, ${(end - start).toFixed(2)}`); } async function measureAll() { for (let v = 1; v <= 256; v *= 2) { // 1000 [v] , // [cachedSegments] [v] . let str = makeString(1000, v, 1024 * 1024); let arr = encoder.encode(str); // 10 . for (var j = 0; j < 10; j++) { measure(j, i, str, decodeCached); measure(j, i, str, decodeNoCaching); measure(j, i, str, decodeNoCachingNoStrings); measure(j, i, arr, decodeNoCachingNoStringsPreEncoded); await nextTick(); } } } function nextTick() { return new Promise((resolve) => setTimeout(resolve)); } Base64 VLQ, .
— decodeCached , source-map — :
function decodeCached(aStr) { var length = aStr.length; var cachedSegments = {}; var end, str, segment, value, temp = {value: 0, rest: 0}; const decode = base64VLQ.decode; var index = 0; while (index < length) { // Because each offset is encoded relative to the previous one, // many segments often have the same encoding. We can exploit this // fact by caching the parsed variable length fields of each segment, // allowing us to avoid a second parse if we encounter the same // segment again. for (end = index; end < length; end++) { if (_charIsMappingSeparator(aStr, end)) { break; } } str = aStr.slice(index, end); segment = cachedSegments[str]; if (segment) { index += str.length; } else { segment = []; while (index < end) { decode(aStr, index, temp); value = temp.value; index = temp.rest; segment.push(value); } if (segment.length === 2) { throw new Error('Found a source, but no line and column'); } if (segment.length === 3) { throw new Error('Found a source and line, but no column'); } cachedSegments[str] = segment; } index++; } } — decodeNoCaching . , decodeCached , . . Array Int32Array segment .
function decodeNoCaching(aStr) { var length = aStr.length; var cachedSegments = {}; var end, str, segment, temp = {value: 0, rest: 0}; const decode = base64VLQ.decode; var index = 0, value; var segment = new Int32Array(5); var segmentLength = 0; while (index < length) { segmentLength = 0; while (!_charIsMappingSeparator(aStr, index)) { decode(aStr, index, temp); value = temp.value; index = temp.rest; if (segmentLength >= 5) throw new Error('Too many segments'); segment[segmentLength++] = value; } if (segmentLength === 2) { throw new Error('Found a source, but no line and column'); } if (segmentLength === 3) { throw new Error('Found a source and line, but no column'); } index++; } } , , decodeNoCachingNoString JavaScript- , utf8- Uint8Array . , , , JS VM . String.prototype.charCodeAt , , JS VM.
: utf8 , . "" , , typed array ⇒ string ⇒ typed array . , source map array buffer , .
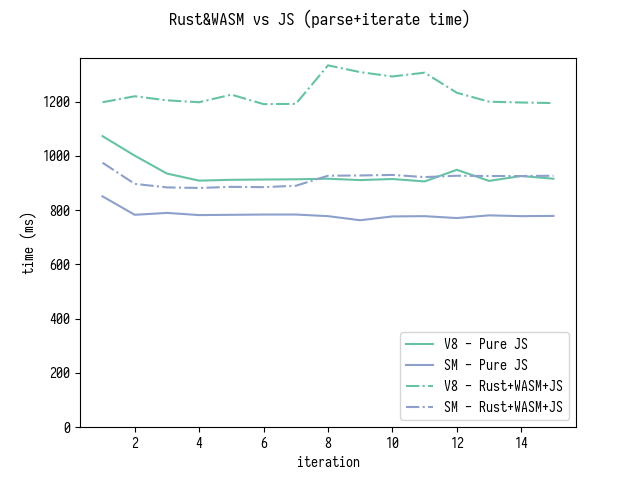
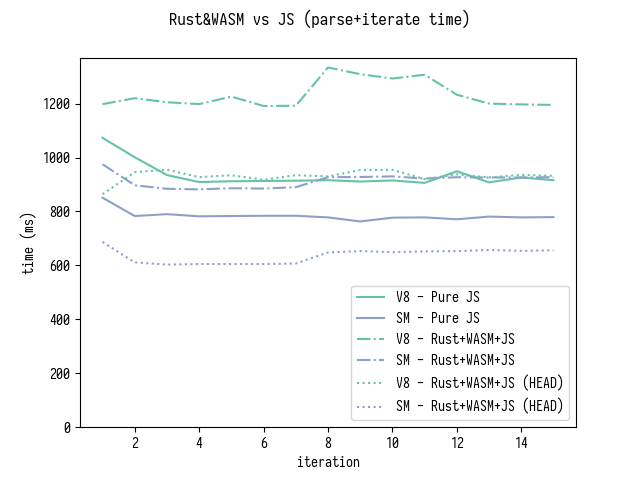
let encoder = new TextEncoder(); function decodeNoCachingNoString(aStr) { decodeNoCachingNoStringPreEncoded(encoder.encode(aStr)); } function decodeNoCachingNoStringPreEncoded(arr) { var length = arr.length; var cachedSegments = {}; var end, str, segment, temp = {value: 0, rest: 0}; const decode2 = base64VLQ.decode2; var index = 0, value; var segment = new Int32Array(5); var segmentLength = 0; while (index < length) { segmentLength = 0; while (arr[index] != 59 && arr[index] != 44) { decode2(arr, index, temp); value = temp.value; index = temp.rest; if (segmentLength < 5) { segment[segmentLength++] = value; } } if (segmentLength === 2) { throw new Error('Found a source, but no line and column'); } if (segmentLength === 3) { throw new Error('Found a source and line, but no column'); } index++; } } , Chrome Dev66.0.3343.3 (V8 6.6.189 ) Firefox Nightly 60.0a1 (2018-02-11) :
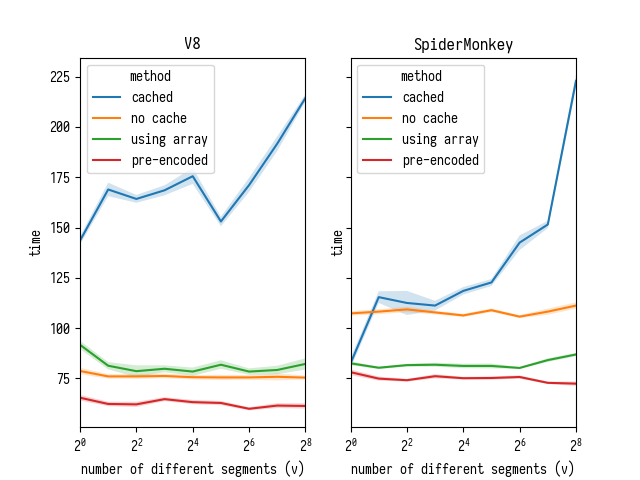
:
- , , V8, SpiderMonkey. — ;
- SpiderMonkey , , V8 — "--" (.. );
, V8 - charCodeAt – , Crankshaft charCodeAt , charCodeAt , , , .
- V8 :
- Issue 6391: StringCharCodeAt slower than Crankshaft ;
- Issue 7092: High overhead of String.prototype.charCodeAt in typescript test ;
- Issue 7326: Performance degradation when looping across character codes of a string ;
2018 , , charCodeAt . Chrome Beta Chrome Dev.

, V8 : charCodeAt 6.5.254.21 6.6.189 . "no cache" "using array", , charCodeAt V8 , Uint8Array , . , V8.
, , . Why is that? , V8:
function foo(str, i) { return str.charCodeAt(i); } let str = "fisk"; foo(str, 0); foo(str, 0); foo(str, 0); %OptimizeFunctionOnNextCall(foo); foo(str, 0); ╭─ ~/src/v8/v8 ‹master› ╰─$ out.gn/x64.release/d8 --allow-natives-syntax --print-opt-code --code-comments x.js , , V8 charCodeAt . , , V8, , charCodeAt .
, source-map .

, , : .
–
, .
:
originalMappingscompareByOriginalPositions;generatedMappingscompareByGeneratedPositionsDeflated.
originalMappings
compareByOriginalPositions .
function compareByOriginalPositions(mappingA, mappingB, onlyCompareOriginal) { var cmp = strcmp(mappingA.source, mappingB.source); if (cmp !== 0) { return cmp; } cmp = mappingA.originalLine - mappingB.originalLine; if (cmp !== 0) { return cmp; } cmp = mappingA.originalColumn - mappingB.originalColumn; if (cmp !== 0 || onlyCompareOriginal) { return cmp; } cmp = mappingA.generatedColumn - mappingB.generatedColumn; if (cmp !== 0) { return cmp; } cmp = mappingA.generatedLine - mappingB.generatedLine; if (cmp !== 0) { return cmp; } return strcmp(mappingA.name, mappingB.name); } , source , . source , . , originalMappings , , originalMappings : originalMappings[i] i . , originalMappings[i] , , .
:
if (typeof mapping.originalLine === 'number') { // originalMappings.push(mapping). // . let currentSource = mapping.source; while (originalMappings.length <= currentSource) { originalMappings.push(null); } if (originalMappings[currentSource] === null) { originalMappings[currentSource] = []; } originalMappings[currentSource].push(mapping); } :
var startSortOriginal = Date.now(); // : // quickSort(originalMappings, util.compareByOriginalPositions); for (var i = 0; i < originalMappings.length; i++) { if (originalMappings[i] != null) { quickSort(originalMappings[i], util.compareByOriginalPositionsNoSource); } } var endSortOriginal = Date.now(); compareByOriginalPositionsNoSource compareByOriginalPositions , source — , originalMappings[i] .

V8, SpiderMonkey, V8.
[ originalMappings : originalMappings , originalMappings[i] . , .]
generatedMappings
generatedMappings compareByGeneratedPositionsDeflated .
function compareByGeneratedPositionsDeflated(mappingA, mappingB, onlyCompareGenerated) { var cmp = mappingA.generatedLine - mappingB.generatedLine; if (cmp !== 0) { return cmp; } cmp = mappingA.generatedColumn - mappingB.generatedColumn; if (cmp !== 0 || onlyCompareGenerated) { return cmp; } cmp = strcmp(mappingA.source, mappingB.source); if (cmp !== 0) { return cmp; } cmp = mappingA.originalLine - mappingB.originalLine; if (cmp !== 0) { return cmp; } cmp = mappingA.originalColumn - mappingB.originalColumn; if (cmp !== 0) { return cmp; } return strcmp(mappingA.name, mappingB.name); } generatedLine . , , , , generatedMappings .
, :
while (index < length) { if (aStr.charAt(index) === ';') { generatedLine++; // ... } else if (aStr.charAt(index) === ',') { // ... } else { mapping = new Mapping(); mapping.generatedLine = generatedLine; // ... } } generatedLine , , generatedLine , , generatedMappings generatedLine , . . :
let subarrayStart = 0; while (index < length) { if (aStr.charAt(index) === ';') { generatedLine++; // ... // [subarrayStart, generatedMappings.length]. sortGenerated(generatedMappings, subarrayStart); subarrayStart = generatedMappings.length; } else if (aStr.charAt(index) === ',') { // ... } else { mapping = new Mapping(); mapping.generatedLine = generatedLine; // ... } } // sortGenerated(generatedMappings, subarrayStart); [: , … , . , generatedMappings , , generatedMappings , .]
const compareGenerated = util.compareByGeneratedPositionsDeflatedNoLine; function sortGenerated(array, start) { let l = array.length; let n = array.length - start; if (n <= 1) { return; } else if (n == 2) { let a = array[start]; let b = array[start + 1]; if (compareGenerated(a, b) > 0) { array[start] = b; array[start + 1] = a; } } else if (n < 20) { for (let i = start; i < l; i++) { for (let j = i; j > start; j--) { let a = array[j - 1]; let b = array[j]; if (compareGenerated(a, b) <= 0) { break; } array[j - 1] = b; array[j] = a; } } } else { quickSort(array, compareGenerated, start); } } :

, – , generatedMappings , . ( )

, .
- , ?
, : asm.js / WASM, Rust JavaScript .
– GC
Mapping , (GC) – , – . This is how I did it.
[ , JavaScript- , . , , , , : , C++ :-(]
Mapping , , .
function Mapping(memory) { this._memory = memory; this.pointer = 0; } Mapping.prototype = { get generatedLine () { return this._memory[this.pointer + 0]; }, get generatedColumn () { return this._memory[this.pointer + 1]; }, get source () { return this._memory[this.pointer + 2]; }, get originalLine () { return this._memory[this.pointer + 3]; }, get originalColumn () { return this._memory[this.pointer + 4]; }, get name () { return this._memory[this.pointer + 5]; }, set generatedLine (value) { this._memory[this.pointer + 0] = value; }, set generatedColumn (value) { this._memory[this.pointer + 1] = value; }, set source (value) { this._memory[this.pointer + 2] = value; }, set originalLine (value) { this._memory[this.pointer + 3] = value; }, set originalColumn (value) { this._memory[this.pointer + 4] = value; }, set name (value) { this._memory[this.pointer + 5] = value; }, }; , :
BasicSourceMapConsumer.prototype._parseMappings = function (aStr, aSourceRoot) { // 4 . // aStr this._memory = new Int32Array(1 * 1024 * 1024); this._allocationFinger = 0; let mapping = new Mapping(this._memory); // ... while (index < length) { if (aStr.charAt(index) === ';') { // , , // sortGenerated(this._memory, generatedMappings, previousGeneratedLineStart); } else { this._allocateMapping(mapping); // ... // "" . generatedMappings.push(mapping.pointer); if (segmentLength > 1) { // ... originalMappings[currentSource].push(mapping.pointer); } } } // ... for (var i = 0; i < originalMappings.length; i++) { if (originalMappings[i] != null) { quickSort(this._memory, originalMappings[i], util.compareByOriginalPositionsNoSource); } } }; BasicSourceMapConsumer.prototype._allocateMapping = function (mapping) { let start = this._allocationFinger; let end = start + 6; if (end > this._memory.length) { // Do we need to grow memory buffer? let memory = new Int32Array(this._memory.length * 2); memory.set(this._memory); this._memory = memory; } this._allocationFinger = end; let memory = this._memory; mapping._memory = memory; mapping.pointer = start; mapping.name = 0x7fffffff; // Instead of null use INT32_MAX. mapping.source = 0x7fffffff; // Instead of null use INT32_MAX. }; exports.compareByOriginalPositionsNoSource = function (memory, mappingA, mappingB, onlyCompareOriginal) { var cmp = memory[mappingA + 3] - memory[mappingB + 3]; // originalLine if (cmp !== 0) { return cmp; } cmp = memory[mappingA + 4] - memory[mappingB + 4]; // originalColumn if (cmp !== 0 || onlyCompareOriginal) { return cmp; } cmp = memory[mappingA + 1] - memory[mappingB + 1]; // generatedColumn if (cmp !== 0) { return cmp; } cmp = memory[mappingA + 0] - memory[mappingB + 0]; // generatedLine if (cmp !== 0) { return cmp; } return memory[mappingA + 5] - memory[mappingB + 5]; // name }; , . Mapping , , . VM allocation sinking , scalar replacement . , SpiderMonkey , .
[ JS. , , "" source-map , WASM]
, GC :
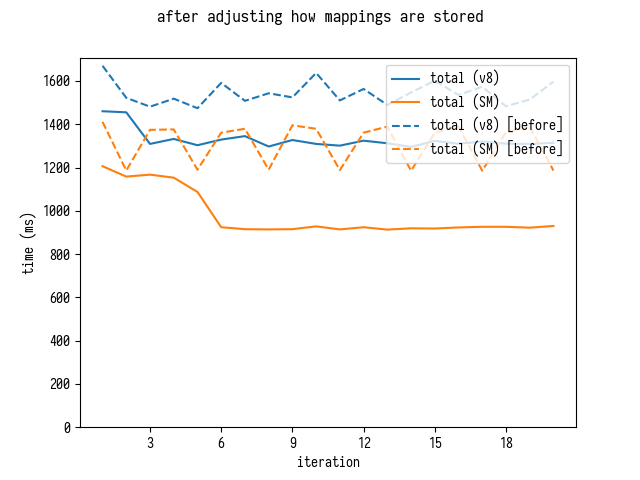
, SpiderMonkey , , .
SpiderMonkey
, SpiderMonkey: 4 64 , , 7 .
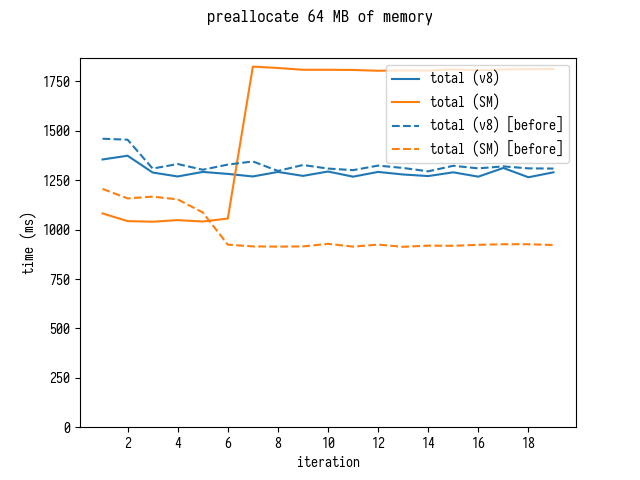
- , , .
SpiderMonkey Jan de Mooij , – asm.js 2012 … SpiderMonkey, .
– Uint8Array .
, Uint8Array , .
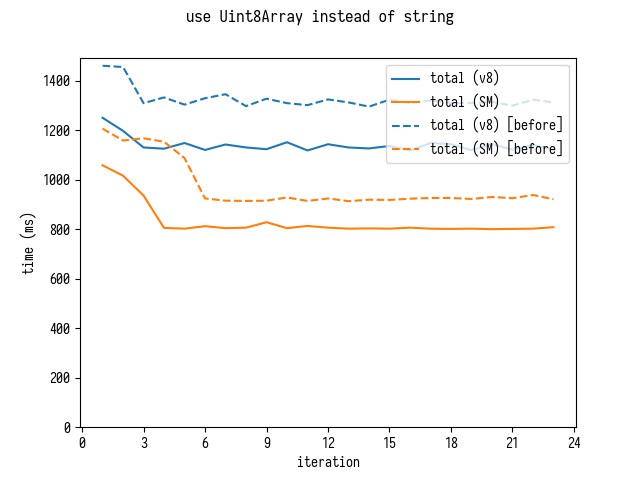
[ source-map , JavaScript- JSON.decode . , .]
:
$ d8 bench-shell-bindings.js ... [Stats samples: 5, total: 24050 ms, mean: 4810 ms, stddev: 155.91063145276527 ms] $ sm bench-shell-bindings.js ... [Stats samples: 7, total: 22925 ms, mean: 3275 ms, stddev: 269.5999093306804 ms] $ d8 bench-shell-bindings.js ... [Stats samples: 22, total: 25158 ms, mean: 1143.5454545454545 ms, stddev: 16.59358125226469 ms] $ sm bench-shell-bindings.js ... [Stats samples: 31, total: 25247 ms, mean: 814.4193548387096 ms, stddev: 5.591064299397745 ms] 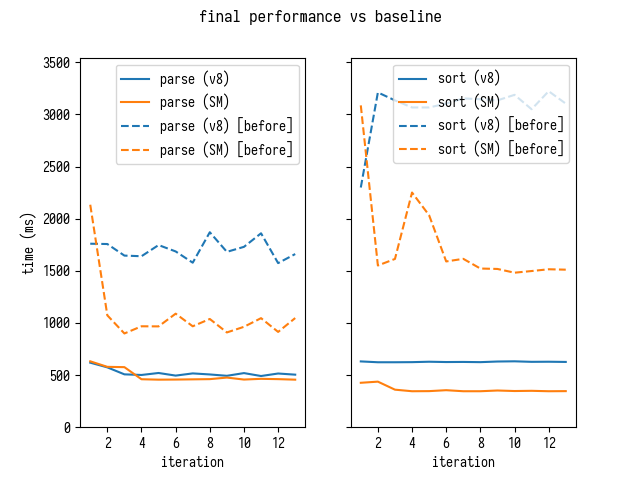
4 !
, , originalMappings , . , originalMappings :
allGeneratedPositionsFor, ;eachMapping(..., ORIGINAL_ORDER), .
, allGeneratedPositionsFor originalMappings[i] , , - .
, V8 19 , V8 19 ( untrusted code mitigations ).

"" source-map
19 , source-map source-map , Rust WASM.
Rust parse_mappings , Rust- , generatedMappings . JS-, originalMappings[i] .
( generatedMappings ) generatedMappings .
, , Rust- generatedMappings , JS-.
" Rust+WASM " . , , Rust source-map .
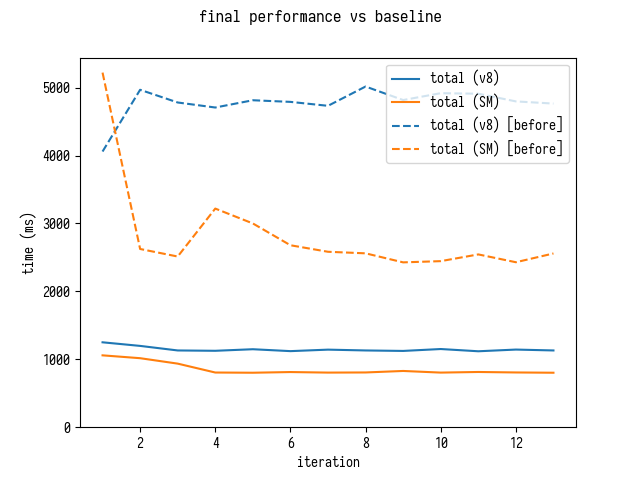
(27-02-2018)
, WASM+Rust 15% SpiderMonkey V8.
JavaScript
–
– . . perf – "" , .
. , .
– . , 100 , 3333 30 ?
3 – , .
, : , , ?
VM . !
. . : " !" . (VM) – , , . , . C++ .
VM
, JavaScript.
, , , - .
/
, , , .
JavaScript , , , VM, – .
VM , . , DevTools.
, , , . ? , . , . , (.. Rust).
: - , , , . , , .
Afterword
, :
- ;
- , , ;
- , V8.
, , . , "" , "" , . :
- ;
- .
. V8 . JS . . (Rust, ) .
.
, , ( ) . . JS VM .
… ? , , , . , .
, N , JavaScript , M X .
: () , ; () , – " #3" .
')
Source: https://habr.com/ru/post/350018/
All Articles