Zombies that eat up your memory
Whatever you think you are, there are zombies. And they really eat brains. Not human, true, but computer. I am talking now about zombie processes and the resources they consume. It will be a heartbreaking story about the lost and again found 32 GB of RAM. Perhaps only some of you will be faced with exactly the same problem, but if this happens suddenly, you will at least have a chance to understand what is happening.
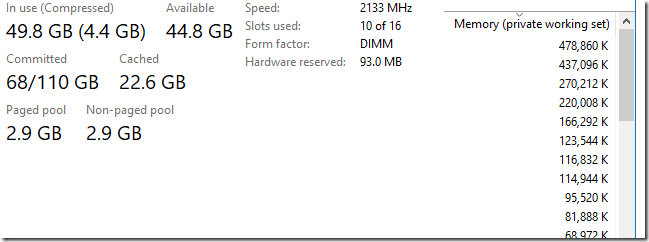
Let's start with the fact that computers running Windows tend to lose memory over time. Well, at least with me, with my way of using them. After a couple of weeks without rebooting (or, for example, just one weekend for which I rebuilt Chrome 300 times), I began to notice that the task manager is starting to show me a very small amount of free RAM, but at the same time there are no processes in the system this very memory is actively used. In the example above (with 300 Chrome assemblies), the task manager told me that the system uses 49.8 GB plus 4.4 GB of memory is compressed - but at the same time only a few processes are running, and all of them even do not use as much memory as close:
')
There is 96 GB of RAM in my computer (yes, I'm lucky) and when I don’t have any running processes at all - I, you know, would like to see at least half of this free memory. I really count on it. But sometimes this can not be achieved and I have to reboot the OS. The Windows kernel is written efficiently and reliably (no kidding), so the memory should not disappear without a trace. But it still disappears.
My first guess was the memory that one of my colleagues once complained about zombie processes, which sometimes remain in the OS no longer active, but still not completely removed by the kernel. He even wrote a special utility that displays a list of such processes - their names and numbers. When he ran this utility in his tests, he received up to several hundred zombie processes on a regular Windows machine. I found his tool, launched it on my computer and got ... 506,000 zombie processes. Yes, 506 thousand!
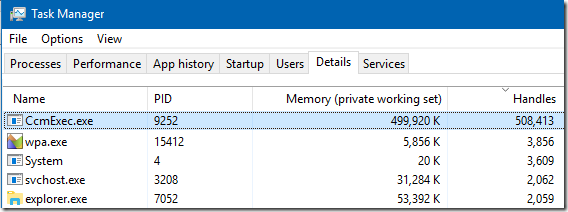
I remembered that one of the possible reasons for the transition of the process to the “zombie” state could be that some other process keeps its handle open. In my case, a large number of zombie processes played into my hands - it was harder for them to hide. I simply opened the task manager and added a column with the number of open handles for each process to the Details tab. Then sorted the list in descending order of values in this column. I immediately found the hero of this story - the CcmExec.exe process (part of the Microsoft System Management Server ) had 508,000 open handles. This was, firstly, very much, and secondly, suspiciously close to the number of 506,000 zombie processes I found.
I killed the CcmExec.exe process and got the following result:
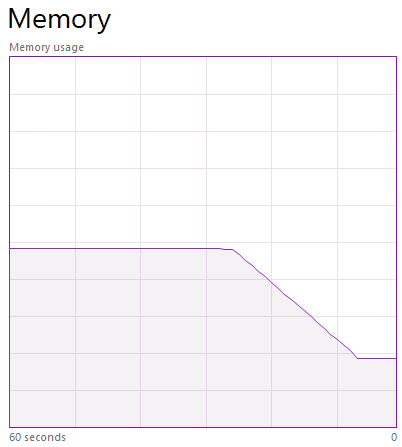
Everything turned out exactly as I expected. As I wrote above without irony - the Windows kernel is written very well and when the process is destroyed, then all the resources occupied by it are released. Closing CcmExec.exe freed 508,000 handles, which made it possible to permanently close 506,000 zombie processes. The amount of free RAM instantly increased by 32 GB. The secret is revealed!
Up to this point, we have not yet figured out what made all these processes hang in uncertainty, and not be removed. It seems that we are dealing with a trivial bug in the application (and not in the OS kernel). The general rule is that when you create a process, you get its descriptor and its main thread's descriptor. You MUST close these handles. If your task was to simply start the process, you can close them immediately (this will not kill the running process, but simply break the connection of your process with it). If you need a new process for something (for example, you are waiting for the end of its work, or you need a code that it returns), then you need to use the appropriate functions (for example, WaitForSingleObject (hProcess, INFINITE) to wait for the output or GetExitCodeProcess (hProcess, & exitCode ) to get the return code) and still close the descriptors after you received everything you wanted from the child process. The same should be done with the process descriptors that you open for something with the help of the OpenProcess () function.
If the process that forgets to do so, refers to the system, then you may not even help to log out of your account and log in again, only a complete reboot.
Another tool that I used in my research was the RamMap utility. It shows the use of each page of memory. On the Process Memory tab, we see hundreds of thousands of processes, each of which occupies 32 KB of RAM - obviously, these are our zombies. But ~ 500,000 times 32 KB will be approximately 16 GB - where did the rest of the memory go? Comparing the state of the memory before and after closing zombie processes gives the answer to this question:
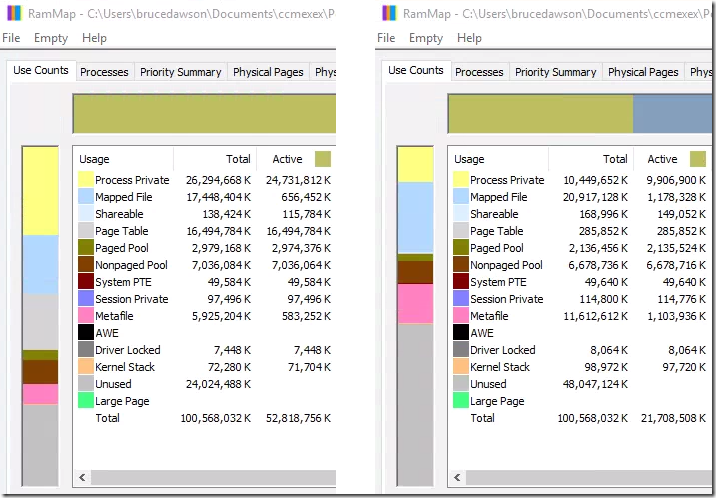
We can clearly see that ~ 16 GB is spent on Process Private Memory. We also see that another 16 GB falls on Page Table Memory. Obviously, each zombie process takes 32 KB in the table of memory pages and another 32 KB uses for its personal memory. I don’t know why the zombie process has so much memory, but probably no one ever thought that the number of such processes can be measured in hundreds of thousands.
Some types of used memory have increased after closing the CcmExec.exe process, mainly for the Mapped File and Metafile. I do not know exactly why it happened. One of my guesses is that the OS decided that it was now enough free memory and had cached something for itself. This is, in general, not bad. I don’t feel sorry for the OS needs, I just don’t want it to disappear completely aimlessly.
Important note: RamMap also opens the handles of all processes, so this utility should be closed if you want to close the zombie processes.
I wrote a tweet about my discovery and the study was continued by another programmer who managed to reproduce this bug and pass information about it to the Microsoft developer, who said that this is a “known problem that sometimes happens when so many processes start and close very quickly”.
I hope this problem will be fixed soon.
I am working on the code for the Windows version of Chrome and one of my tasks is to optimize its build on this OS, and this requires repeated launches of this build itself. Each build of Chrome launches a huge variety of processes - from 28,000 to 37,000, depending on the selected settings. When using our distributed build system ( goma ), these processes are created and closed very quickly. My best build result is Chrome - 200 seconds. But such an aggressive policy of running processes reveals problems in the Windows kernel and its components:
If you are not working on a computer controlled by company policies, the CmmExec.exe process is not running and you will not encounter this particular bug. It will also affect you only if you collect Chrome or do something similar, creating and closing tens of thousands of processes at short intervals of time.
But!
CcmExec is not the only bug program in the world. I found many others that contain exactly the same type of errors leading to the creation of zombie processes. And there are still a great many of those that I have not found.
As all experienced programmers know, any error that has not been explicitly corrected or warned will definitely happen sometime . Just writing the documentation "Please close this handle" is not enough. So here is my contribution to making finding such errors easier, and correcting them is more real. FindZombieHandles is a tool based on NtApiDotNet and code from @tiraniddo , which lists the zombie processes and information about who made them zombies. Here is an example of the output of this utility running on my computer:
274 zombies are not that bad yet. But even this indicates certain problems that can be found and corrected. The IntelCpHeciSvc.exe process on this list has the biggest problems - it looks like it opens (and forgets to close) the process handle every time I open a video in Windows Explorer.
Visual Studio forgets to close the descriptors of at least two processes, in one case it always plays. Just run the project build and wait ~ 15 minutes for the MSBuild.exe process to close. You can also set the “set MSBUILDDISABLENODEREUSE = 1” option and then MSBuild.exe will close immediately after the build is completed and the lost handle will be visible immediately. Unfortunately, some scoundrel at Microsoft has fixed this problem and the fix should come out in VS 15.6 update, so hurry to reproduce it while it is still working (I hope I don’t need to explain that it was a joke and no he is not a scum ).
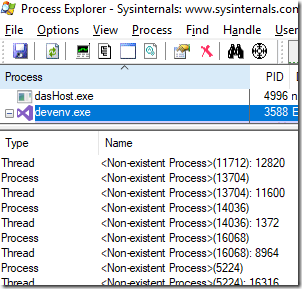
You can also use Process Explorer to view forgotten processes by configuring its bottom pane as shown below (note that in this case, forgotten descriptors will be shown for both processes and threads):
Here are a couple of examples of bugs found (some are reported to the developers, but not all):
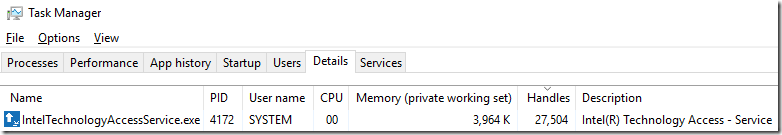
Process descriptors are not the only type of resource that can leak in this way. For example, the “Intel® Online Connect Access service” (IntelTechnologyAccessService.exe) uses only 4 MB of RAM, but, after running for 30 days, creates 27,504 handles. This problem can be detected using the Task Manager, I sent a bug report about it to the developers:
Using Process Explorer, I noticed that NVDisplay.Container.exe opens ~ 5000 descriptors to the \ BaseNamedObjects \ NvXDSyncStop-61F8EBFF-D414-46A7-90AE-98DD58E4BC99 event, creating a new descriptor every two minutes. I understand they want to be super-confident that they can stop NvXDSync? Bugreport Nvidia sent .

Corsair Link Service creates ~ 15 handles per second, does not free them at all. Bugreport sent .
Adobe's Creative Cloud loses thousands of handles (about 6,500 per day, according to my calculations). Bugreport sent .
The Razer Chroma SDK Service loses MUCH a lot of handles ( 150,000 per hour? ). Bugreport sent .
It is surprising that no one had paid much attention to such bugs before. Hey, Microsoft, maybe you should collect statistics on such cases and do something about it? Hey, Intel and Nvidia, clean up some of your code. Remember, I'm watching you.
And now you can take the FindZombieHandles utility, run it on your machine and tell about your findings. You can also use Task Manager and Process Explorer in your experiments.
Let's start with the fact that computers running Windows tend to lose memory over time. Well, at least with me, with my way of using them. After a couple of weeks without rebooting (or, for example, just one weekend for which I rebuilt Chrome 300 times), I began to notice that the task manager is starting to show me a very small amount of free RAM, but at the same time there are no processes in the system this very memory is actively used. In the example above (with 300 Chrome assemblies), the task manager told me that the system uses 49.8 GB plus 4.4 GB of memory is compressed - but at the same time only a few processes are running, and all of them even do not use as much memory as close:
')
There is 96 GB of RAM in my computer (yes, I'm lucky) and when I don’t have any running processes at all - I, you know, would like to see at least half of this free memory. I really count on it. But sometimes this can not be achieved and I have to reboot the OS. The Windows kernel is written efficiently and reliably (no kidding), so the memory should not disappear without a trace. But it still disappears.
My first guess was the memory that one of my colleagues once complained about zombie processes, which sometimes remain in the OS no longer active, but still not completely removed by the kernel. He even wrote a special utility that displays a list of such processes - their names and numbers. When he ran this utility in his tests, he received up to several hundred zombie processes on a regular Windows machine. I found his tool, launched it on my computer and got ... 506,000 zombie processes. Yes, 506 thousand!
I remembered that one of the possible reasons for the transition of the process to the “zombie” state could be that some other process keeps its handle open. In my case, a large number of zombie processes played into my hands - it was harder for them to hide. I simply opened the task manager and added a column with the number of open handles for each process to the Details tab. Then sorted the list in descending order of values in this column. I immediately found the hero of this story - the CcmExec.exe process (part of the Microsoft System Management Server ) had 508,000 open handles. This was, firstly, very much, and secondly, suspiciously close to the number of 506,000 zombie processes I found.
I killed the CcmExec.exe process and got the following result:
Everything turned out exactly as I expected. As I wrote above without irony - the Windows kernel is written very well and when the process is destroyed, then all the resources occupied by it are released. Closing CcmExec.exe freed 508,000 handles, which made it possible to permanently close 506,000 zombie processes. The amount of free RAM instantly increased by 32 GB. The secret is revealed!
What is a zombie process?
Up to this point, we have not yet figured out what made all these processes hang in uncertainty, and not be removed. It seems that we are dealing with a trivial bug in the application (and not in the OS kernel). The general rule is that when you create a process, you get its descriptor and its main thread's descriptor. You MUST close these handles. If your task was to simply start the process, you can close them immediately (this will not kill the running process, but simply break the connection of your process with it). If you need a new process for something (for example, you are waiting for the end of its work, or you need a code that it returns), then you need to use the appropriate functions (for example, WaitForSingleObject (hProcess, INFINITE) to wait for the output or GetExitCodeProcess (hProcess, & exitCode ) to get the return code) and still close the descriptors after you received everything you wanted from the child process. The same should be done with the process descriptors that you open for something with the help of the OpenProcess () function.
If the process that forgets to do so, refers to the system, then you may not even help to log out of your account and log in again, only a complete reboot.
Where does the memory go?
Another tool that I used in my research was the RamMap utility. It shows the use of each page of memory. On the Process Memory tab, we see hundreds of thousands of processes, each of which occupies 32 KB of RAM - obviously, these are our zombies. But ~ 500,000 times 32 KB will be approximately 16 GB - where did the rest of the memory go? Comparing the state of the memory before and after closing zombie processes gives the answer to this question:
We can clearly see that ~ 16 GB is spent on Process Private Memory. We also see that another 16 GB falls on Page Table Memory. Obviously, each zombie process takes 32 KB in the table of memory pages and another 32 KB uses for its personal memory. I don’t know why the zombie process has so much memory, but probably no one ever thought that the number of such processes can be measured in hundreds of thousands.
Some types of used memory have increased after closing the CcmExec.exe process, mainly for the Mapped File and Metafile. I do not know exactly why it happened. One of my guesses is that the OS decided that it was now enough free memory and had cached something for itself. This is, in general, not bad. I don’t feel sorry for the OS needs, I just don’t want it to disappear completely aimlessly.
Important note: RamMap also opens the handles of all processes, so this utility should be closed if you want to close the zombie processes.
I wrote a tweet about my discovery and the study was continued by another programmer who managed to reproduce this bug and pass information about it to the Microsoft developer, who said that this is a “known problem that sometimes happens when so many processes start and close very quickly”.
I hope this problem will be fixed soon.
Why do I have such strange problems on my computer?
I am working on the code for the Windows version of Chrome and one of my tasks is to optimize its build on this OS, and this requires repeated launches of this build itself. Each build of Chrome launches a huge variety of processes - from 28,000 to 37,000, depending on the selected settings. When using our distributed build system ( goma ), these processes are created and closed very quickly. My best build result is Chrome - 200 seconds. But such an aggressive policy of running processes reveals problems in the Windows kernel and its components:
- Fast deletion of processes leads to user input freezes .
- The touchpad driver allocates, but does not free, memory every time the process is created.
- App Verifier creates O (n ^ 2) log files (and it’s worth writing a separate post!)
- There is a bug in the Windows kernel that concerns file buffering, and this bug is played on all Windows from Server 2008 R2 to Windows 10
- Windows Defender delays the launch of each goma process for 250 ms
What's next?
If you are not working on a computer controlled by company policies, the CmmExec.exe process is not running and you will not encounter this particular bug. It will also affect you only if you collect Chrome or do something similar, creating and closing tens of thousands of processes at short intervals of time.
But!
CcmExec is not the only bug program in the world. I found many others that contain exactly the same type of errors leading to the creation of zombie processes. And there are still a great many of those that I have not found.
As all experienced programmers know, any error that has not been explicitly corrected or warned will definitely happen sometime . Just writing the documentation "Please close this handle" is not enough. So here is my contribution to making finding such errors easier, and correcting them is more real. FindZombieHandles is a tool based on NtApiDotNet and code from @tiraniddo , which lists the zombie processes and information about who made them zombies. Here is an example of the output of this utility running on my computer:
274 total zombie processes. 249 zombies held by IntelCpHeciSvc.exe(9428) 249 zombies of Video.UI.exe 14 zombies held by RuntimeBroker.exe(10784) 11 zombies of MicrosoftEdgeCP.exe 3 zombies of MicrosoftEdge.exe 8 zombies held by svchost.exe(8012) 4 zombies of ServiceHub.IdentityHost.exe 2 zombies of cmd.exe 2 zombies of vs_installerservice.exe 3 zombies held by explorer.exe(7908) 3 zombies of MicrosoftEdge.exe 1 zombie held by devenv.exe(24284) 1 zombie of MSBuild.exe 1 zombie held by SynTPEnh.exe(10220) 1 zombie of SynTPEnh.exe 1 zombie held by tphkload.exe(5068) 1 zombie of tpnumlkd.exe 1 zombie held by svchost.exe(1872) 1 zombie of userinit.exe 274 zombies are not that bad yet. But even this indicates certain problems that can be found and corrected. The IntelCpHeciSvc.exe process on this list has the biggest problems - it looks like it opens (and forgets to close) the process handle every time I open a video in Windows Explorer.
Visual Studio forgets to close the descriptors of at least two processes, in one case it always plays. Just run the project build and wait ~ 15 minutes for the MSBuild.exe process to close. You can also set the “set MSBUILDDISABLENODEREUSE = 1” option and then MSBuild.exe will close immediately after the build is completed and the lost handle will be visible immediately. Unfortunately, some scoundrel at Microsoft has fixed this problem and the fix should come out in VS 15.6 update, so hurry to reproduce it while it is still working (I hope I don’t need to explain that it was a joke and no he is not a scum ).
You can also use Process Explorer to view forgotten processes by configuring its bottom pane as shown below (note that in this case, forgotten descriptors will be shown for both processes and threads):
Here are a couple of examples of bugs found (some are reported to the developers, but not all):
- CcmExec.exe leak (described above case of 500,000 zombies) - developers are working on fixing
- Program Compatibility Assistant Service Leak - Problem Investigated
- Leak in devenv.exe + MSBuild.exe (problem fixed already)
- Leak in devenv.exe + ServiceHub.Host.Node.x86.exe (bug report sent )
- Leak in IntelCpHeciSvc.exe + Video.UI.exe for each open video file (Intel accepted the bug report and forwarded it to Lenovo)
- RuntimeBroker.exe + MicrosoftEdge and Video.UI.exe leak (possibly related to some other bugs in RuntimeBroker.exe)
- AudioSrv + Video.UI.exe leak
- One internal Google Tool leaks due to using the old version of psutil
- Lenovo's utility leaks: tphkload.exe loses one handle, SUService.exe loses three
- Synaptic's SynTPEnh.exe leak
Process descriptors are not the only type of resource that can leak in this way. For example, the “Intel® Online Connect Access service” (IntelTechnologyAccessService.exe) uses only 4 MB of RAM, but, after running for 30 days, creates 27,504 handles. This problem can be detected using the Task Manager, I sent a bug report about it to the developers:
Using Process Explorer, I noticed that NVDisplay.Container.exe opens ~ 5000 descriptors to the \ BaseNamedObjects \ NvXDSyncStop-61F8EBFF-D414-46A7-90AE-98DD58E4BC99 event, creating a new descriptor every two minutes. I understand they want to be super-confident that they can stop NvXDSync? Bugreport Nvidia sent .
Corsair Link Service creates ~ 15 handles per second, does not free them at all. Bugreport sent .
Adobe's Creative Cloud loses thousands of handles (about 6,500 per day, according to my calculations). Bugreport sent .
The Razer Chroma SDK Service loses MUCH a lot of handles ( 150,000 per hour? ). Bugreport sent .
It is surprising that no one had paid much attention to such bugs before. Hey, Microsoft, maybe you should collect statistics on such cases and do something about it? Hey, Intel and Nvidia, clean up some of your code. Remember, I'm watching you.
And now you can take the FindZombieHandles utility, run it on your machine and tell about your findings. You can also use Task Manager and Process Explorer in your experiments.
Source: https://habr.com/ru/post/349924/
All Articles