Measuring the speed of Java code correctly (using JMH)
Hi, Habr!
This is an introductory article on how to do performance tests in JVM languages (java, kotlin, scala, etc.). It is useful for the case when it is required to show in figures the change in performance from the use of a specific algorithm.
All examples are given in the kotlin language and for the gradle assembly system. The source code of the project is available on github .

Training
Jmh
First of all we will focus on the main part of our measurements - using JMH . Java Microbenchmark Harness is a set of libraries for testing the performance of small functions (that is, those where the GC pause increases the running time at times).
Before running the test, JMH recompiles the code, because:
- To reduce the error in calculating the operation time of a function, you must run it N times, calculate the total operation time, and then divide it by N.
- To do this, you need to wrap the launch in the form of a loop and call the required method. However, in this case, the cycle itself, as well as the call of the function being measured, will affect the time of the function. Therefore, instead of a loop, the code of the function call will be inserted directly, without reflection or method generation at runtime.
After reworking the bytecode, testing can be started with a command like java -jar benchmarks.jar , since all the necessary components will already be packed into one jar file.
JMH Gradle Plugin
As is clear from the description above, to test the performance of the code, it is not enough just to add the necessary libraries to the classpath and run tests in the JUnit style. Therefore, if we want to do business, and not to understand the specifics of writing scripts, we cannot do without a plug-in to maven / gradle. For new projects, the advantage remains behind the gradle, therefore we choose it.
For JMH there is a semi-official plugin for gradle - jmh-gradle-plugin . Add it to the project:
buildscript { repositories { mavenCentral() maven { url "https://plugins.gradle.org/m2/" } } dependencies { classpath "me.champeau.gradle:jmh-gradle-plugin:$jmh_gradle_plugin_version" } } apply plugin: "me.champeau.gradle.jmh" The plug-in will automatically create a new source set (this is "a set of files and resources that should be compiled and run together," you can read either the article on Habré by svartalfar , or in the official gradle documentation ). jmh source set automatically refers to main, that is, we get a short work algorithm:
- We write the code that we will change in the standard main source set, in the same place where it is always.
- We write the code with setup and warming up of tests in separate source set. It is his byte code that will be overwritten, here the plugin will add the necessary dependencies, in which there are definitions of abstract and so on.
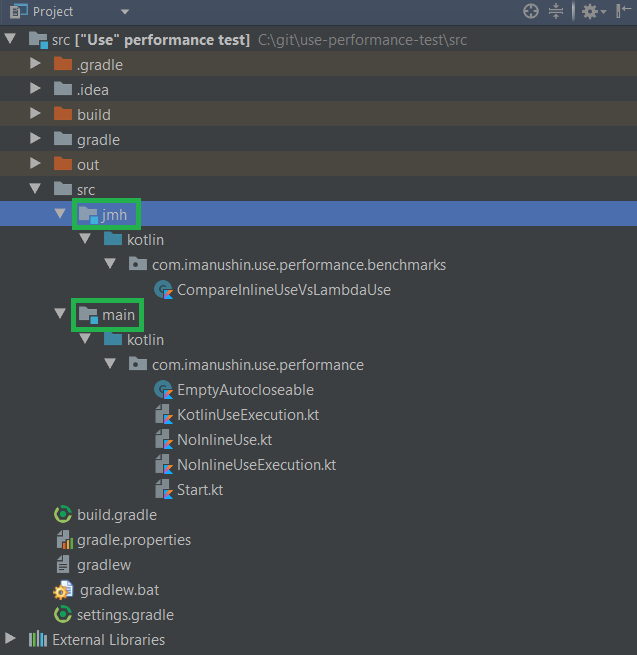
We get the following directory hierarchy:
- src
- jmh / kotlin / <java package name> / <code that runs tests (and annotated with JMH attributes)>
- main / kotlin / <java package name> / <code for testing>
Or what it looks like in IntelliJ Idea:
As a result, after setting up the project, you can run tests with a simple call .\gradlew.bat jmh (or .\gradlew jmh for Linux, Mac, BSD)
With the plugin there are a couple of interesting features on Windows:
- JMH uses the fork java process. In the case of Windows, this is not so easy to do, and then a new process is simply started with the same classpath. And the entire list of jar files is transmitted via the command line, the size of which is limited. As a result, if GRADLE_USER_HOME (the folder that contains the gradle cache) is in the depth of the file structure, the list of jar files for fork becomes so large that Windows refuses to start the process with such an enormous number of command line arguments. Therefore, if JMH refuses to fork, simply move the Gradle caches to a folder with a short name, i.e. write GRADLE_USER_HOME to environment variable with something like c: \ gradle
- Sometimes the previous JMH process makes a lock on a file (perhaps byte code rewrite does this). As a result, re-compilation may not work, since the file with our benchmark is opened by someone to write. To fix this problem, you just need to stop the dedle gradle processes (which are already running to speed up the compiler):.
.\gradlew.bat --stop - For the purity of experiments, it is better to abandon the incremental build for our tests. From here, we always call before testing
.\gradlew.bat clean
Testing
As an example, I will take the question (previously asked at the kotlin discussions ) that tormented me earlier - why does the inline construction use the inline method?
In Java, there is a pattern - try with resources , which allows you to automatically call the close method inside a block, moreover, it is safe to handle exceptions without blocking the already flying ones. Analog from the .Net world - using construct for IDisposable interfaces.
Sample java code:
try (BufferedReader reader = Files.newBufferedReader(file, charset)) { // try /* reader'*/ } Kotlin has a complete equivalent , which has a slightly different syntax:
Files.newBufferedReader(file, charset)).use { reader -> /* reader'*/ } That is, as can be seen:
- Use is just an extension method , not a separate language construct.
- Use is an inline method, that is, the same constructs are embedded in each method, which increases the size of the bytecode, which means that in JIT theory, it will be more difficult to optimize the code, etc. And we will check this theory .
So, you need to do two methods:
- The first will simply use use, which comes in the kotlin library.
- The second will use the same methods, however without inline. As a result, an object with parameters for the lambda will be created for each call on the heap.
Code with JMH attributes that will run different functions:
@BenchmarkMode(Mode.All) // @Warmup(iterations = 10) // @Measurement(iterations = 100, batchSize = 10) // , open class CompareInlineUseVsLambdaUse { @Benchmark fun inlineUse(blackhole: Blackhole) { NoopAutoCloseable(blackhole).use { blackhole.consume(1) } } @Benchmark fun lambdaUse(blackhole: Blackhole) { NoopAutoCloseable(blackhole).useNoInline { blackhole.consume(1) } } } Dead code elimination
Java Compiler & JIT is pretty smart and has a number of optimizations, both in compile time and in runtime. The method below, for example, may well fold into one line (for both kotlin and java):
fun sum() : Unit { val a = 1 val b = 2 a + b; } And in the end we will test the method:
fun sum() : Unit { 3; } However, the result is not used in any way, because compilers (byte code + JIT) will eventually throw out the method altogether, since it is not needed in principle.
To avoid this, in JMH there is a special class "black hole" - Blackhole. There are methods in it that, on the one hand, do nothing, and on the other hand, they do not allow JIT to throw out the branch with the result.
And in order for javac not to try to add a and b during the compilation process, we need to define a state object in which our values will be stored. As a result, in the test itself, we will use the already prepared object (that is, do not waste time on its creation and do not allow the compiler to apply optimization).
As a result, for competent testing of our function, it is required to write it in this form:
fun sum(blackhole: Blackhole) : Unit { val a = state.a // a val b = state.b val result = a + b; blackhole.consume(result) // JIT , - - } Here we took a and b from some state, which will prevent the compiler from immediately counting the expression. And we sent the result to a black hole, which would prevent JIT from throwing out the last part of the function.
Returning to my function:
- I will create an object for calling the close method in the test itself, since almost always when we called the close method, we have created an object before.
- Inside our method, we will have to call the function from the blackhole in order to provoke the creation of lambda on the heap (and not to let the JIT throw out potentially unnecessary code).
Test result
Having ./gradle jmh , and then having waited two hours, I received the following results of work on my mac mini:
# Run complete. Total time: 01:51:54 Benchmark Mode Cnt Score Error Units CompareInlineUseVsLambdaUse.inlineUse thrpt 1000 11689940,039 ± 21367,847 ops/s CompareInlineUseVsLambdaUse.lambdaUse thrpt 1000 11561748,220 ± 44580,699 ops/s CompareInlineUseVsLambdaUse.inlineUse avgt 1000 ≈ 10⁻⁷ s/op CompareInlineUseVsLambdaUse.lambdaUse avgt 1000 ≈ 10⁻⁷ s/op CompareInlineUseVsLambdaUse.inlineUse sample 21976631 ≈ 10⁻⁷ s/op CompareInlineUseVsLambdaUse.inlineUse:inlineUse·p0.00 sample ≈ 10⁻⁷ s/op CompareInlineUseVsLambdaUse.inlineUse:inlineUse·p0.50 sample ≈ 10⁻⁷ s/op CompareInlineUseVsLambdaUse.inlineUse:inlineUse·p0.90 sample ≈ 10⁻⁷ s/op CompareInlineUseVsLambdaUse.inlineUse:inlineUse·p0.95 sample ≈ 10⁻⁷ s/op CompareInlineUseVsLambdaUse.inlineUse:inlineUse·p0.99 sample ≈ 10⁻⁷ s/op CompareInlineUseVsLambdaUse.inlineUse:inlineUse·p0.999 sample ≈ 10⁻⁵ s/op CompareInlineUseVsLambdaUse.inlineUse:inlineUse·p0.9999 sample ≈ 10⁻⁵ s/op CompareInlineUseVsLambdaUse.inlineUse:inlineUse·p1.00 sample 0,005 s/op CompareInlineUseVsLambdaUse.lambdaUse sample 21772966 ≈ 10⁻⁷ s/op CompareInlineUseVsLambdaUse.lambdaUse:lambdaUse·p0.00 sample ≈ 10⁻⁸ s/op CompareInlineUseVsLambdaUse.lambdaUse:lambdaUse·p0.50 sample ≈ 10⁻⁷ s/op CompareInlineUseVsLambdaUse.lambdaUse:lambdaUse·p0.90 sample ≈ 10⁻⁷ s/op CompareInlineUseVsLambdaUse.lambdaUse:lambdaUse·p0.95 sample ≈ 10⁻⁷ s/op CompareInlineUseVsLambdaUse.lambdaUse:lambdaUse·p0.99 sample ≈ 10⁻⁷ s/op CompareInlineUseVsLambdaUse.lambdaUse:lambdaUse·p0.999 sample ≈ 10⁻⁵ s/op CompareInlineUseVsLambdaUse.lambdaUse:lambdaUse·p0.9999 sample ≈ 10⁻⁵ s/op CompareInlineUseVsLambdaUse.lambdaUse:lambdaUse·p1.00 sample 0,010 s/op CompareInlineUseVsLambdaUse.inlineUse ss 1000 ≈ 10⁻⁵ s/op CompareInlineUseVsLambdaUse.lambdaUse ss 1000 ≈ 10⁻⁵ s/op Benchmark result is saved to /Users/imanushin/git/use-performance-test/src/build/reports/jmh/results.txt Or, if you reduce the table:
Benchmark Mode Cnt Score Error Units inlineUse thrpt 1000 11689940,039 ± 21367,847 ops/s lambdaUse thrpt 1000 11561748,220 ± 44580,699 ops/s inlineUse avgt 1000 ≈ 10⁻⁷ s/op lambdaUse avgt 1000 ≈ 10⁻⁷ s/op inlineUse sample 21976631 ≈ 10⁻⁷ s/op lambdaUse sample 21772966 ≈ 10⁻⁷ s/op inlineUse ss 1000 ≈ 10⁻⁵ s/op lambdaUse ss 1000 ≈ 10⁻⁵ s/op As a result, there are two most important metrics:
- The inline method showed a performance of
11,6 * 10^6 ± 0,02 * 10^6operations per second. - The Lambda-based method showed a performance of
11,5 * 10^6 ± 0,04 * 10^6operations per second. - The inline method works faster and more stable in speed. Probably, the increased error for lambdaUse is connected with more active work with memory.
- I was wrong on that forum - it is better to leave the current implementation of the method in the standard kotlin library.
Conclusion
When developing software, there are two fairly frequent ways to compare performance:
- Measurement of the speed of the cycle with N iterations of the experimental function.
- Philosophical reasoning of the form "I am sure that the shift is faster than the multiplication by 2", "how much I program, always XML serialization was the fastest" and so on.
However, as any technically savvy professional knows, both of these options often lead to erroneous judgments, brakes in applications, etc. I hope this article will help you make good and fast software.
')
Source: https://habr.com/ru/post/349914/
All Articles