Blue Shift or iOS application launch time optimization. Yandex lecture
It would seem that when you download the application, you can suffer a second or two. But when your program is used frequently, and in competitors - an analogue from the manufacturer of the OS itself, even the launch time starts to affect. Yandex developer Victor Bryksin bobermaniac spoke at a meeting of the CocoaHeads community in the office of our colleagues at Mail.Ru and told how to make the iOS application run faster.
- For a long time I was engaged in the development of Yandex Browser. Actually, from the optimization of the start time of this application, my report was born.
The problems we solved in the browser are common to all iOS applications. If you take the phone and run something, then, most likely, you will watch the splash screen for 2-3 seconds. My personal record holder is 7 seconds, I will not call the application, but this is amazing: while you open and look at the beautiful picture, you have already forgotten what you wanted to do with this application.
Our browser could not afford this. The browser has a number of scripts that require the application to respond immediately. The user should be able to quickly, on the fly, open the browser, drive something into the search line, get an answer or read something on the run. Probably, you are also on the run, in subway crossings, reading some articles in fragments, because there is not much time.
')
Naturally, the browser has features that we cannot just get rid of - for the sake of them, users use our product.
In addition, we have competitors. And one of our main competitors, the iOS-built browser Safari, which hangs over us with a hundred-ton weight, occupies the same dominant position as IE had in Windows at one time, if you remember. We also have to compete with it, so we need to constantly reduce the launch time of our browser.
At one time we approached this problem with the naivety peculiar to all developers. In their opinion, to optimize something, the profiler and own experience is enough.
At some point, the manager came up to us and said that the application was dumb, slow, everything was bad. The developers said - ok, let's see, optimize, everything will be fine.
Optimized. The result was an assembly, which the testing itself took and sat down with a stopwatch, because it was necessary to check that we did everything correctly, did not fix it anywhere, and everything starts faster. With a stopwatch, they measured the start time, made sure that it became smaller, everything is fine.
In the future, this approach has evolved. Instead of planting a tester and giving him a stopwatch, we started using video. They shot the video before optimization and after, superimposed on each other, looked frame by frame, where what element of the browser appears, how it reacts, is everything good?
In the future, the manager felt in his video editor. He started shooting five videos before, five videos after, to level the effects associated with randomness. Everyone knows that sometimes the start time depends on the weather on Mars, and nothing can be done about it.

The manager acquired the skills of a video editor, but this did not help us. This approach had a huge amount of problems.
First of all, we remembered optimization only when everything started to slow down. We optimized, and after a while it all degraded. Someone makes other changes, new features appear, and over time, everything again becomes very bad. And we did not have the tools to control it. And if we do not want to lose some effect, we need to exercise continuous monitoring. Unfortunately, the version with the video that we used is laborious enough to use it constantly. He did not suit us.

Therefore, today we will talk about how to build the launch time optimization process correctly, if you really want to get some effect and maintain it for a long time.
First of all, we will talk about metrics - without them, no process is possible at all, especially such as optimization.
We will talk about the fact that from the experience of others managed to adapt for themselves. Let's talk about the project Fake UI - thanks to him we managed to build an interface that literally flies into the face of the user and says: "Work with me faster."
Briefly tell about the elimination of hot spots. This is a topic in which everybody who has been involved in optimization has a little understanding. About the lazy services that brought us a lot of problems, and about the assessment, which we end up with.
Let's start with the metrics. Here is the first and most important thing to go with this report. If you do not have convenient metrics, you can never make a convenient optimization that will be supported. An example from a video. The manager needs to spend a lot of time to remove the metrics from the video, we could not shoot them all the time. As a result, it was done somehow, everything was lost, and most importantly, we could not find in the interval where this or that optimization was lost. Therefore, the more often we remove metrics, the better for us.
Metrics should be removed quickly, often, be simple and understandable. For the browser, we all divided the metrics divided into two large groups - main and auxiliary. The main ones are those that are directly sensed by the user, which influence his or her perception of the browser, and those that it sees. They should be quantitative, it is easy to work with numbers, you can add them, subtract, even subtract square roots, but I personally did not try. And most importantly - they must be objective. As the tester's example with a stopwatch showed, too many stochastic factors lead to the fact that the metric, instead of showing the effect of the improvements being made, begins to show the temperature outside the window.
Core metrics are what we want to improve during the product development process. There are auxiliary metrics. They are very similar to the main ones, except for the fact that they already exist in the developer’s world. These are some things that are not visible to users, but the developer will be told about what is happening in his product, much more than the usual number.

For Yandex.Browser, we selected four metrics. Two of them are auxiliary, there are for the developer, and two main ones.
All these metrics are numbers that show the number, conditionally, of seconds that pass from the moment when the user pokes on the application icon.
The first point we take off is the moment when Main starts. The second, as soon as the RootViewController appeared in the window hierarchy and it has a View. We remove the point at which ViewWillAppear is running.
The third metric is ViewDidAppear. The fourth, most interesting, is that at the end of ViewDidAppear we launch the main stream using the Dispatch Async block. And the moment when it is executed, this is the fourth position, which we called the UI Ready, the most important. We will often continue to use in the future. And we will give the main estimates on it.
Briefly about what each of these numbers mean. Main shows the most understandable thing - this is the moment when we started the application, the whole image is launched into memory, load and initialise occur, all that concerns the dynamically loaded libraries is there. It shows the effect of those libraries that we have loaded into the project.
After that, application: didFinishLaunchingWithOptions is executed, naturally. Some services are configured that will be used in the future, and after that comes the ViewDidAppear moment.
Therefore, the second number of ViewDidAppear shows the effect of the configured, already our own user services.
In turn, ViewDidAppear as the main metric shows the moment when the user finally saw on the screen the interface of the application with which he intends to work.
Finally, UI Ready. At the moment when the interface is shown, it can be blocked by a huge amount of code that still needs to be executed on the main thread. Because of this, the user sees, but can not touch.
The fourth metric of UI Ready, when we plan a block on the main thread, shows when it has finally unloaded, and the user can interact with our application.
The main hypothesis from which we repelled that if we reduce the UI Ready metric, that is, the moment when the user can work with the application, the user will notice, understand that for him it is good, he can enjoy the product more. This means that we will grow product metrics, such as the return percentage. That is, we have to observe a correlation on the graphs: the start time of the UI Ready goes down - the product metrics go up.
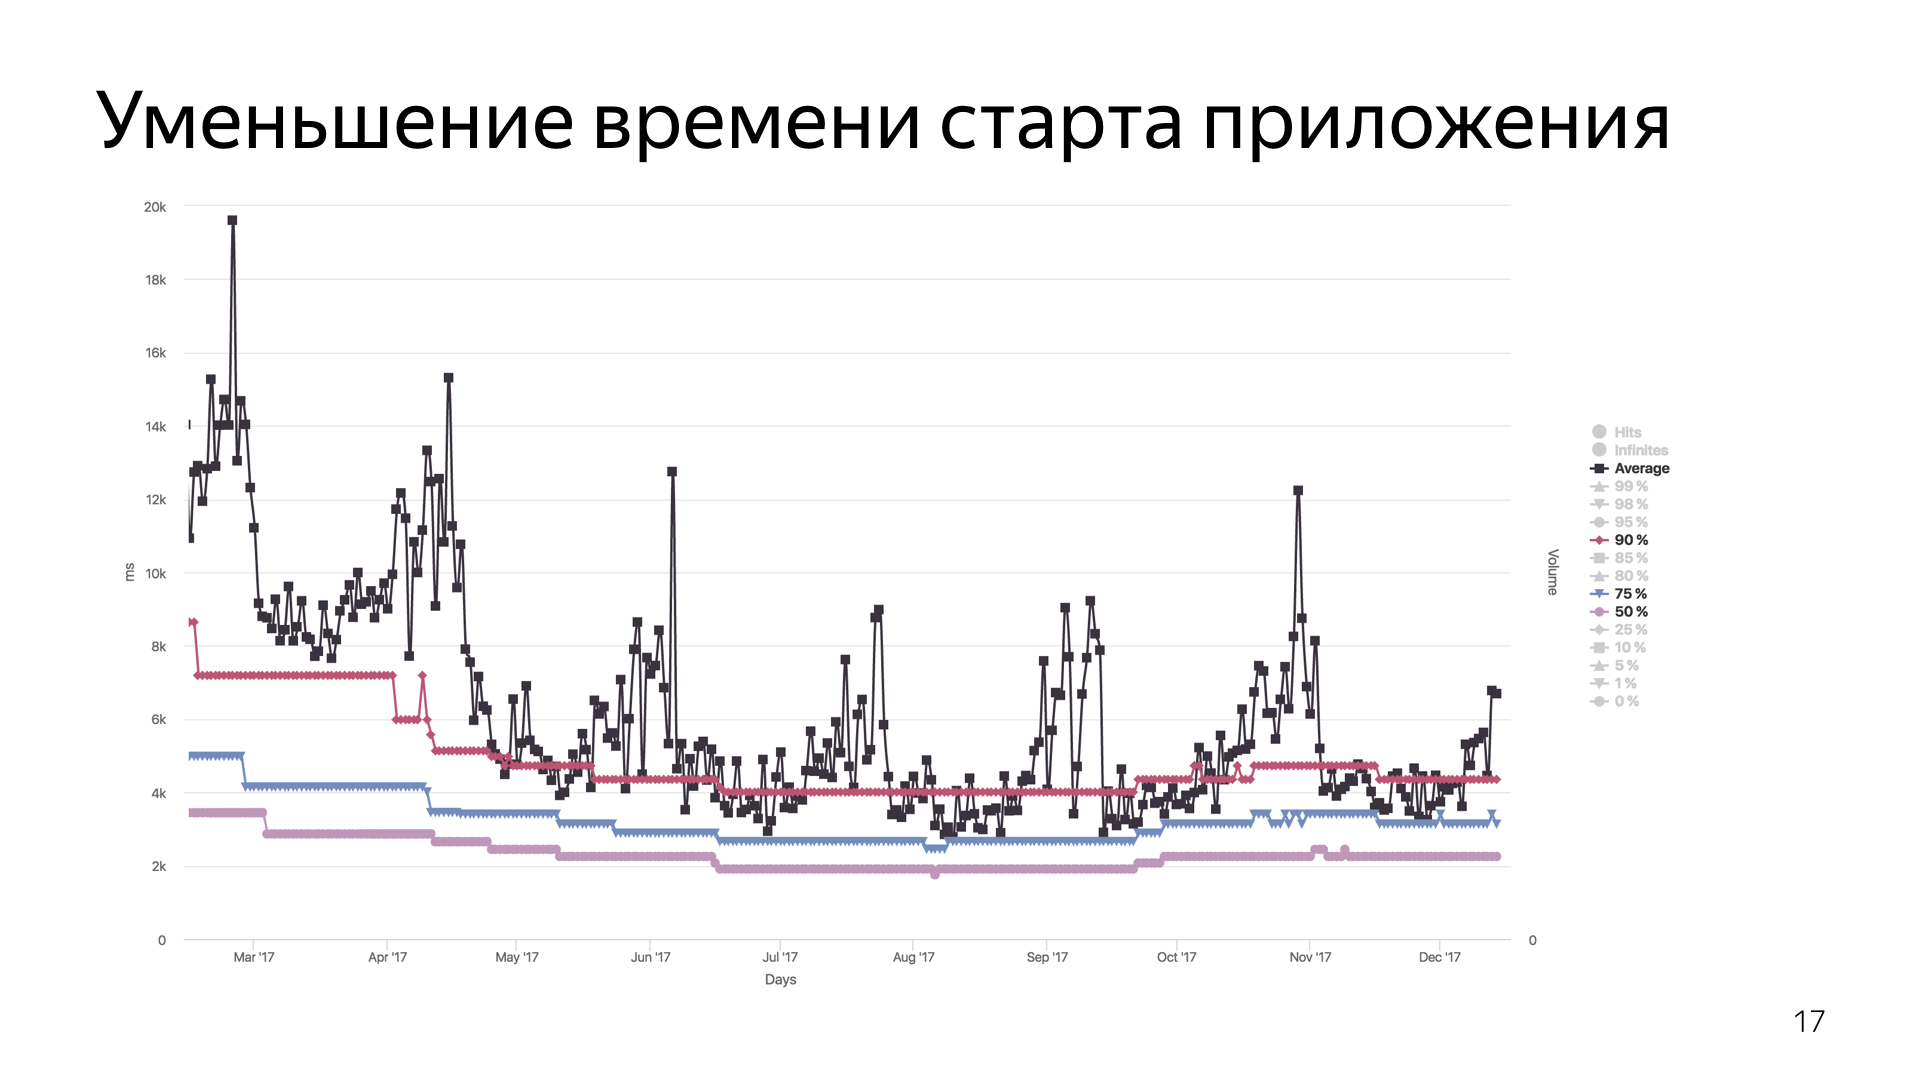
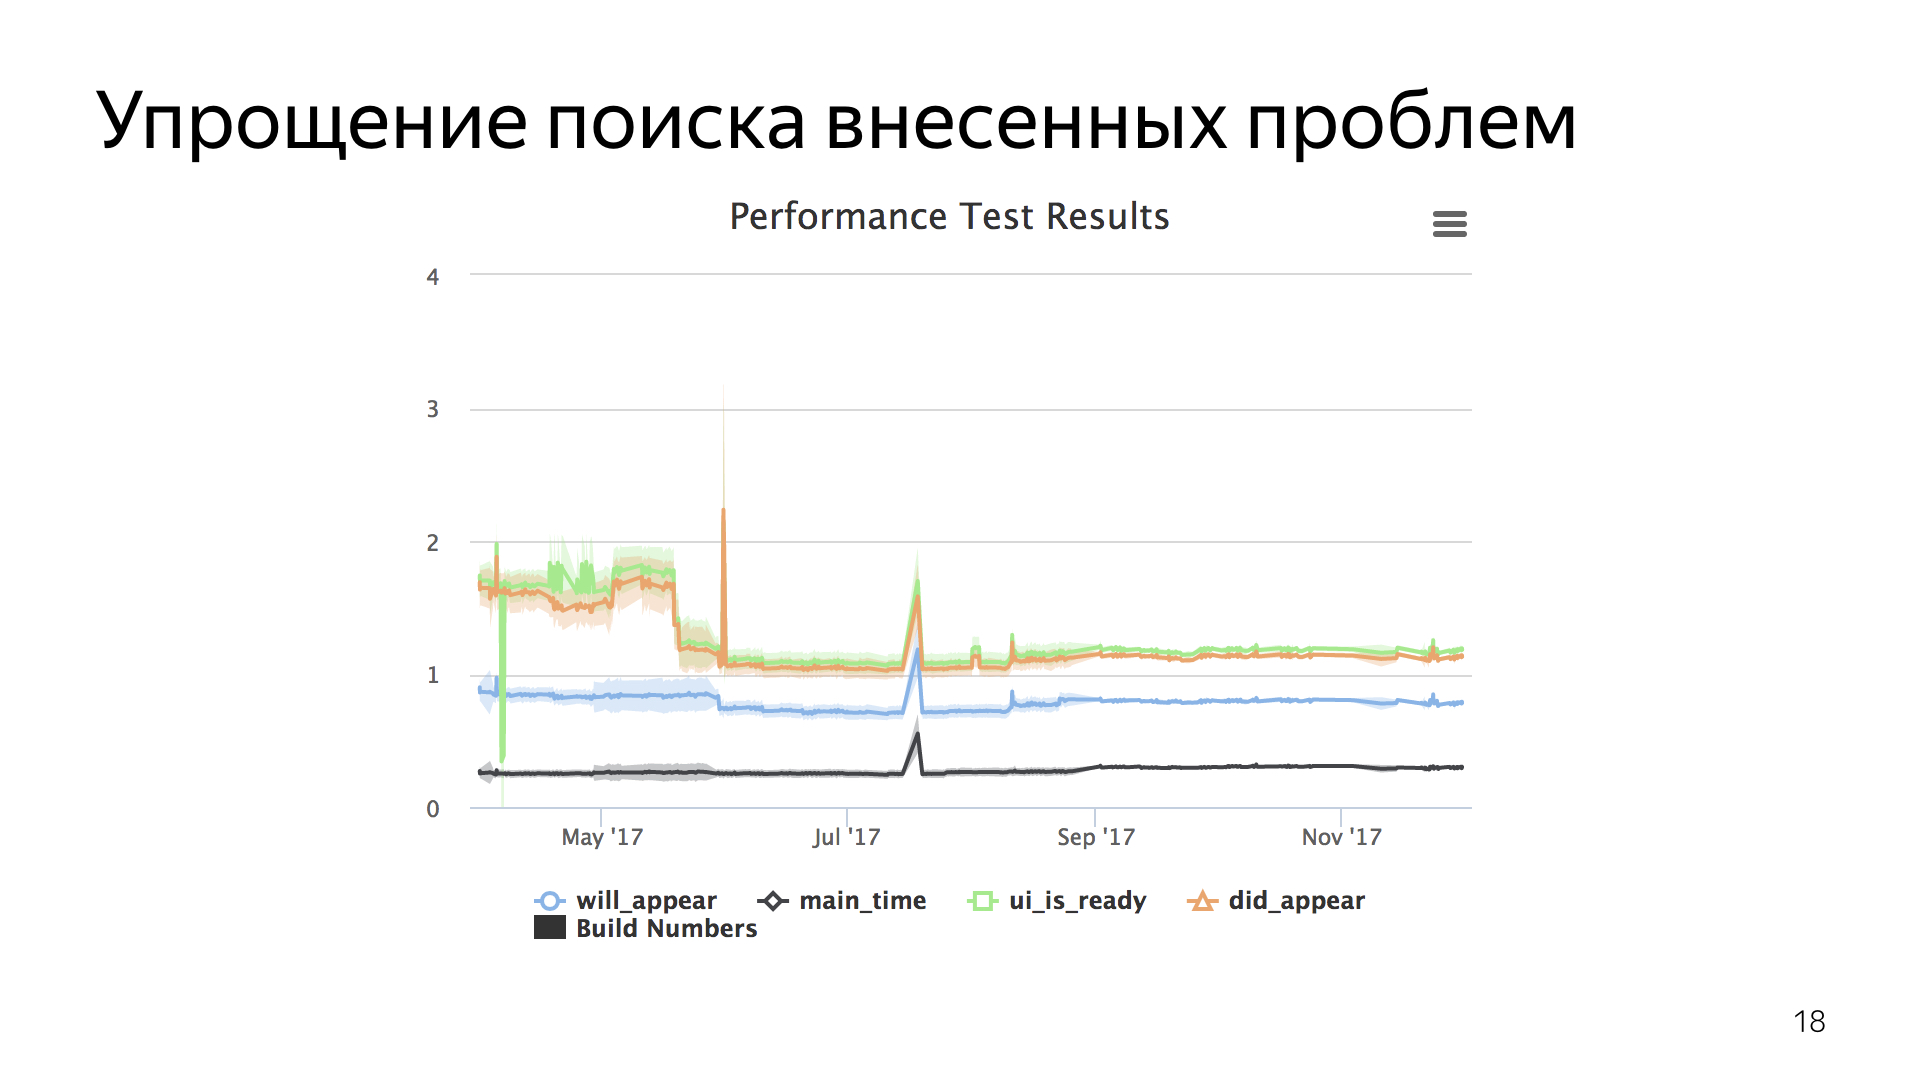
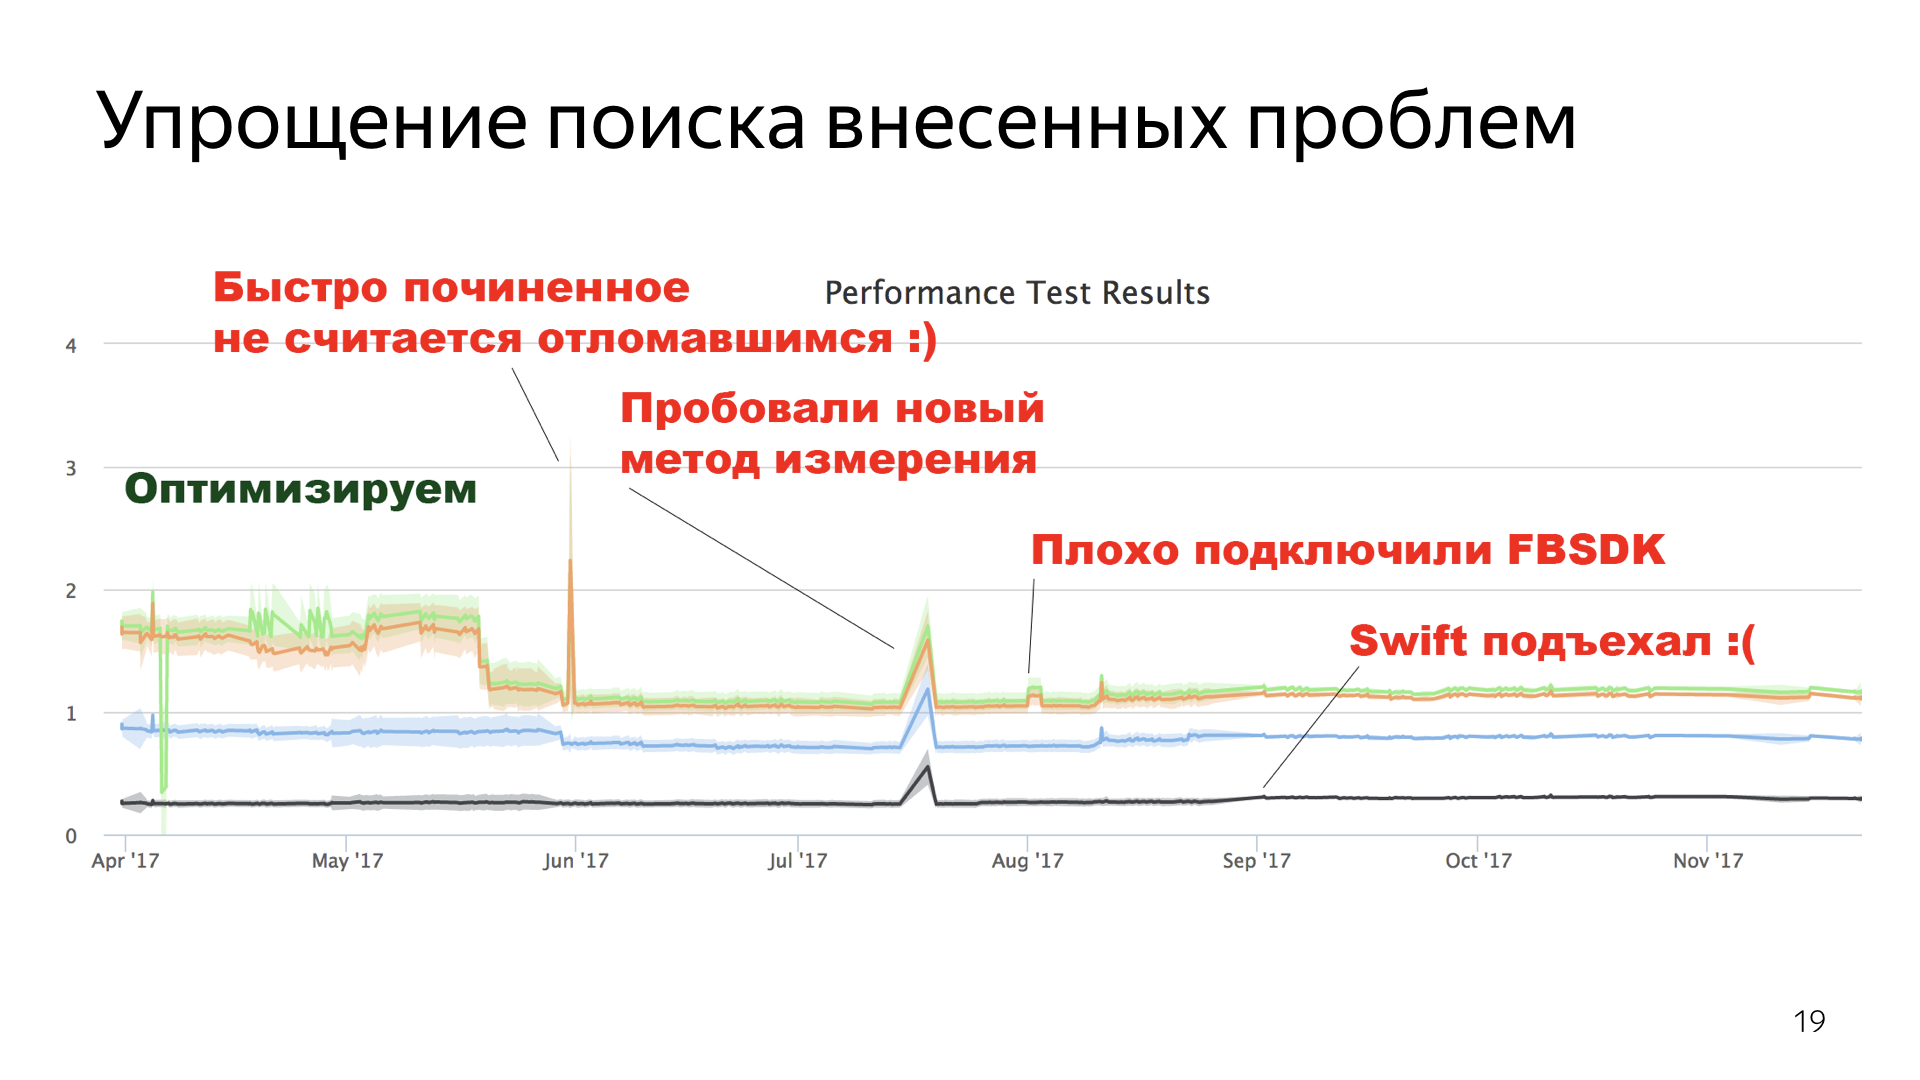
To evaluate the effect of optimization, we collect metrics from developers. As soon as the developer does something, we take his assembly, after the pull request has joined the master, we are constantly assembling the assembly from the master and sending it to a special testing stand. This is a regular Mac connected to the network to which the device is connected, we had an iPad Mini based on iOS 8, as the most braking device at that time. An assembly is put on it, and it is launched several hundred times. Each time we get some numbers on all four metrics, collect them, average them and send them to a special stand, where a beautiful graph of how time changes over time is built using these numbers. Later I will show these graphs.
We use these numbers to quickly understand what the changes we are making to the project lead to.
Naturally, we do it for users, and we collect metrics from users too. Those users who allowed sending anonymous statistics, we take these numbers and send them to ourselves. Naturally, the user can not be asked to run our application 200 times, but the number of users basically eliminates the effect of randomness here.
I hope you understand that metrics are important. And when you have such a problem, you will use this advice.
As for the experience that we have taken over from other people, first of all I would like to refer to the report of my colleague Nikolay Likhogrud - “Optimization of launch time of iOS applications”.

It primarily concerns the launch time of system things, such as loading dynamic libraries, as I said at the beginning, the Main metric, image loading. All this is very well described there, and we also used his advice, abandoned the dynamic libraries in the browser, everything is statistically linked.
Naturally, we abandoned Swift when we did all this, we still had iOS 7, for which Swift support strongly influenced the metrics and led to a huge increase in all numbers. We tried to use it, saw growth and abandoned this idea quickly enough.
Surprisingly, the improvement in speed showed just the transfer of resources from raw resources ... Who knows, we can simply put a picture in xcassets that are loaded much faster than raw resources. And for projects with a long history, when some things just don’t get touched by the fact that nobody needs it, it may be relevant if you still have raw resources in the project, I recommend to transfer them to xcassets, and you will get it out of the blue performance gain.
Unfortunately, we have libraries that negatively affect the start time. Apparently, due to the fact that multiple loads are performed there and a similar thing. First of all, we encountered this when using the Facebook SDK, for which we used lazy loading and late binding, in which we do not interact with this library directly, but use Dial D and other such things.
I will not have such a hardcore, like my colleagues. There will be many beautiful pictures.

The first problem in the browser is the kernel issue. Many people know or guess that the browser is based on the Chromium core, there is the code from our guys, it is fumbled between our desktop browser, mobile browser, and provides a lot of functionality, without which the browser would not be very useful.
The problem with the iOS version is that the kernel for iOS is a monolith. This is a large amount of code that loads simultaneously, works for a while, and only when it finally loads can we provide the user with some kind of functionality.
It was impossible to put up with it. The user seems to have seen the interface, but the kernel did not boot, the interface is locked, he can do nothing.
We decided to do something about it.
The first idea we had was - what if it was cut out? If the core slows down, let's just throw it out and there will be no problems, everything will be fine.
We did not even try. It is clear that when the kernel gives you a huge amount of reusable functionality, then throwing it out would be writing it from scratch, but using your own resources. To go for it is pointless, throwing out code that works to write another one that will work worse.
We went the other way. If there is a kernel-dependent UI that can't do anything without it, why not give the user a different UI? Small, which may not be able to do everything, but can work fine without a kernel, and which will allow the user to execute some set of scenarios characteristic of the mode when we need to quickly open the application and quickly do something in it.
Naturally, it will be interactive, it will be possible to write in it, and it should switch transparently to a large UI as soon as the kernel is loaded.
How did we do it with an example of such a component as Omnibox?
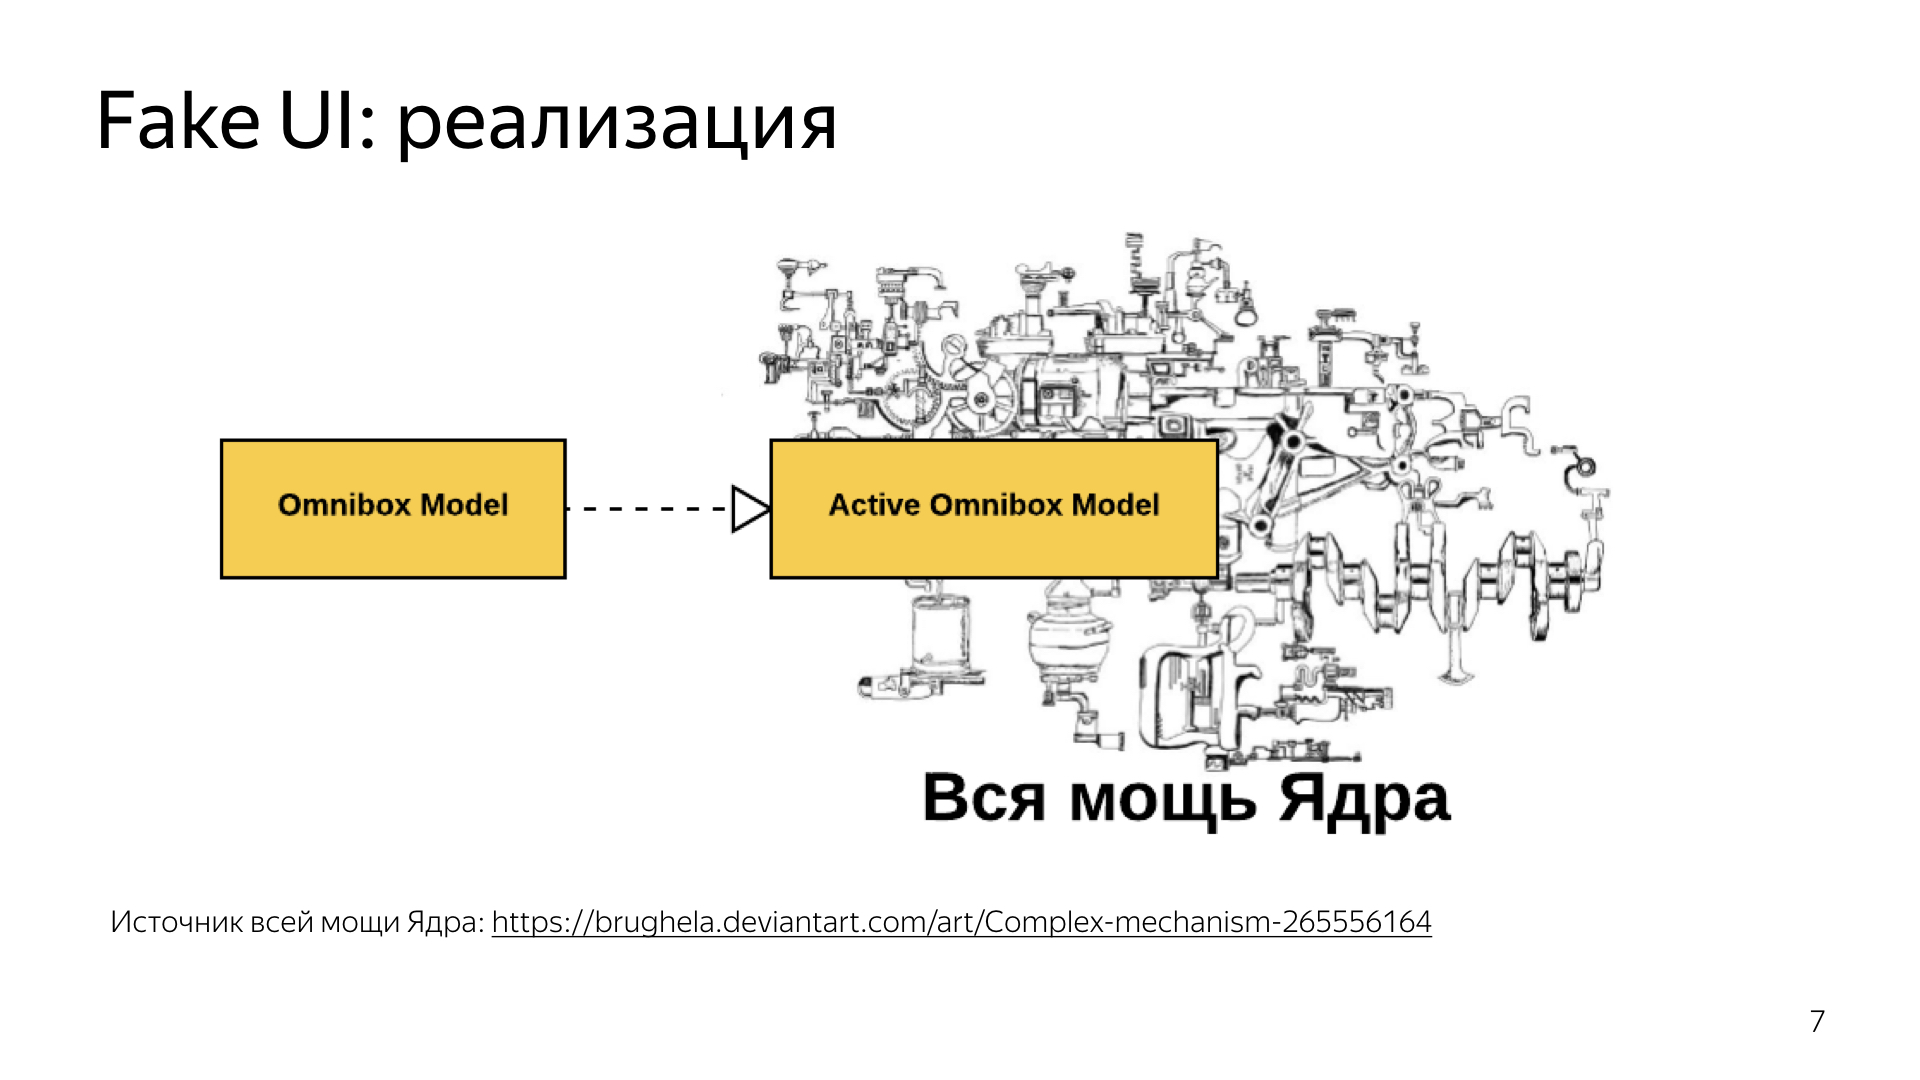
Everyone knows or guesses that the browser consists of a WebView and a text field for entering a request. Naturally, it is not. The field for entering a query is called Omnibox. The kernel gave a lot of things, such as sadgets, beautiful URL formatting, there was also work with the progress bar, and without it all Omnibox was a little functional. But we really wanted us to give the user the opportunity to take and enter something before the start.
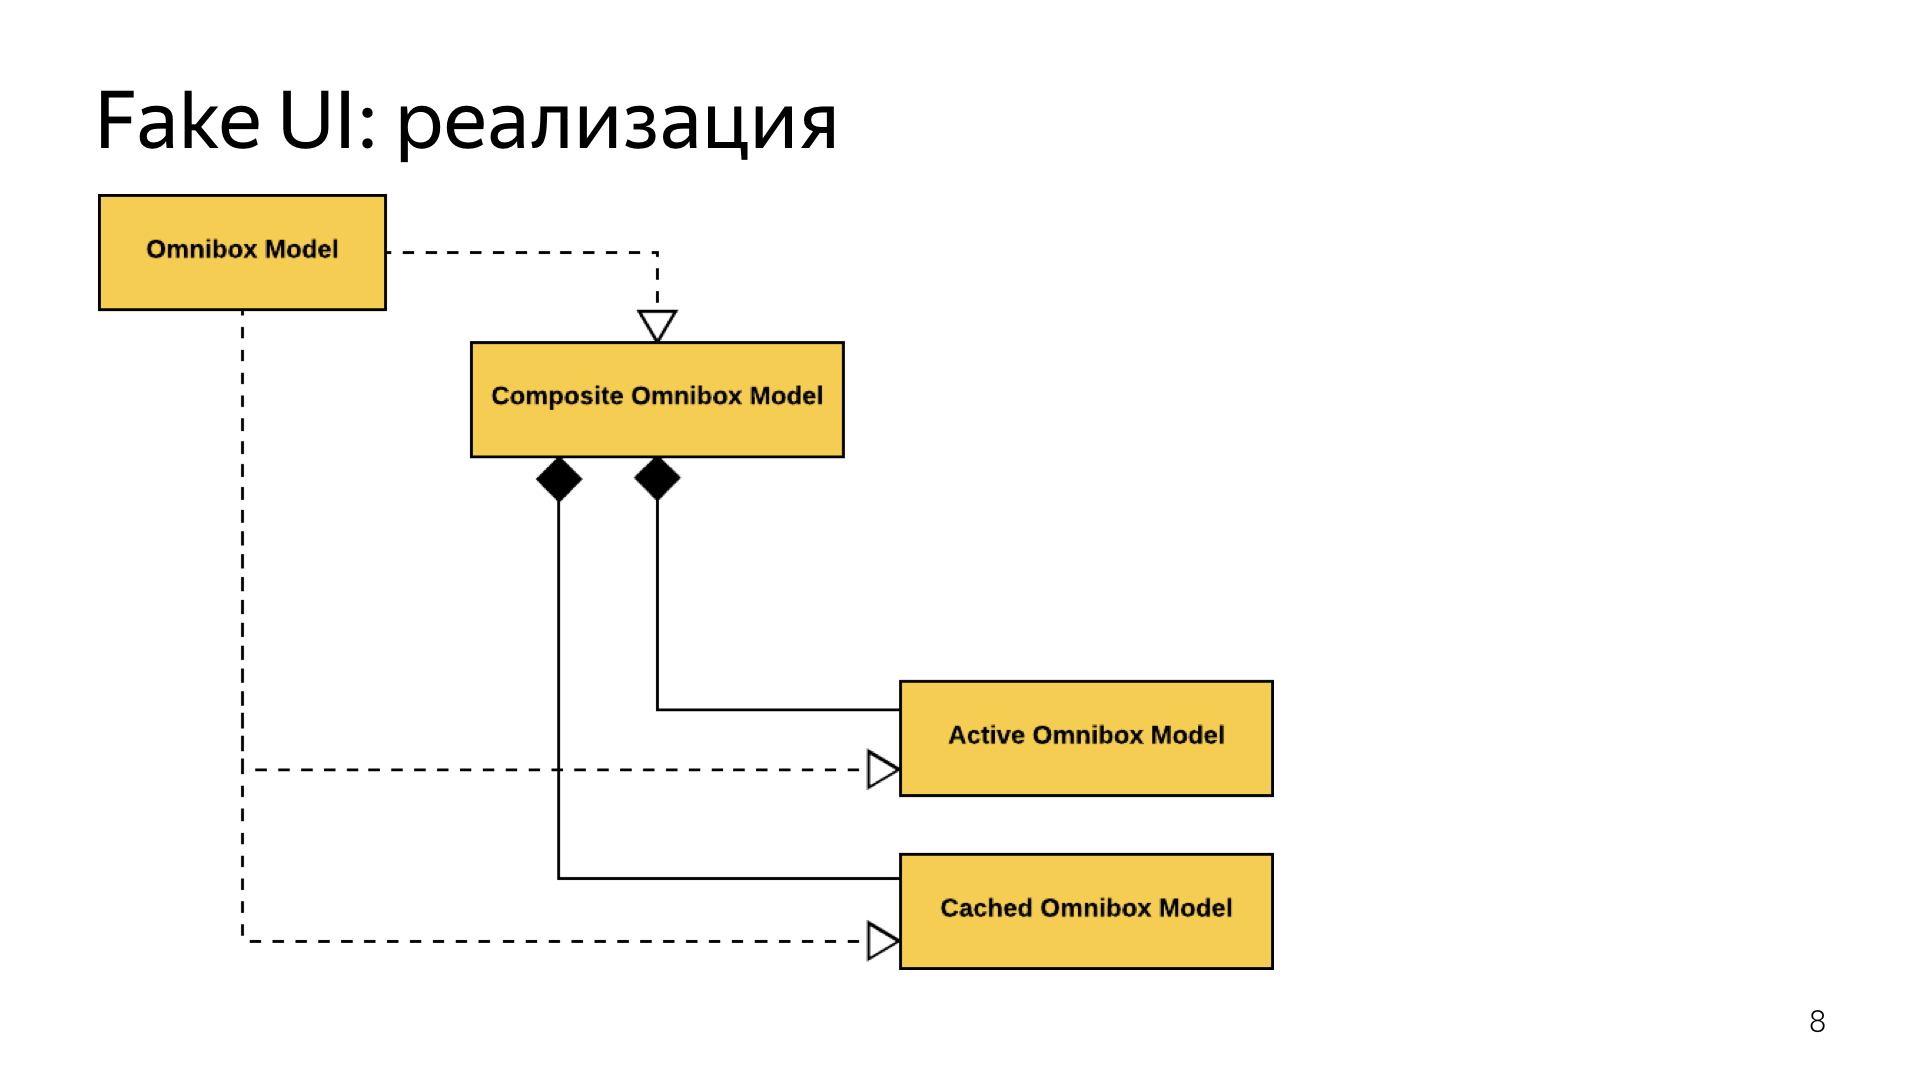
We took a large Omnibox and divided it into two. The old Omnibox model remained exactly the same, it also worked with the kernel. Nearby, we put a new model, which was completely cut off from it, worked with some cached data, we merged them into one large composite that routed calls depending on whether the kernel was loaded or not.
While the kernel is not loaded, our calls went to the cached Omnibox and the answers came from there. As soon as the kernel was loading, we switched.
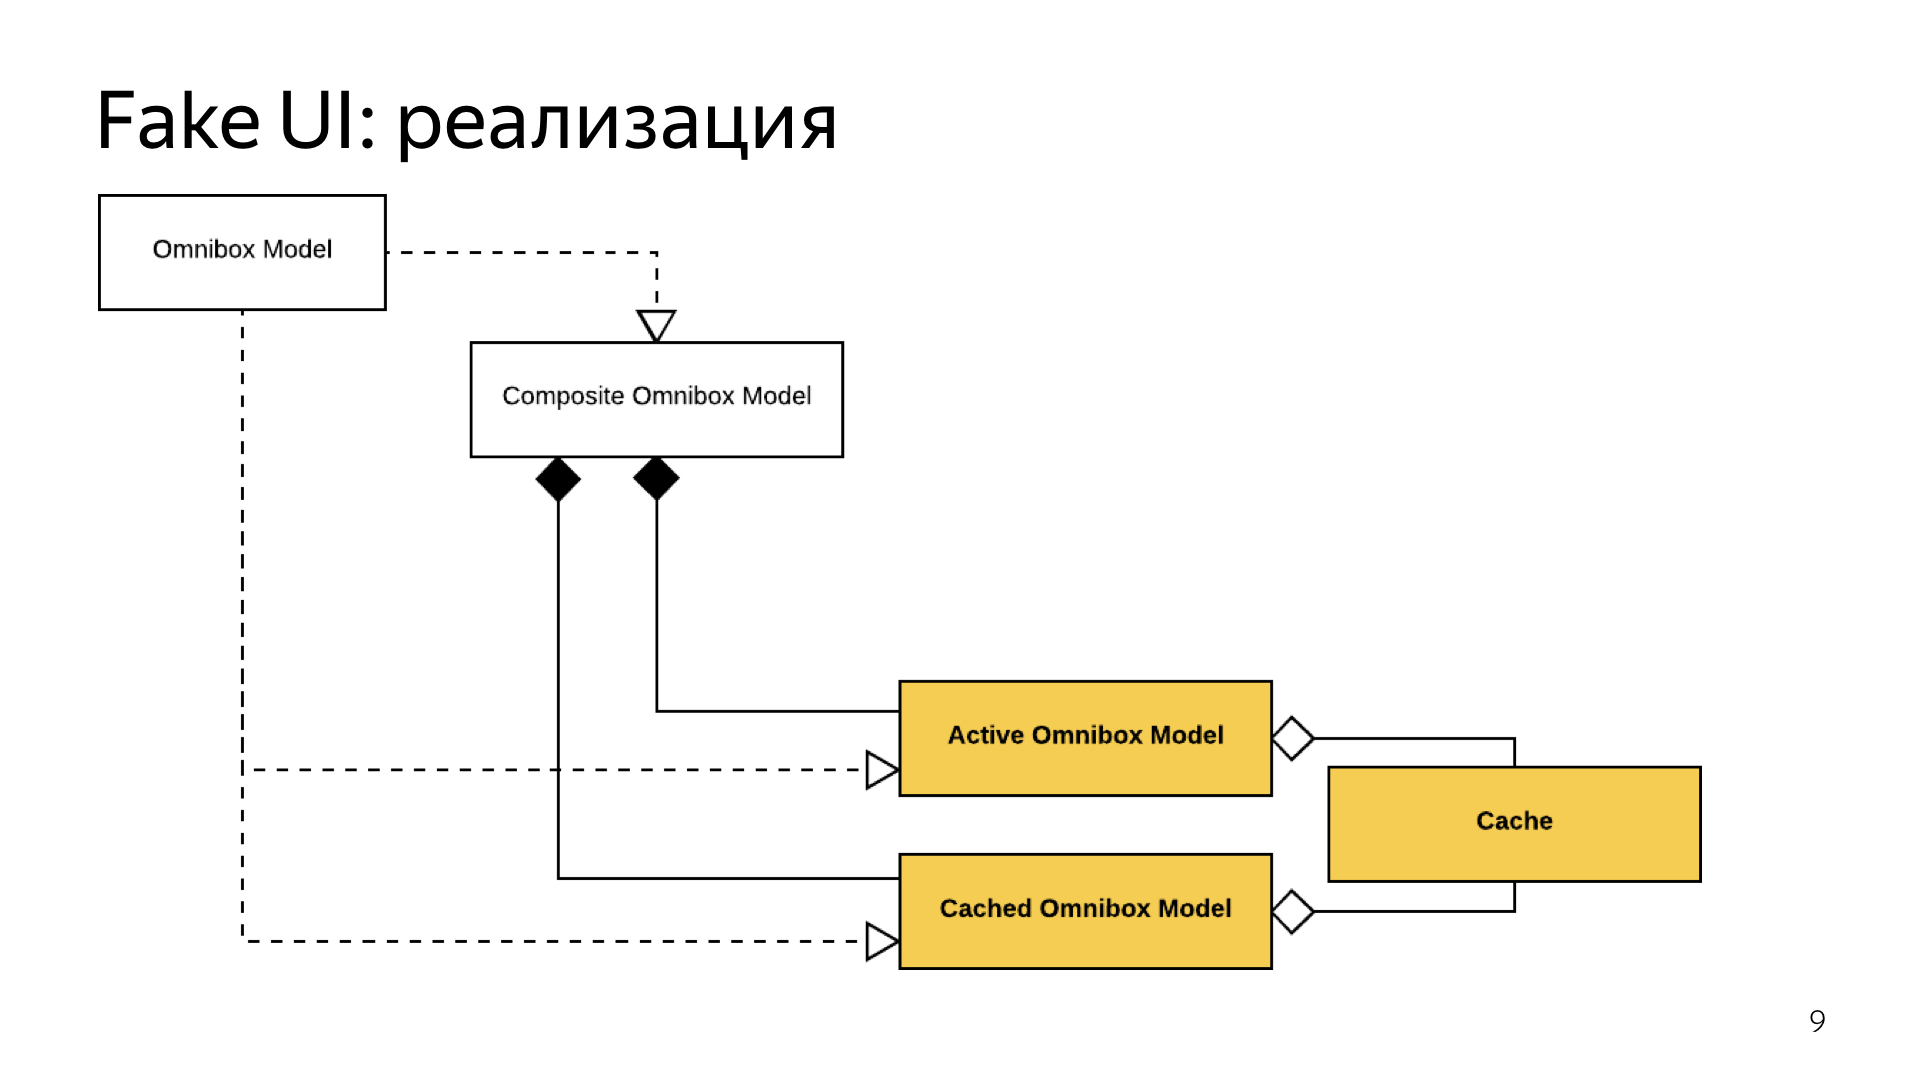
To prevent the user from feeling that something broke, when he unloaded the browser, then launched it again and saw an empty Omnibox, and just that it was full, we made a small cache. The large Omnibox, which depends on the kernel, wrote to this cache, and the cached Omnibox, as soon as it was up, read from this cache and gave the user the state with which it remained.
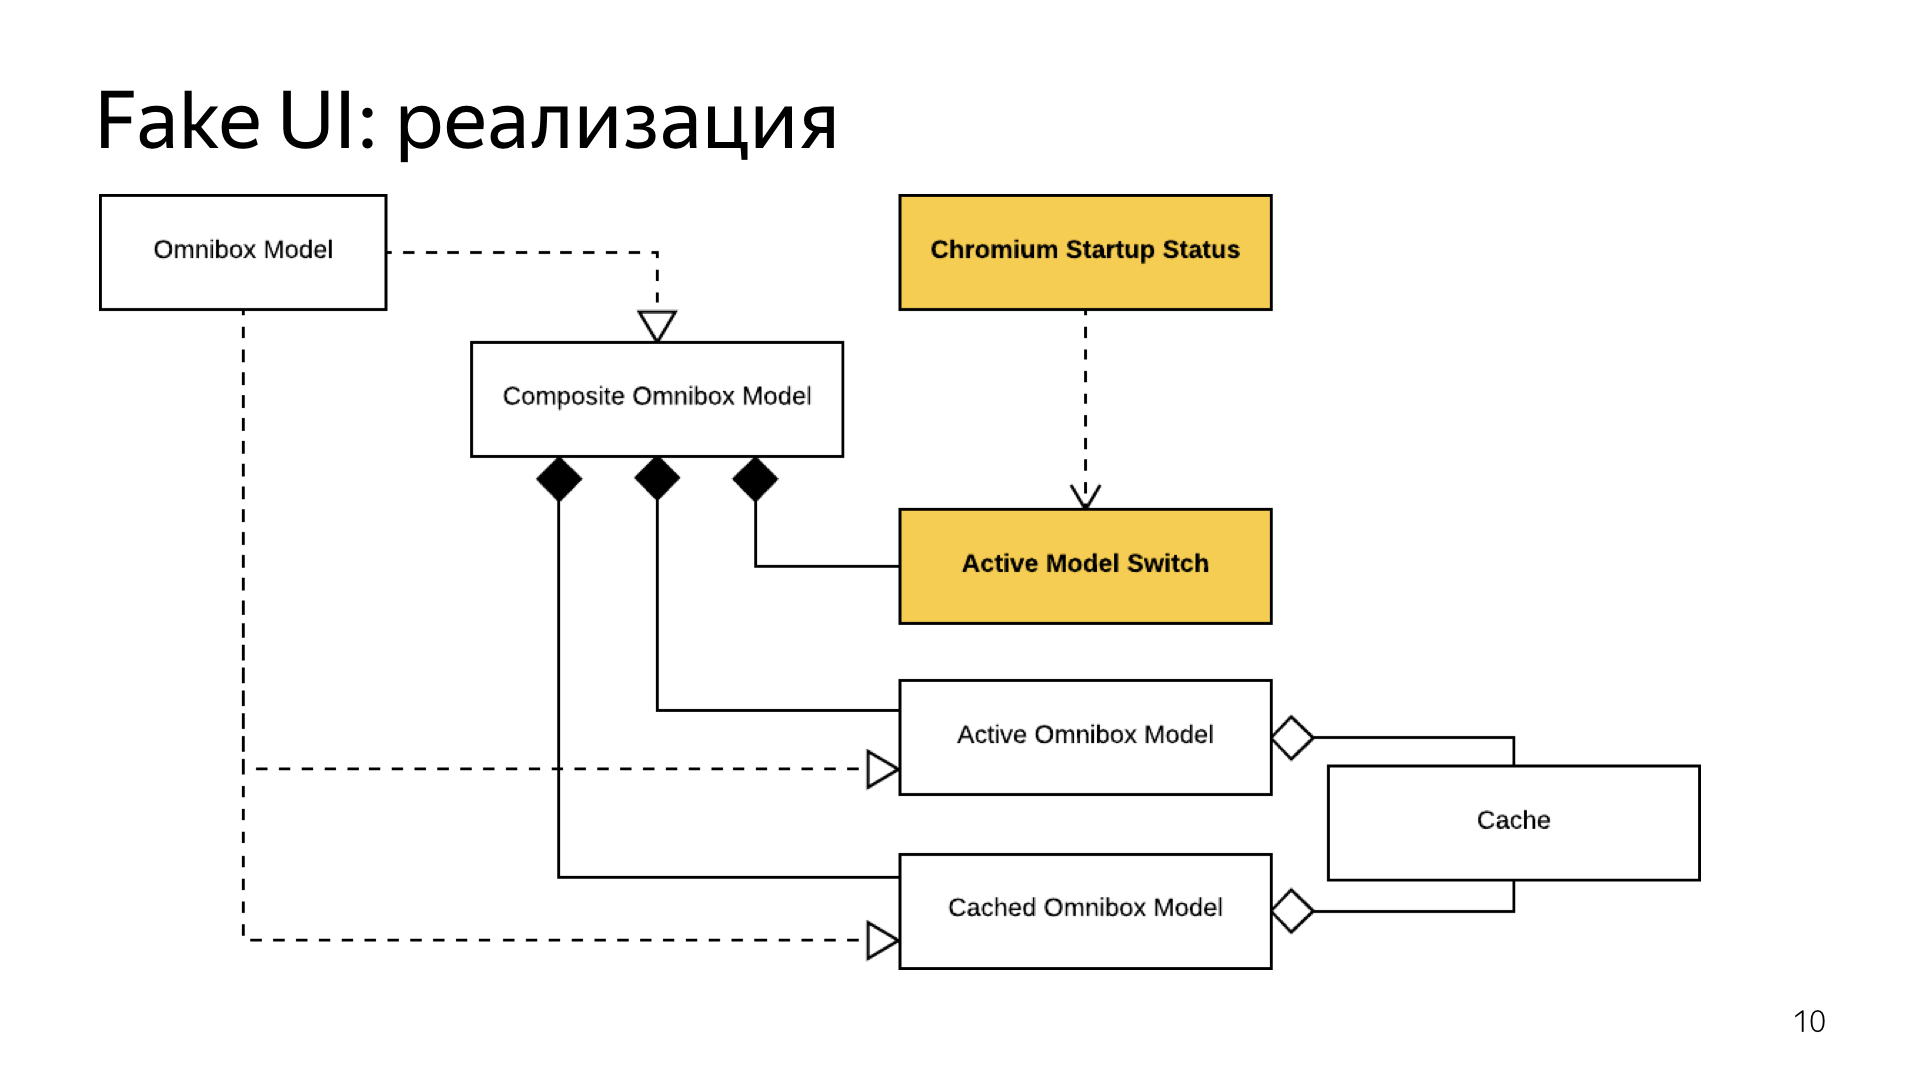
And to support seamless switching, we made a small component that, at the moment when the kernel finally starts, actually synchronizes the Omnibox caching state with the normal one. And for the user, everything looks as if he just launched a browser, started doing something in it and the browser just works. He does not even notice the moment of switching.
At the same time, the interface started much faster. As I said before, before the start of the kernel, we just did UserInteractionEnabled = null, and no, dear user, you will not do anything. Now we resolved UserInteraction, and saw that the problems remained.
Unfortunately, in addition to the kernel, we had our own services, written by us. Some of them also depended on the kernel and were very fond of subscribing to a callback, which signaled that the kernel was finally running.
At that moment, when the kernel was loaded, all these services happily ran to initialize, and clogged the main thread, as a result, the interface is there, it would be possible to interact with it, but the main thread is clogged, no message passes into it.
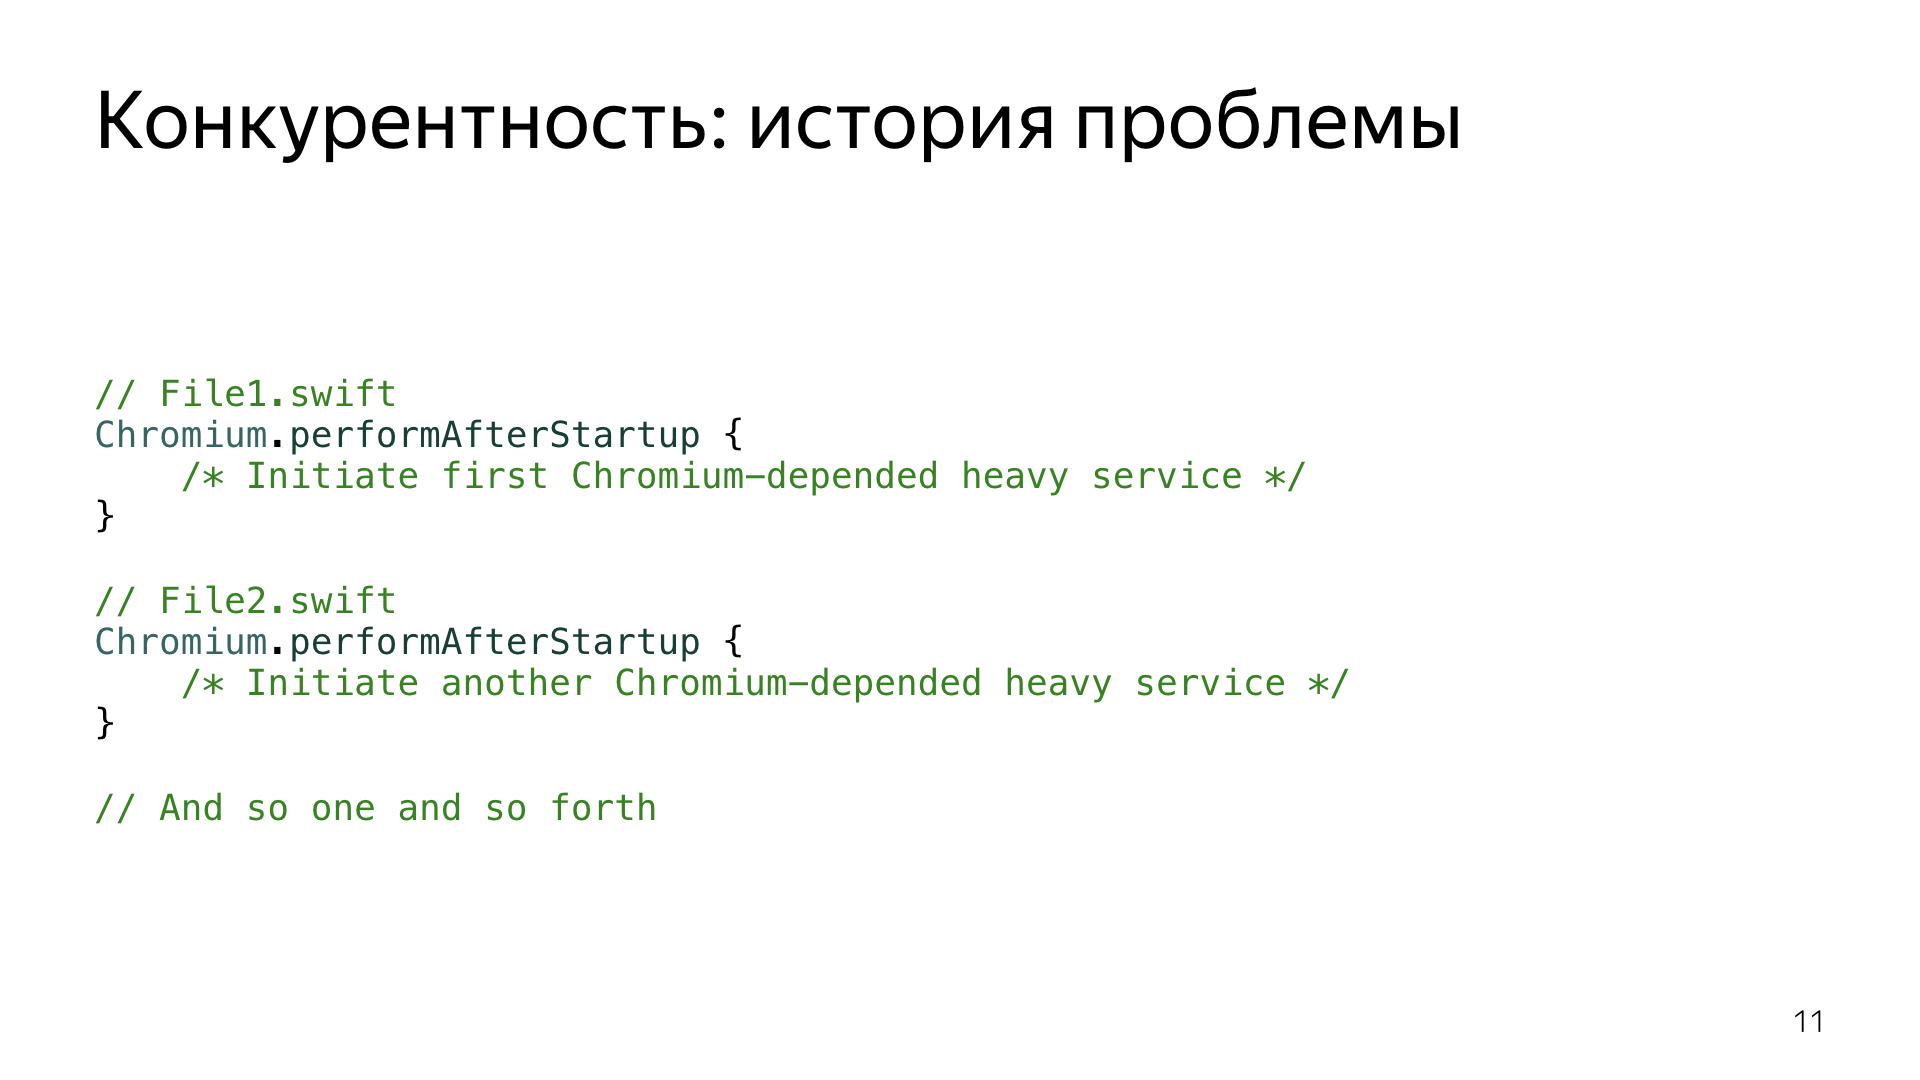
It looked like this. There were two dozen of such conditional services that did something there, sometimes did a lot. While there were one or two of them, this was not a problem, but their number was constantly growing along with the growth of the number of features.

Chromium.performAfterStartup itself did not do anything, it just took all the callbacks that subscribed to it, and wrote it down to the main stream in a large bundle. 20 services in the main thread - alas, I had to do something.
Therefore, we abandoned the simultaneous launch of all services. The first thing we did, some services stopped waiting Chromium, and were postponed to a later date.
Basically, this is all related to statistics and other things that users either do not need or are not necessary right away. Everything that we could postpone, we postponed for a longer period.

We decided that those services that we could not postpone, we will start one at a time - simply allowing the main thread to crank something in between the service launches. Thus, although the users had an interface that lagged, but at the same time, he had the opportunity to interact with it. And he was still a little closer to happiness.
Unfortunately, the happiness was short-lived, because lazy services appeared.

The problem with lazy services is that their launch time is undefined. On the one hand, this is not a problem, but their advantage, because we can use lazy services then we need to postpone its launch as much as possible until the moment when it is really needed. But it happens that lazy services, referring to each other, and touching each other, gather in huge packs, start to run as a crowd, in this place a hot spot is formed, which can move to another place if you accidentally touch this lazy service. , , — , , .
, , . , - , .
, , , . , - . , , .
, , , Promise. , .
.
. , . — . ? , , , , - . , , — , , - — , 7- .
50%, 70% 90%. , .
, , . , .
, .
, . , . , , , , .
, .
Swift , . , Main. , — , , Swift. Swift, .
. , . , : , , pull request, . , . , , , , , . - - , , .
: . , , . , , - . Thank.
- For a long time I was engaged in the development of Yandex Browser. Actually, from the optimization of the start time of this application, my report was born.
The problems we solved in the browser are common to all iOS applications. If you take the phone and run something, then, most likely, you will watch the splash screen for 2-3 seconds. My personal record holder is 7 seconds, I will not call the application, but this is amazing: while you open and look at the beautiful picture, you have already forgotten what you wanted to do with this application.
Our browser could not afford this. The browser has a number of scripts that require the application to respond immediately. The user should be able to quickly, on the fly, open the browser, drive something into the search line, get an answer or read something on the run. Probably, you are also on the run, in subway crossings, reading some articles in fragments, because there is not much time.
')
Naturally, the browser has features that we cannot just get rid of - for the sake of them, users use our product.
In addition, we have competitors. And one of our main competitors, the iOS-built browser Safari, which hangs over us with a hundred-ton weight, occupies the same dominant position as IE had in Windows at one time, if you remember. We also have to compete with it, so we need to constantly reduce the launch time of our browser.
At one time we approached this problem with the naivety peculiar to all developers. In their opinion, to optimize something, the profiler and own experience is enough.
At some point, the manager came up to us and said that the application was dumb, slow, everything was bad. The developers said - ok, let's see, optimize, everything will be fine.
Optimized. The result was an assembly, which the testing itself took and sat down with a stopwatch, because it was necessary to check that we did everything correctly, did not fix it anywhere, and everything starts faster. With a stopwatch, they measured the start time, made sure that it became smaller, everything is fine.
In the future, this approach has evolved. Instead of planting a tester and giving him a stopwatch, we started using video. They shot the video before optimization and after, superimposed on each other, looked frame by frame, where what element of the browser appears, how it reacts, is everything good?
In the future, the manager felt in his video editor. He started shooting five videos before, five videos after, to level the effects associated with randomness. Everyone knows that sometimes the start time depends on the weather on Mars, and nothing can be done about it.
The manager acquired the skills of a video editor, but this did not help us. This approach had a huge amount of problems.
First of all, we remembered optimization only when everything started to slow down. We optimized, and after a while it all degraded. Someone makes other changes, new features appear, and over time, everything again becomes very bad. And we did not have the tools to control it. And if we do not want to lose some effect, we need to exercise continuous monitoring. Unfortunately, the version with the video that we used is laborious enough to use it constantly. He did not suit us.
Therefore, today we will talk about how to build the launch time optimization process correctly, if you really want to get some effect and maintain it for a long time.
First of all, we will talk about metrics - without them, no process is possible at all, especially such as optimization.
We will talk about the fact that from the experience of others managed to adapt for themselves. Let's talk about the project Fake UI - thanks to him we managed to build an interface that literally flies into the face of the user and says: "Work with me faster."
Briefly tell about the elimination of hot spots. This is a topic in which everybody who has been involved in optimization has a little understanding. About the lazy services that brought us a lot of problems, and about the assessment, which we end up with.
Let's start with the metrics. Here is the first and most important thing to go with this report. If you do not have convenient metrics, you can never make a convenient optimization that will be supported. An example from a video. The manager needs to spend a lot of time to remove the metrics from the video, we could not shoot them all the time. As a result, it was done somehow, everything was lost, and most importantly, we could not find in the interval where this or that optimization was lost. Therefore, the more often we remove metrics, the better for us.
Metrics should be removed quickly, often, be simple and understandable. For the browser, we all divided the metrics divided into two large groups - main and auxiliary. The main ones are those that are directly sensed by the user, which influence his or her perception of the browser, and those that it sees. They should be quantitative, it is easy to work with numbers, you can add them, subtract, even subtract square roots, but I personally did not try. And most importantly - they must be objective. As the tester's example with a stopwatch showed, too many stochastic factors lead to the fact that the metric, instead of showing the effect of the improvements being made, begins to show the temperature outside the window.
Core metrics are what we want to improve during the product development process. There are auxiliary metrics. They are very similar to the main ones, except for the fact that they already exist in the developer’s world. These are some things that are not visible to users, but the developer will be told about what is happening in his product, much more than the usual number.
For Yandex.Browser, we selected four metrics. Two of them are auxiliary, there are for the developer, and two main ones.
All these metrics are numbers that show the number, conditionally, of seconds that pass from the moment when the user pokes on the application icon.
The first point we take off is the moment when Main starts. The second, as soon as the RootViewController appeared in the window hierarchy and it has a View. We remove the point at which ViewWillAppear is running.
The third metric is ViewDidAppear. The fourth, most interesting, is that at the end of ViewDidAppear we launch the main stream using the Dispatch Async block. And the moment when it is executed, this is the fourth position, which we called the UI Ready, the most important. We will often continue to use in the future. And we will give the main estimates on it.
Briefly about what each of these numbers mean. Main shows the most understandable thing - this is the moment when we started the application, the whole image is launched into memory, load and initialise occur, all that concerns the dynamically loaded libraries is there. It shows the effect of those libraries that we have loaded into the project.
After that, application: didFinishLaunchingWithOptions is executed, naturally. Some services are configured that will be used in the future, and after that comes the ViewDidAppear moment.
Therefore, the second number of ViewDidAppear shows the effect of the configured, already our own user services.
In turn, ViewDidAppear as the main metric shows the moment when the user finally saw on the screen the interface of the application with which he intends to work.
Finally, UI Ready. At the moment when the interface is shown, it can be blocked by a huge amount of code that still needs to be executed on the main thread. Because of this, the user sees, but can not touch.
The fourth metric of UI Ready, when we plan a block on the main thread, shows when it has finally unloaded, and the user can interact with our application.
The main hypothesis from which we repelled that if we reduce the UI Ready metric, that is, the moment when the user can work with the application, the user will notice, understand that for him it is good, he can enjoy the product more. This means that we will grow product metrics, such as the return percentage. That is, we have to observe a correlation on the graphs: the start time of the UI Ready goes down - the product metrics go up.
To evaluate the effect of optimization, we collect metrics from developers. As soon as the developer does something, we take his assembly, after the pull request has joined the master, we are constantly assembling the assembly from the master and sending it to a special testing stand. This is a regular Mac connected to the network to which the device is connected, we had an iPad Mini based on iOS 8, as the most braking device at that time. An assembly is put on it, and it is launched several hundred times. Each time we get some numbers on all four metrics, collect them, average them and send them to a special stand, where a beautiful graph of how time changes over time is built using these numbers. Later I will show these graphs.
We use these numbers to quickly understand what the changes we are making to the project lead to.
Naturally, we do it for users, and we collect metrics from users too. Those users who allowed sending anonymous statistics, we take these numbers and send them to ourselves. Naturally, the user can not be asked to run our application 200 times, but the number of users basically eliminates the effect of randomness here.
I hope you understand that metrics are important. And when you have such a problem, you will use this advice.
As for the experience that we have taken over from other people, first of all I would like to refer to the report of my colleague Nikolay Likhogrud - “Optimization of launch time of iOS applications”.
It primarily concerns the launch time of system things, such as loading dynamic libraries, as I said at the beginning, the Main metric, image loading. All this is very well described there, and we also used his advice, abandoned the dynamic libraries in the browser, everything is statistically linked.
Naturally, we abandoned Swift when we did all this, we still had iOS 7, for which Swift support strongly influenced the metrics and led to a huge increase in all numbers. We tried to use it, saw growth and abandoned this idea quickly enough.
Surprisingly, the improvement in speed showed just the transfer of resources from raw resources ... Who knows, we can simply put a picture in xcassets that are loaded much faster than raw resources. And for projects with a long history, when some things just don’t get touched by the fact that nobody needs it, it may be relevant if you still have raw resources in the project, I recommend to transfer them to xcassets, and you will get it out of the blue performance gain.
Unfortunately, we have libraries that negatively affect the start time. Apparently, due to the fact that multiple loads are performed there and a similar thing. First of all, we encountered this when using the Facebook SDK, for which we used lazy loading and late binding, in which we do not interact with this library directly, but use Dial D and other such things.
I will not have such a hardcore, like my colleagues. There will be many beautiful pictures.
The first problem in the browser is the kernel issue. Many people know or guess that the browser is based on the Chromium core, there is the code from our guys, it is fumbled between our desktop browser, mobile browser, and provides a lot of functionality, without which the browser would not be very useful.
The problem with the iOS version is that the kernel for iOS is a monolith. This is a large amount of code that loads simultaneously, works for a while, and only when it finally loads can we provide the user with some kind of functionality.
It was impossible to put up with it. The user seems to have seen the interface, but the kernel did not boot, the interface is locked, he can do nothing.
We decided to do something about it.
The first idea we had was - what if it was cut out? If the core slows down, let's just throw it out and there will be no problems, everything will be fine.
We did not even try. It is clear that when the kernel gives you a huge amount of reusable functionality, then throwing it out would be writing it from scratch, but using your own resources. To go for it is pointless, throwing out code that works to write another one that will work worse.
We went the other way. If there is a kernel-dependent UI that can't do anything without it, why not give the user a different UI? Small, which may not be able to do everything, but can work fine without a kernel, and which will allow the user to execute some set of scenarios characteristic of the mode when we need to quickly open the application and quickly do something in it.
Naturally, it will be interactive, it will be possible to write in it, and it should switch transparently to a large UI as soon as the kernel is loaded.
Deviantart link
How did we do it with an example of such a component as Omnibox?
Everyone knows or guesses that the browser consists of a WebView and a text field for entering a request. Naturally, it is not. The field for entering a query is called Omnibox. The kernel gave a lot of things, such as sadgets, beautiful URL formatting, there was also work with the progress bar, and without it all Omnibox was a little functional. But we really wanted us to give the user the opportunity to take and enter something before the start.
We took a large Omnibox and divided it into two. The old Omnibox model remained exactly the same, it also worked with the kernel. Nearby, we put a new model, which was completely cut off from it, worked with some cached data, we merged them into one large composite that routed calls depending on whether the kernel was loaded or not.
While the kernel is not loaded, our calls went to the cached Omnibox and the answers came from there. As soon as the kernel was loading, we switched.
To prevent the user from feeling that something broke, when he unloaded the browser, then launched it again and saw an empty Omnibox, and just that it was full, we made a small cache. The large Omnibox, which depends on the kernel, wrote to this cache, and the cached Omnibox, as soon as it was up, read from this cache and gave the user the state with which it remained.
And to support seamless switching, we made a small component that, at the moment when the kernel finally starts, actually synchronizes the Omnibox caching state with the normal one. And for the user, everything looks as if he just launched a browser, started doing something in it and the browser just works. He does not even notice the moment of switching.
At the same time, the interface started much faster. As I said before, before the start of the kernel, we just did UserInteractionEnabled = null, and no, dear user, you will not do anything. Now we resolved UserInteraction, and saw that the problems remained.
Unfortunately, in addition to the kernel, we had our own services, written by us. Some of them also depended on the kernel and were very fond of subscribing to a callback, which signaled that the kernel was finally running.
At that moment, when the kernel was loaded, all these services happily ran to initialize, and clogged the main thread, as a result, the interface is there, it would be possible to interact with it, but the main thread is clogged, no message passes into it.
It looked like this. There were two dozen of such conditional services that did something there, sometimes did a lot. While there were one or two of them, this was not a problem, but their number was constantly growing along with the growth of the number of features.
Chromium.performAfterStartup itself did not do anything, it just took all the callbacks that subscribed to it, and wrote it down to the main stream in a large bundle. 20 services in the main thread - alas, I had to do something.
Therefore, we abandoned the simultaneous launch of all services. The first thing we did, some services stopped waiting Chromium, and were postponed to a later date.
Basically, this is all related to statistics and other things that users either do not need or are not necessary right away. Everything that we could postpone, we postponed for a longer period.
We decided that those services that we could not postpone, we will start one at a time - simply allowing the main thread to crank something in between the service launches. Thus, although the users had an interface that lagged, but at the same time, he had the opportunity to interact with it. And he was still a little closer to happiness.
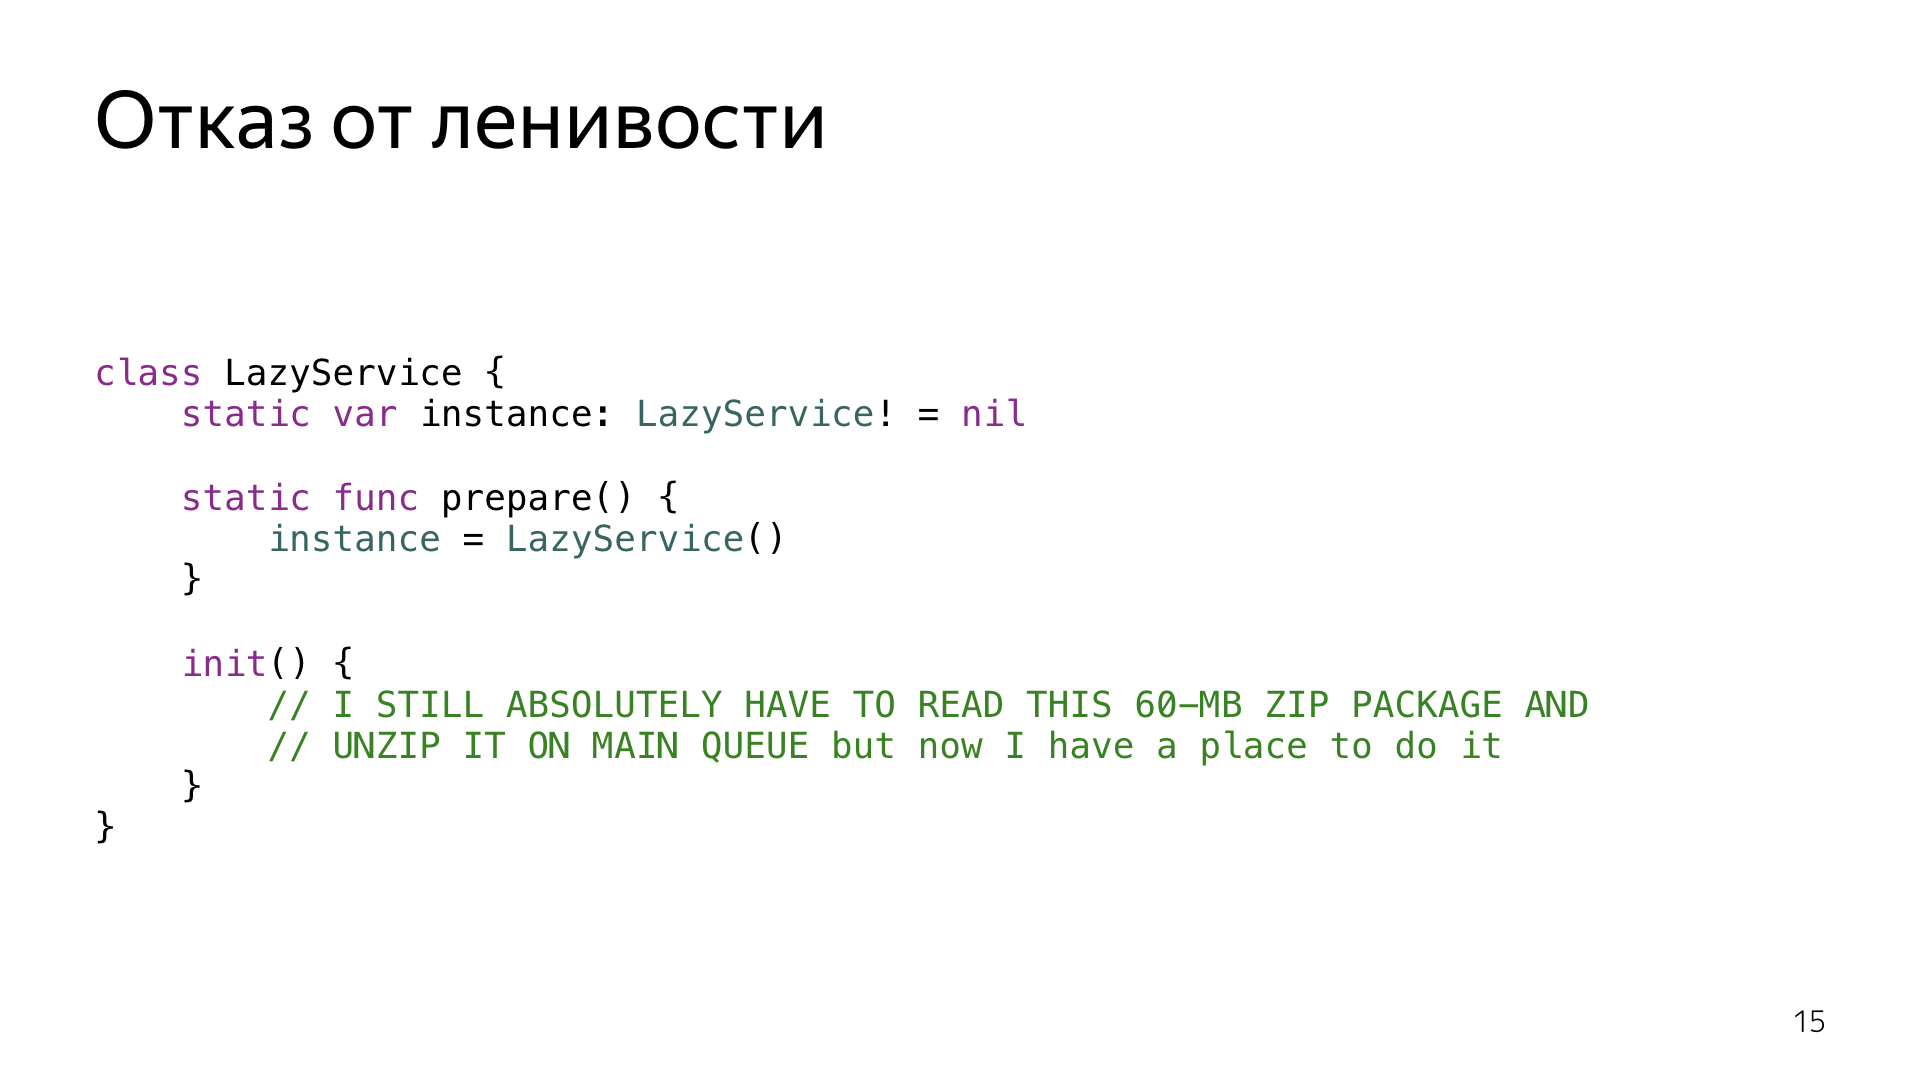
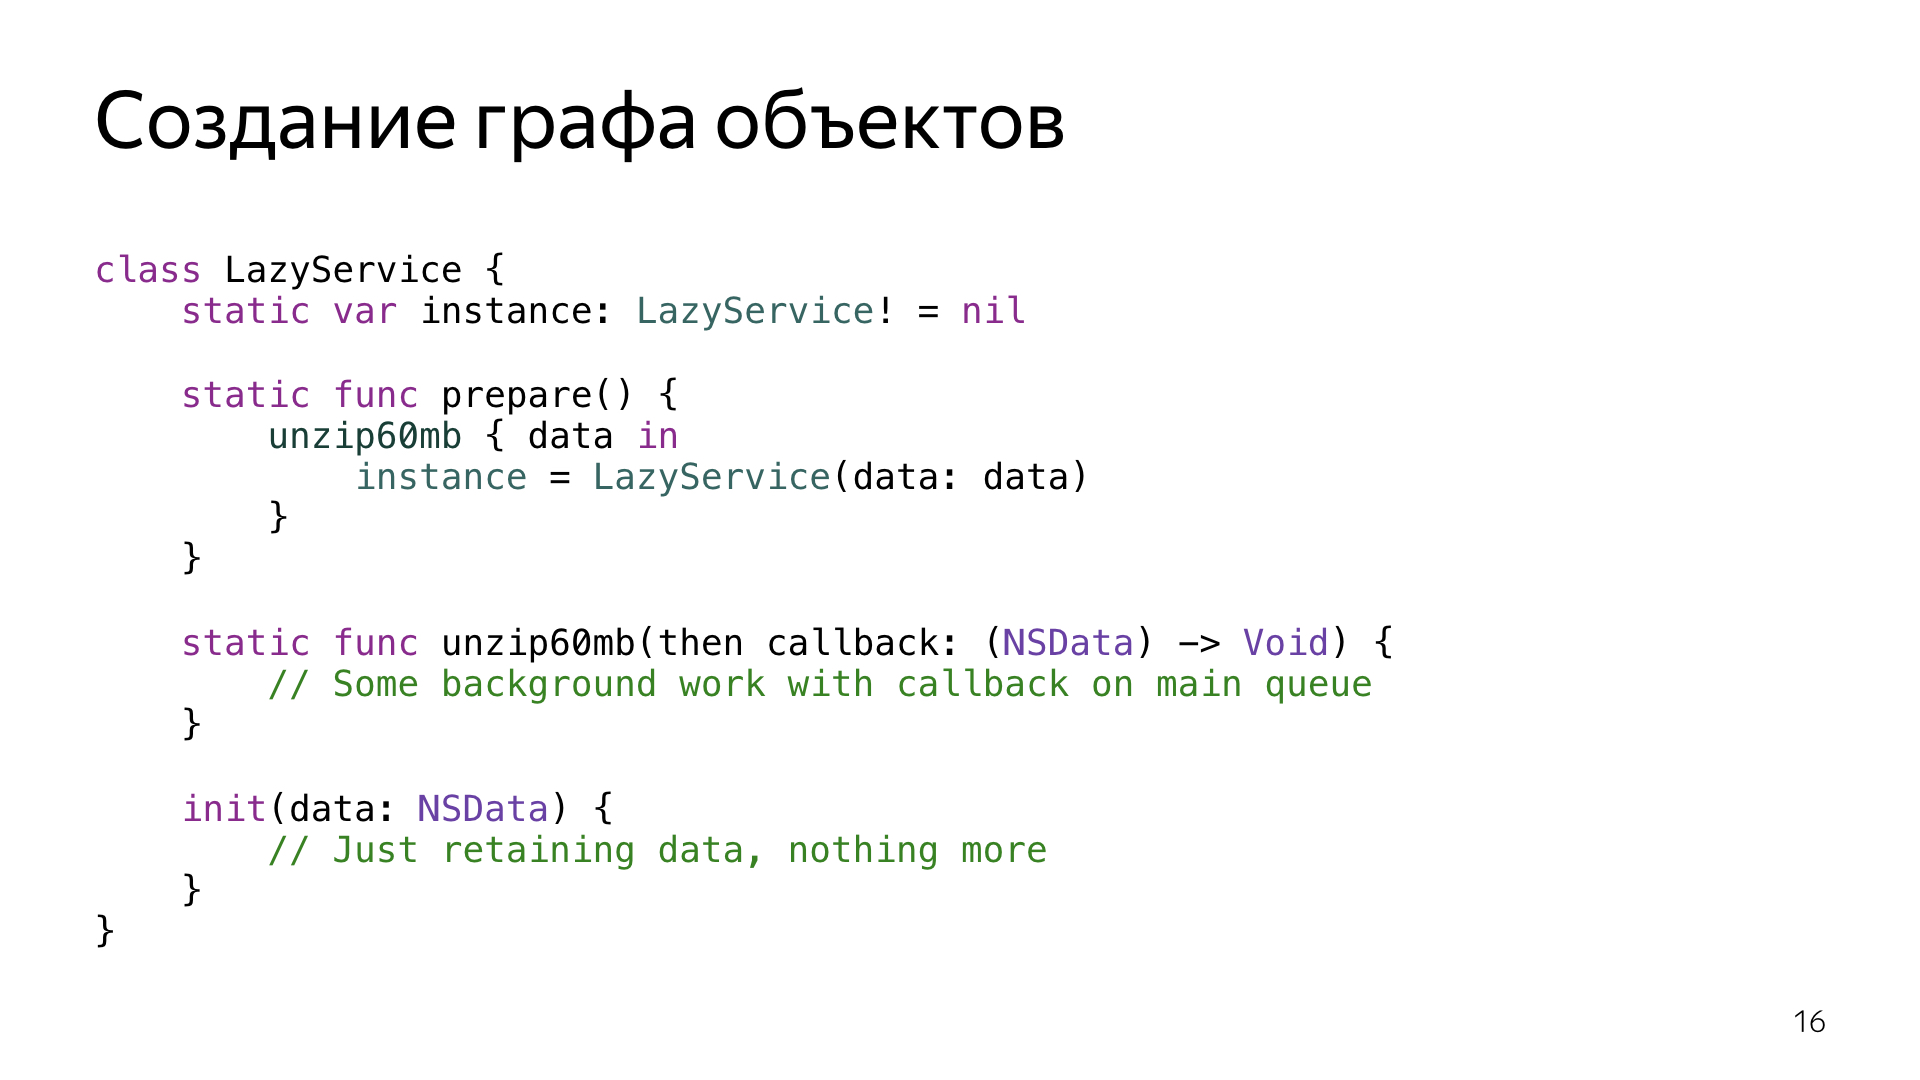
Unfortunately, the happiness was short-lived, because lazy services appeared.
The problem with lazy services is that their launch time is undefined. On the one hand, this is not a problem, but their advantage, because we can use lazy services then we need to postpone its launch as much as possible until the moment when it is really needed. But it happens that lazy services, referring to each other, and touching each other, gather in huge packs, start to run as a crowd, in this place a hot spot is formed, which can move to another place if you accidentally touch this lazy service. , , — , , .
, , . , - , .
, , , . , - . , , .
, , , Promise. , .
.
. , . — . ? , , , , - . , , — , , - — , 7- .
50%, 70% 90%. , .
, , . , .
, .
, . , . , , , , .
, .
Swift , . , Main. , — , , Swift. Swift, .
. , . , : , , pull request, . , . , , , , , . - - , , .
: . , , . , , - . Thank.
Source: https://habr.com/ru/post/349874/
All Articles