Case "Monitoring of the business loan portfolio of the bank with the help of three-dimensional visualization"
Introduction
In this article, I will share with you our experience in solving an interesting analytical problem using non-standard visual tools. The article will be of interest to people involved in data analysis, as well as bank managers who specialize in monitoring and analyzing the loan portfolio of a bank.
The application, about which, in fact, I will write below, is based on the platform iDVP (Interactive Data Visualization Platform).
')
So, let's begin!
The task that we solved and which I am going to describe in this article was formulated as follows:
The bank provides loans to large legal entities - borrowers. The number of large borrowers at one point in time does not exceed 1,000. The bank’s management needs a handy tool with which it would be possible to see (monitor) a complete picture of the bank’s loan portfolio. At the same time, it should be possible to move from a look at the loan portfolio as a whole to detailed information on each of the borrowers.
In what conditions is the leader and what he needs?
- The management wants to spend a minimum of effort on working with the application, on the interpretation of visual information, on data analysis.
- The management wants to see the state of the loan portfolio immediately, simply by opening the application, without making a single mouse click.
- Information should be presented "as much as possible" - on one screen, without the need for scrolling. Already on the first screen, the user must see which borrowers are “problematic”, how “problematic” and what their share in the portfolio is in terms of quantity and value.
- Filtering and grouping tools should be easy and intuitive.
- The application screens should be “beautiful”, so that the management with the help of it could “effectively” present their reports to the founders and shareholders.
Bank analysts, as well as vendors of BI-tools, are trying to create solutions that would meet all the specified requirements, but not all requirements can be fully implemented, and as a result, the created software solutions do not always like the management. We decided to go our own way and design a solution that would satisfy all the requirements with the highest possible quality.
I already told you about our approach to data analysis tasks in the previous article; if you want, you can read it .
The main points of this article
These principles, in our opinion, should take an equal position in the formation of requirements for a solution, along with functional requirements.
It was in accordance with the listed theses of the previous article that we started to create our solution.
Let me remind you our application design steps:
The following description is structured according to these steps.
- When examining the customer, we always try to identify the pain (problem) of the customer, which can be solved with the help of data analysis. And we create an application that solves this problem completely.
- For data analysis, we use not “ordinary” BI reports, but three-dimensional applications. In these applications, the visualization of analytical information is performed in the form of 3D objects, combined into thematic interactive scenes (screen forms), interconnected by logical transitions.
- The solutions we create have three principles in their foundation:
- A visual representation of the picture of the customer's business. Already at the first acquaintance with the application, on the first screen, the user should see all parts of his business that interest him.
- Disclosure of the causes of the problem. After selecting a problem point, the user should be able to use the drill down function, which allows them to fall deeper into the problem area, and see the causes of the problems on the following screen forms.
- Technical aesthetics. The application should have a wow effect, i.e. should be attractive, intuitive and convenient.
These principles, in our opinion, should take an equal position in the formation of requirements for a solution, along with functional requirements.
It was in accordance with the listed theses of the previous article that we started to create our solution.
Let me remind you our application design steps:
- Setting the task and getting started;
- Inspection of the customer and work with open sources;
- Analysis, formation of requirements and documentation;
- Formation of the final document "Description of the application."
The following description is structured according to these steps.
Task setting and start of work
Within this stage, together with bank specialists, we determined that the main “pain” of the customer is to track the state of the loan portfolio, while it should be possible to drill down to a specific borrower.
Naturally, the application must meet all the specific requirements of the bank management listed above.
Customer survey and work with open sources
During the survey, the following picture of this line of business was obtained.
The main income of most banks is to provide loans to companies and individuals.
Some banks specialize in lending to the public, others in lending to legal entities.
In this bank, the task of monitoring loans issued to large borrower companies was particularly acute. Borrowing companies are related to various industries, therefore a portfolio analysis is required, both by company and by industry.
The bank for each borrower compiled and constantly updated its profile, which contains information about the reliability of the borrower, about its financial performance.
Bank analysts also collect information about the cash flow of the borrower and other indicators, build a cash flow model. Information is collected from several bank information systems.
Based on the analysis of the information collected, problems are identified in the borrower and the borrower is assigned to one of the 5 problem areas used in the bank to group borrowers:
- Green zone - this zone includes the borrower, who has not identified any problems that may affect the return of the loan;
- Yellow zone - the borrower has some problems;
- Red zone - the borrower has identified significant problems;
- The black zone - the borrower with a probability close to 100 percent, does not pay the loan;
- White zone - the problem of the borrower has not yet been calculated.
Depending on the problem of the borrower, the bank is obliged to place on special accounts reserves for possible losses, the amount of which depends on the loan amount and the reliability of the borrower. In this regard, it is necessary to control the size of these reserves and not allow them to grow, because the reserve is “dead” money for the bank, which it cannot use.
Also, bank analysts perform analysis of the borrower's overdue debts (NPL - Non-performing loans). According to the results of the analysis, the borrower is assigned to one of the 4 NPL zones:
- Green zone - loan payments by the borrower are not overdue or overdue for up to 4 days;
- Yellow zone - delay is from 5 to 29 days;
- Red zone - from 30 to 89 days;
- Black zone - from 90 days and above.
As a result of consideration of all indicators of the borrower, the bank calculates its total rating, which shows how reliable the borrower is.
For each loan, the timeliness of payments and the fulfillment of other conditions of the loan agreement are monitored.
In the event of a delay in the next payment, the bank finds out the reasons for the delay and takes action against the borrowing company. These could be fines or tightening the terms of the loan agreement.
The loan agreements also indicate “covenants” - these are special terms of the agreement that prohibit the borrowing company from taking actions that adversely affect the borrower's ability to repay the loan. Examples of covenants are: the obligation of the borrower to provide financial statements to a bank, closing accounts with other banks, prohibiting loans from other banks, providing collateral for a loan.
Analysis, formation of requirements and documentation
The main functions of the application, providing monitoring of this subject area, were: control of the volume of loans, the reliability or problem of borrowers, as well as other indicators.
The more “bad” loans in monetary terms the bank has, the worse the quality of the loan portfolio. Therefore, the bank’s management must immediately see “bad” loans and “bad” borrowers, be able to see the detailed situation of the problem borrower and decide on further actions in relation to it.
We decided that the work of the user manager with the application should ultimately be similar to the game “find the problem borrower and find out what his problem is”.
Also, to make the application convenient for the bank management, we decided to make not only the desktop version for Windows, but also for Mac OS, iOS and Android. Moreover, the platform on which we develop these applications allows us to do this, as they say, “one-touch”.
According to the results of the analysis, the following indicators were identified that need to be monitored for each borrower:
- Debt
- Problem zone
- NPL zone
- Reserve amount
- Borrower rating
The application should allow the user to:
- See all borrowers on one screen; it should be remembered that at the same time the bank serves up to 1,000 large borrowers;
- Filter borrowers by debt;
- Filter borrowers by problem areas;
- Filter borrowers by NPL;
- Filter borrowers by bank branches that issued loans to them;
- Filter borrowers by industry;
- Filter borrowers by problems identified by them.
Try to imagine a report (or several reports) that will meet these requirements, as well as the requirements specified at the very beginning of the article. Submitted? And now I invite you to familiarize yourself with our decision.
As I said above, the convenience and beauty of the application we have a very great importance. Therefore, not only analysts are involved in the work on the application screens, but also 3D designers and usabilityists.
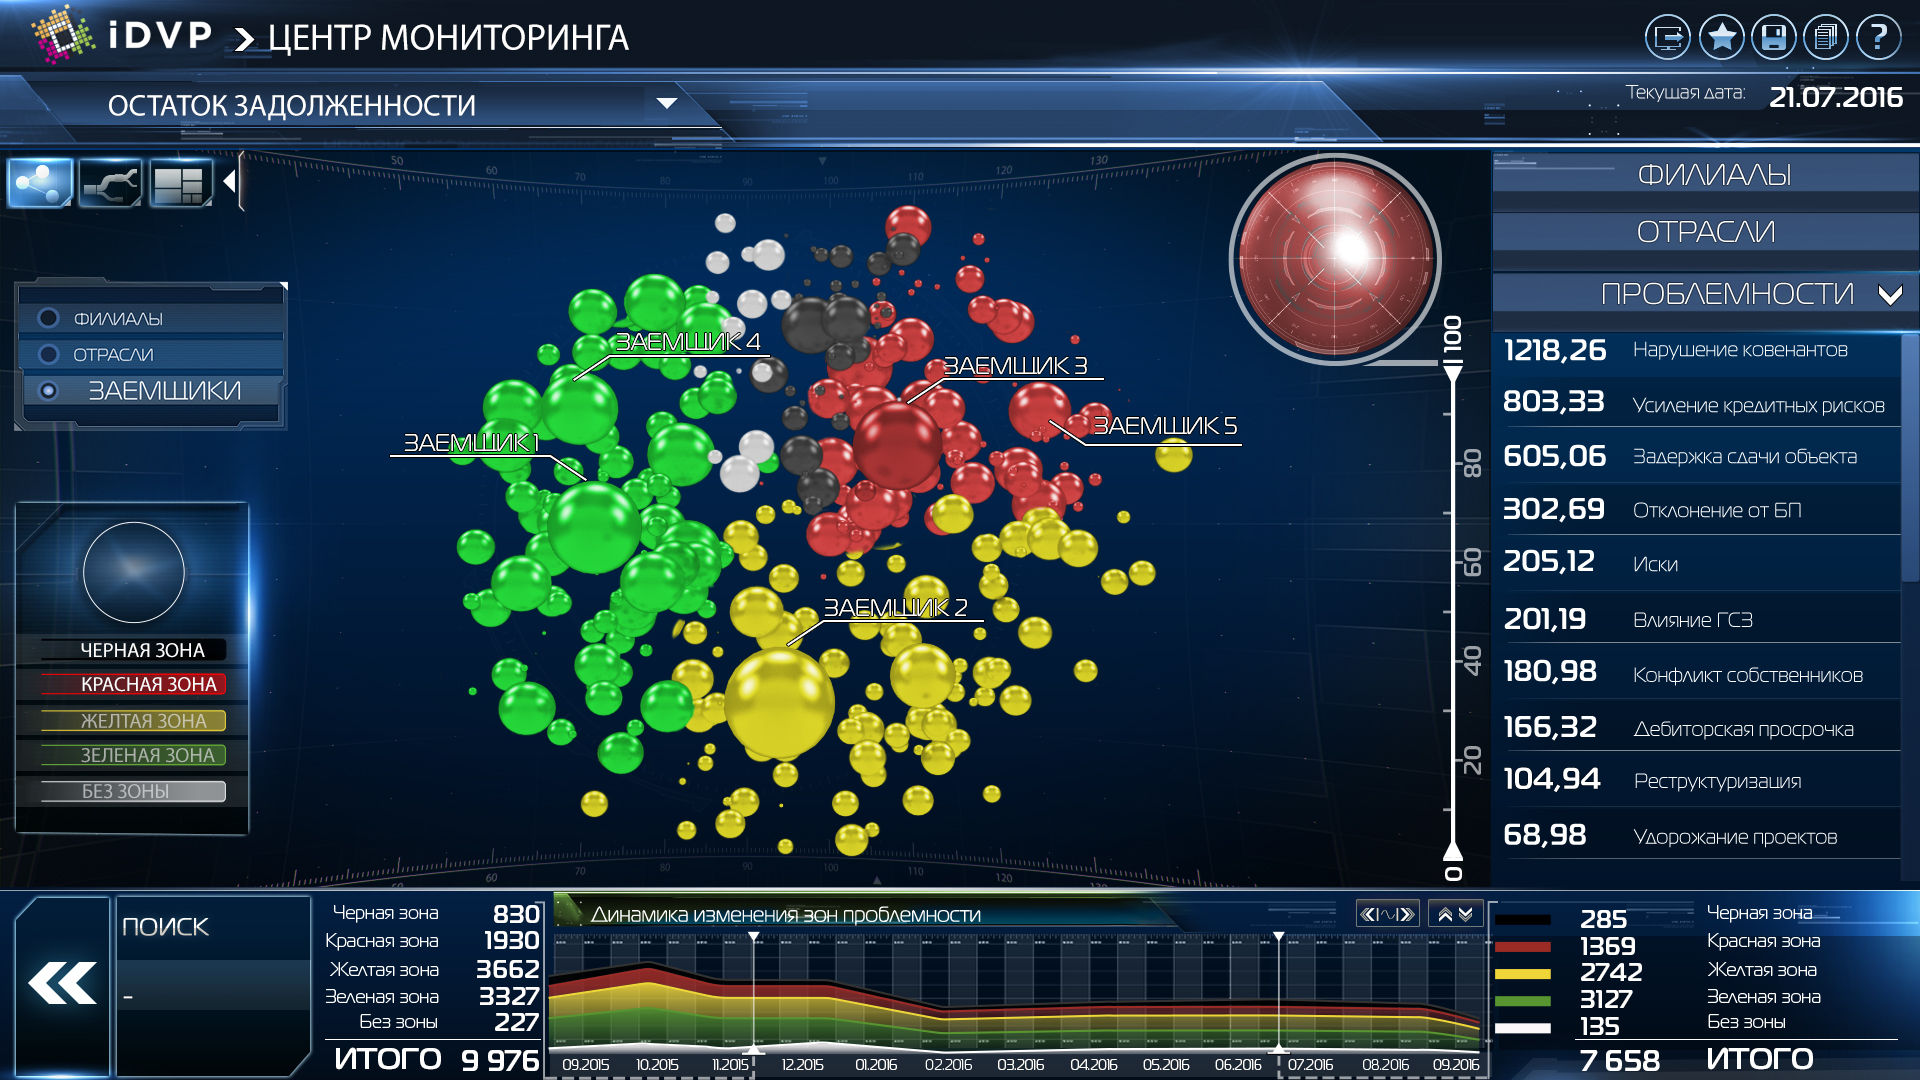
As a result, we have such an iDVP application main screen. Banks. Credit processes (see figure below).
At first glance, the screen seems rather saturated, but at the same time all the information is distributed into zones, which facilitates perception. What zones turned out in the end?
Central zone
In this area in the form of multi-colored planets (balls) are the borrowers of the bank. The size of the planet corresponds to the amount of debt on a loan from a given borrower. The color of the planet corresponds to the problem area of the borrower. At the same time, borrowers of the same color are grouped together so that you can visually assess their share (quantitatively and by amount of debt) in the loan portfolio. Thus, we solved the task “to see all borrowers on one screen”.
In the same zone there is a filter by the size of the planets (pay attention to the scale and the circle located to the right of the planets). Using this filter, you can specify the minimum and maximum debt for the displayed borrowers. You can leave on the screen only large borrowers, for example. The task of “filtering borrowers by volume of debt” has been solved.
When you click on any planet, you go to the screen “Borrower's card” (see the picture below), it provides detailed information on the indicators characterizing this borrower and his credit.
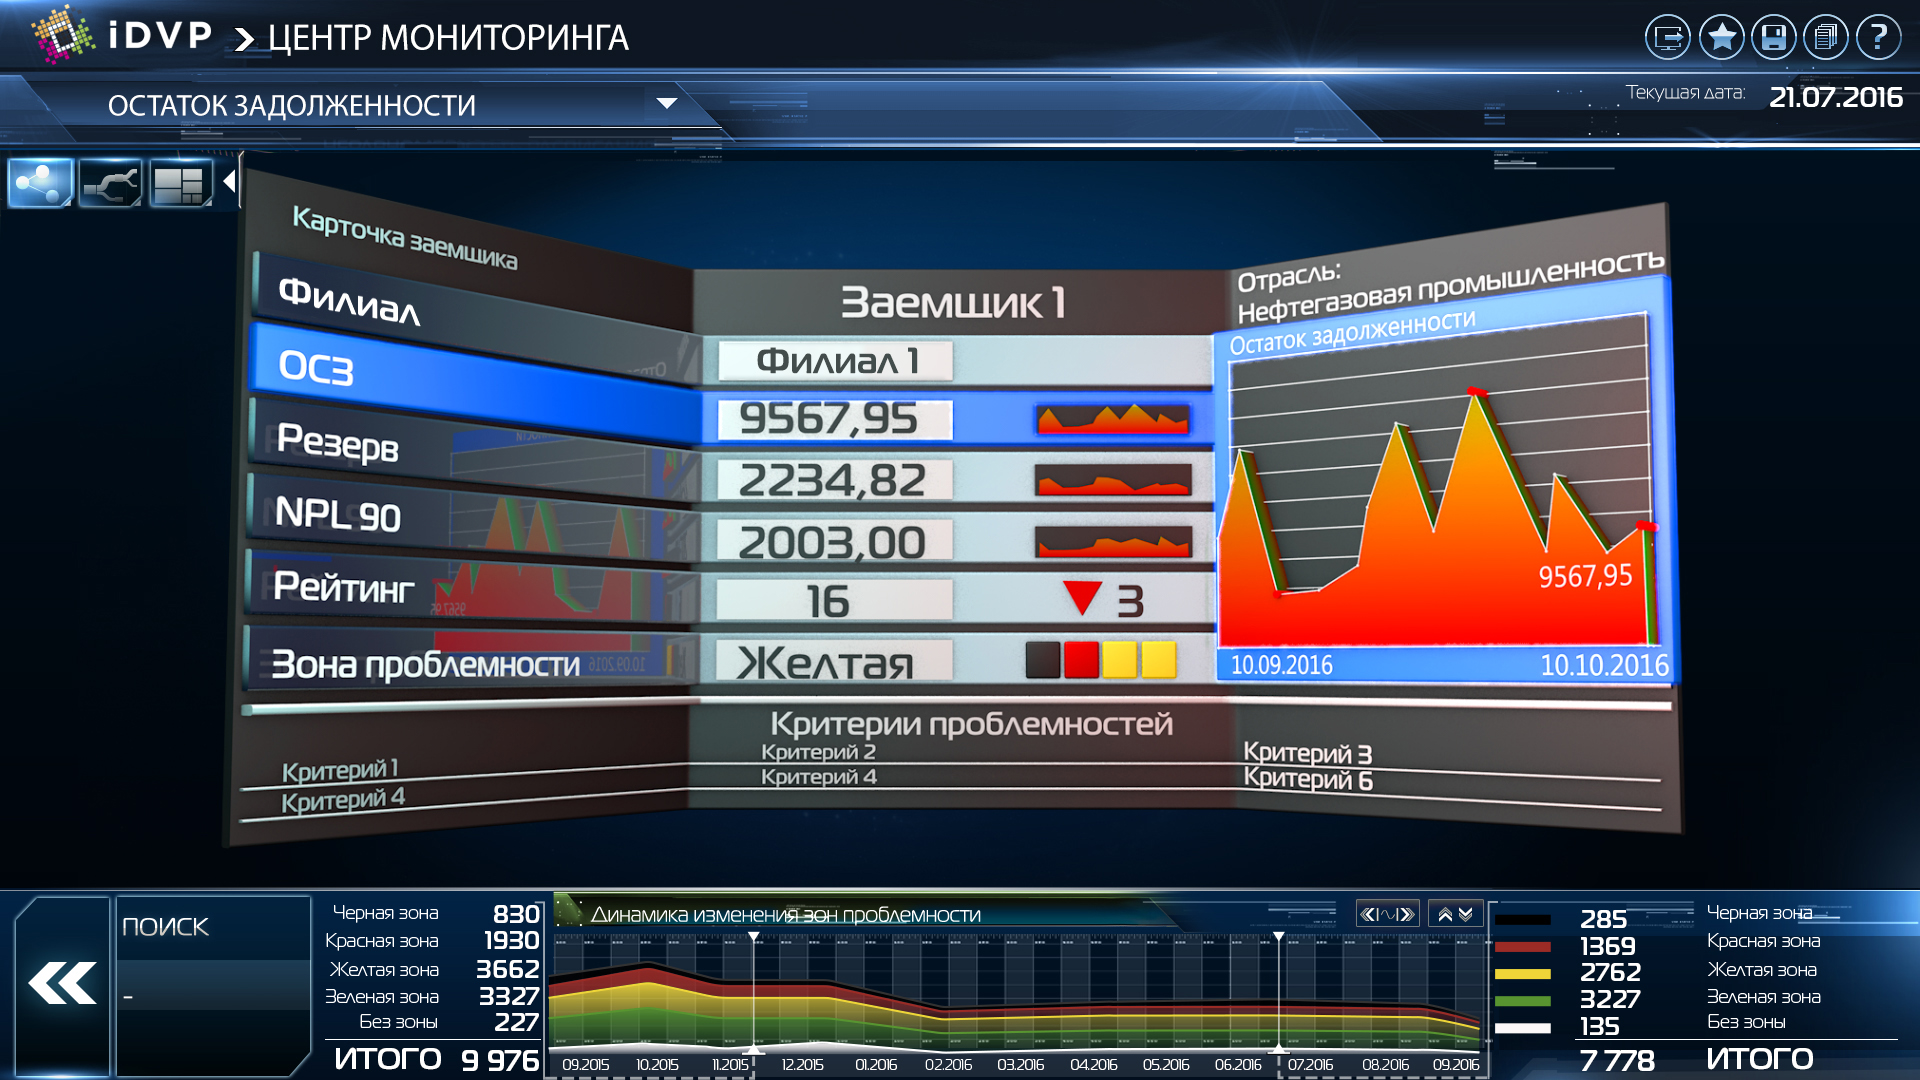
The task “the transition from the overall picture of the loan portfolio to a specific borrower" for the analysis of the situation should be made with a minimum number of clicks "is solved.
In the initial state of the screen of a small planet, it is not always convenient to click - it is just hard to get into them with a mouse or, in the case of touch interfaces, with a finger. To compensate for this difficulty, in the central zone there is an opportunity to zoom in and zoom out (and zoom out) any part of the planetary system. This is done either using the mouse wheel, or, if a touch-screen is used, using the “pinch” action.
Left filter zone
This zone contains a filter for the color zones of the problem of borrowers. You can click / click the necessary / unnecessary problem areas. As a result, only the borrower planets of the colors needed by the user will remain in the central zone. The task “filter borrowers by problem zones”, “filter borrowers by NPL zones” has been solved. An attentive reader will certainly ask how we filter borrowers by NPL zones with this tool, because it filters only problem areas. Everything is simple: in the upper left part of the screen there is the text “REDUCTION BALANCE” - this is, in fact, a drop-down list of the choice of display modes for borrowers. The following modes are available for selection:
- DEBT REDUCTION - in this mode, the size of the planets is determined by the size of the debt, and the color of the planets - the problem area;
- VOLUME NPL - in this mode, the size of the planets is determined by the size of overdue debts, and the color of the planets is determined by the NPL zone;
- RESERVE - in this mode, the size of the planets is determined by the size of the reserve, and the color of the planets is determined by the problematic zone;
- RATING - in this mode, the size of the planets is determined by the rating value, and the color of the planets is determined by the problematic zone.
Here in the “Volume NPL” mode, the filter is on the left and becomes a filter by color zones NPL.
Filter Zone on the right
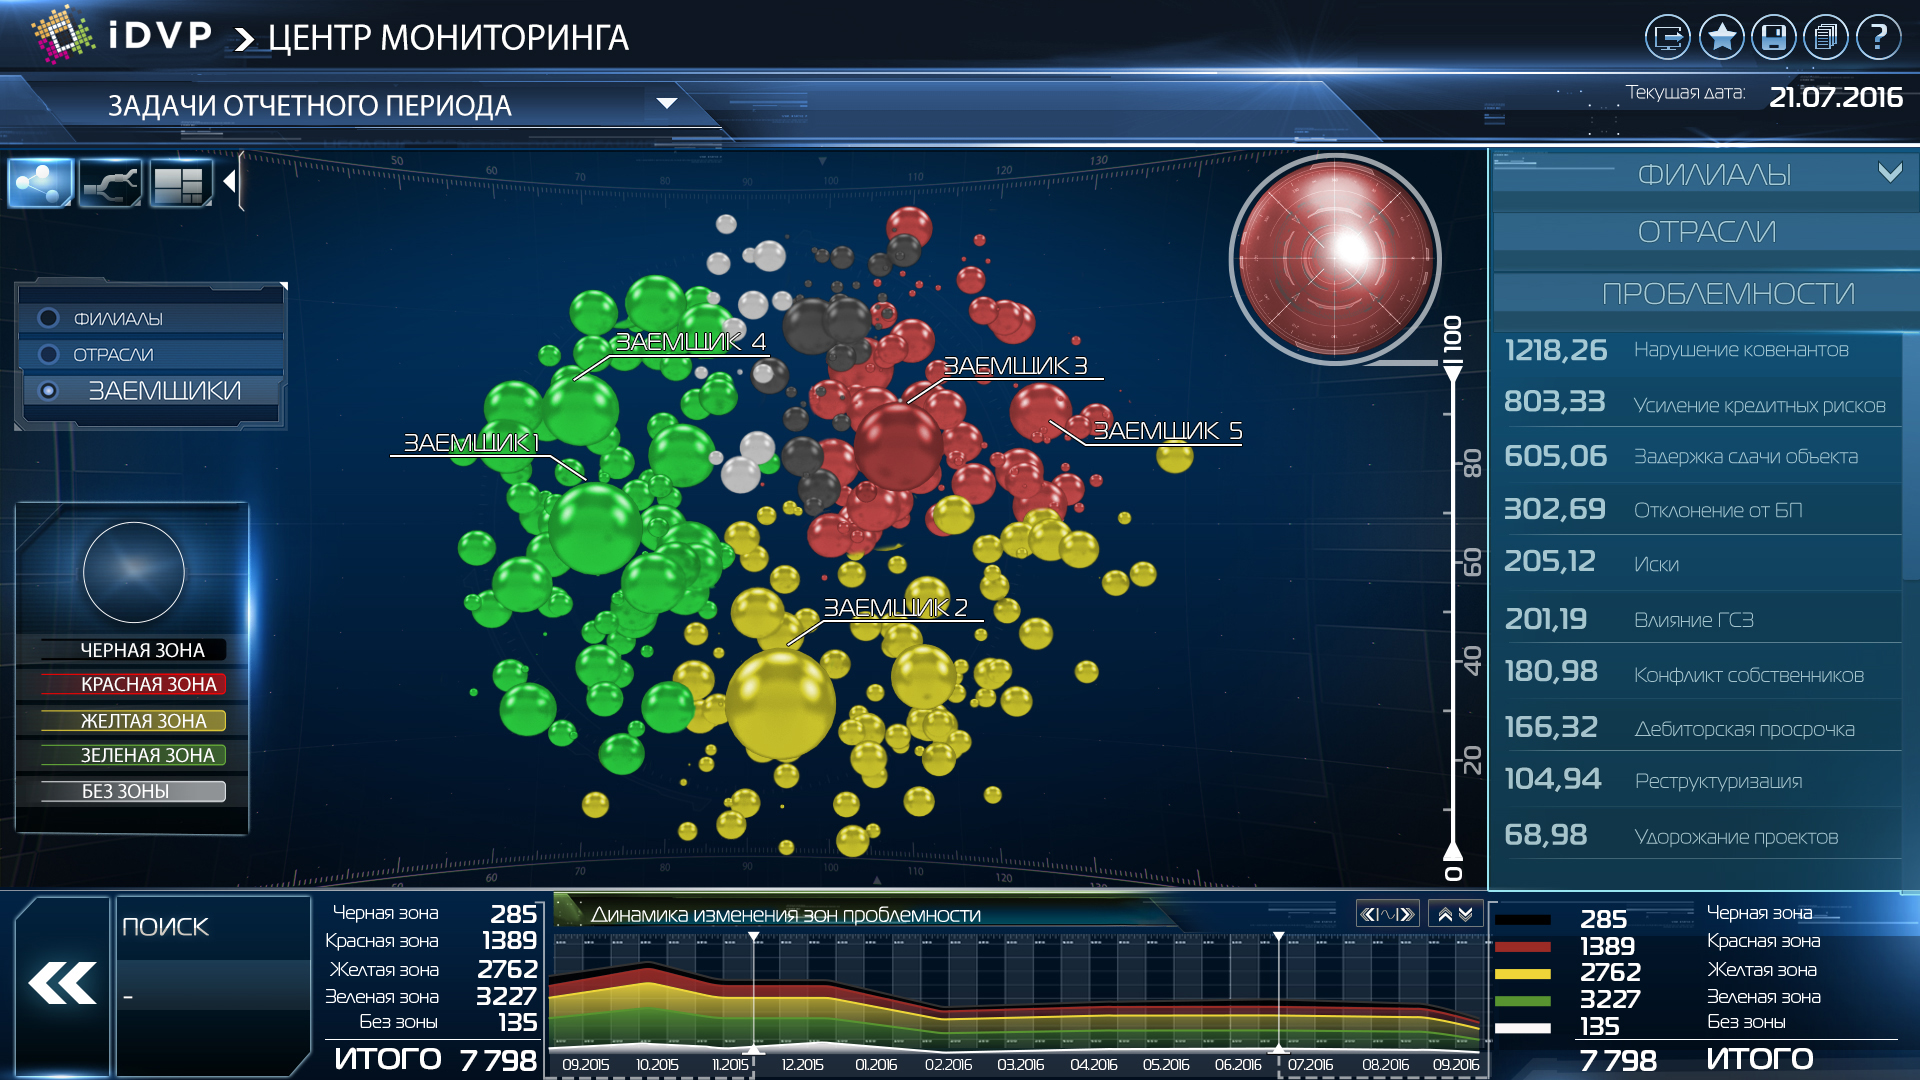
This zone contains the filter element "accordion", which contains three filters:
- Central Bank + TB (central office + territorial banks) - with the help of this filter, you can leave on the screen only borrowers whose loans were issued by the central office (head office of the bank) or territorial banks (branches).
- BRANCH - allows you to filter borrowers of certain industries.
- PROBLEMS - this filter allows you to leave on the screen only those borrowers whose problems have been identified by bank analysts.
The peculiarity of the “accordion” element is that only one filter is deployed at a time (the “PROBLEM” filter is deployed in the sketch). The remaining filters are in a collapsed state.
The task “to filter borrowers by bank branches, by industry, by problems” has been solved.
Lower graphics area

In this zone there is a graph in which the change in the ratio of problematic zones or NPL zones in time is displayed. To do this, use the graph type "line graph with accumulation." Graphic colors correspond to problematic zones or NPL zones.
The user has the ability to set the slider to any date on the chart, and in the central zone only those borrowers that were at the bank at that time will be displayed. The sizes of the planets and their colors will correspond to the amount of debt and the problem area that each borrower had on the selected date.
Below I attach the rest of the application screens: sketches and titles. And you will have the opportunity to study and analyze them yourself. If you have questions about the content - ask them in the comments, be sure to answer.
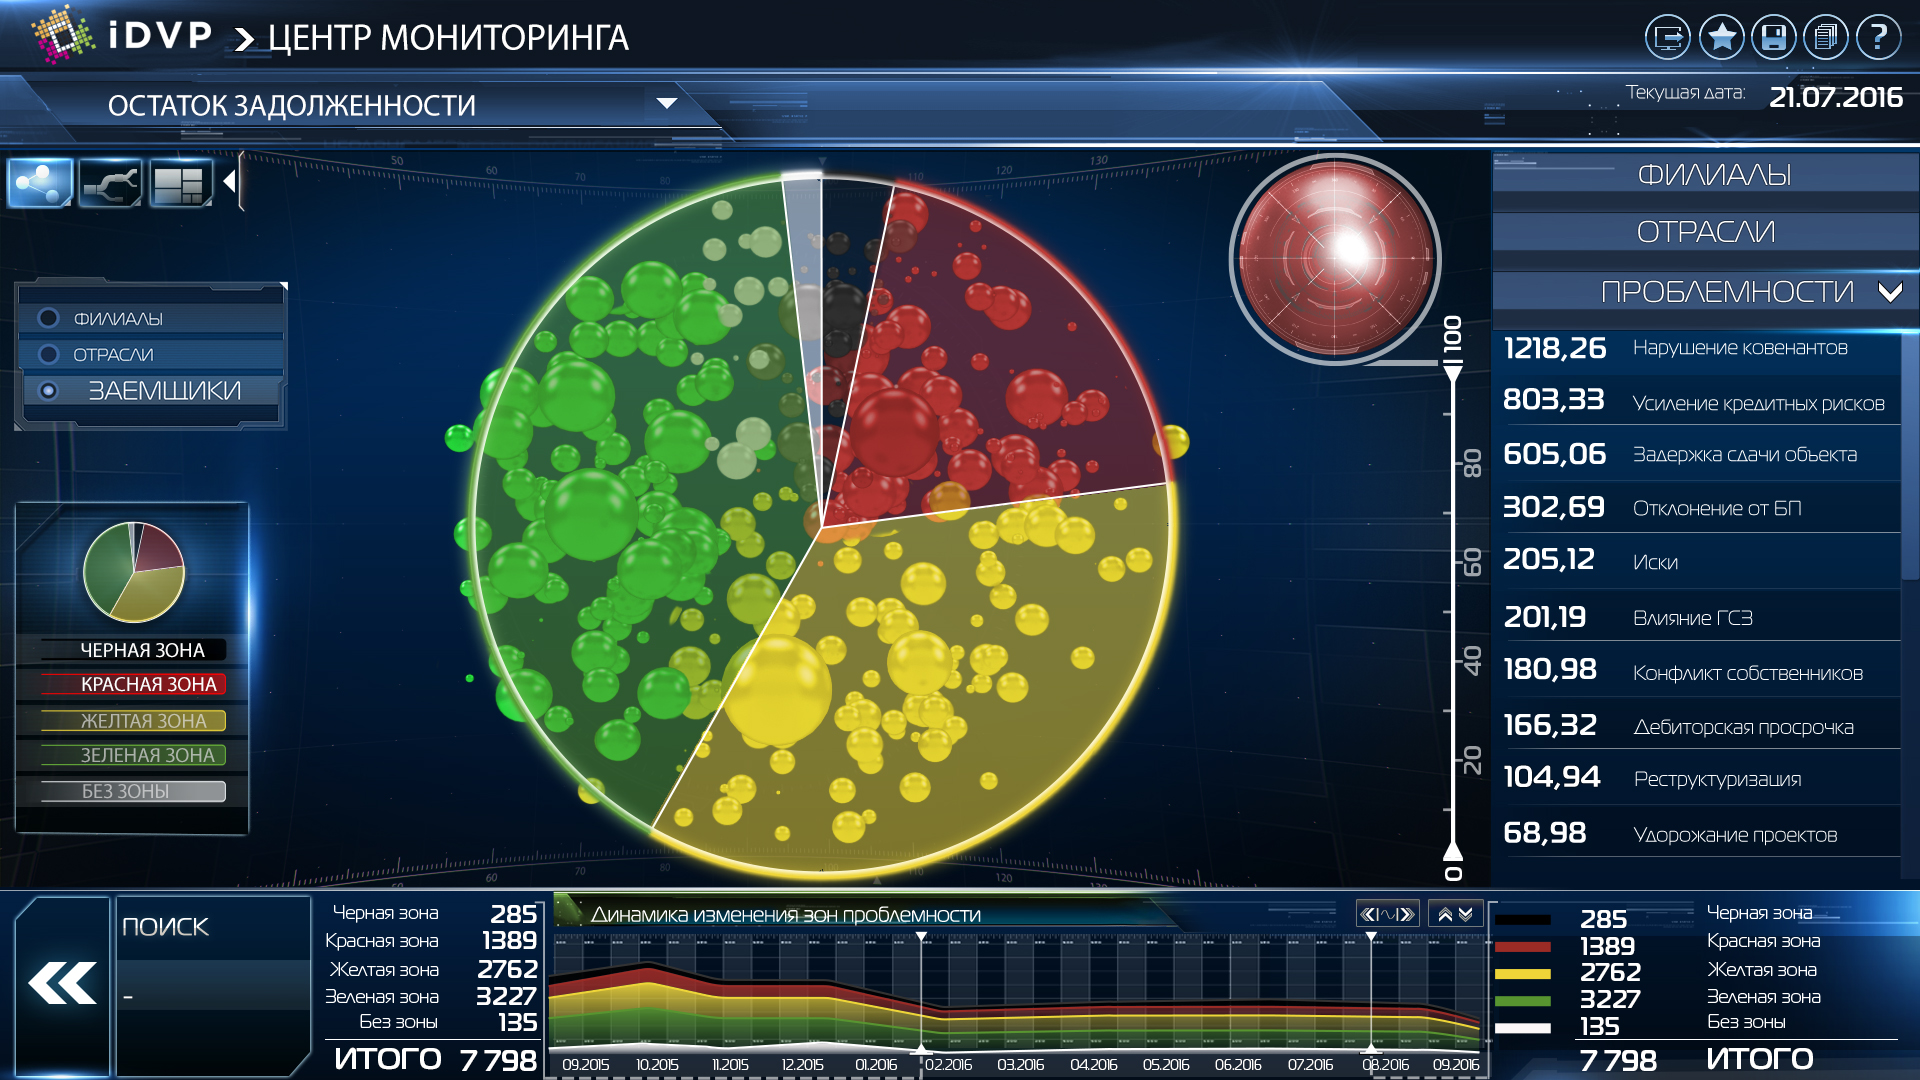
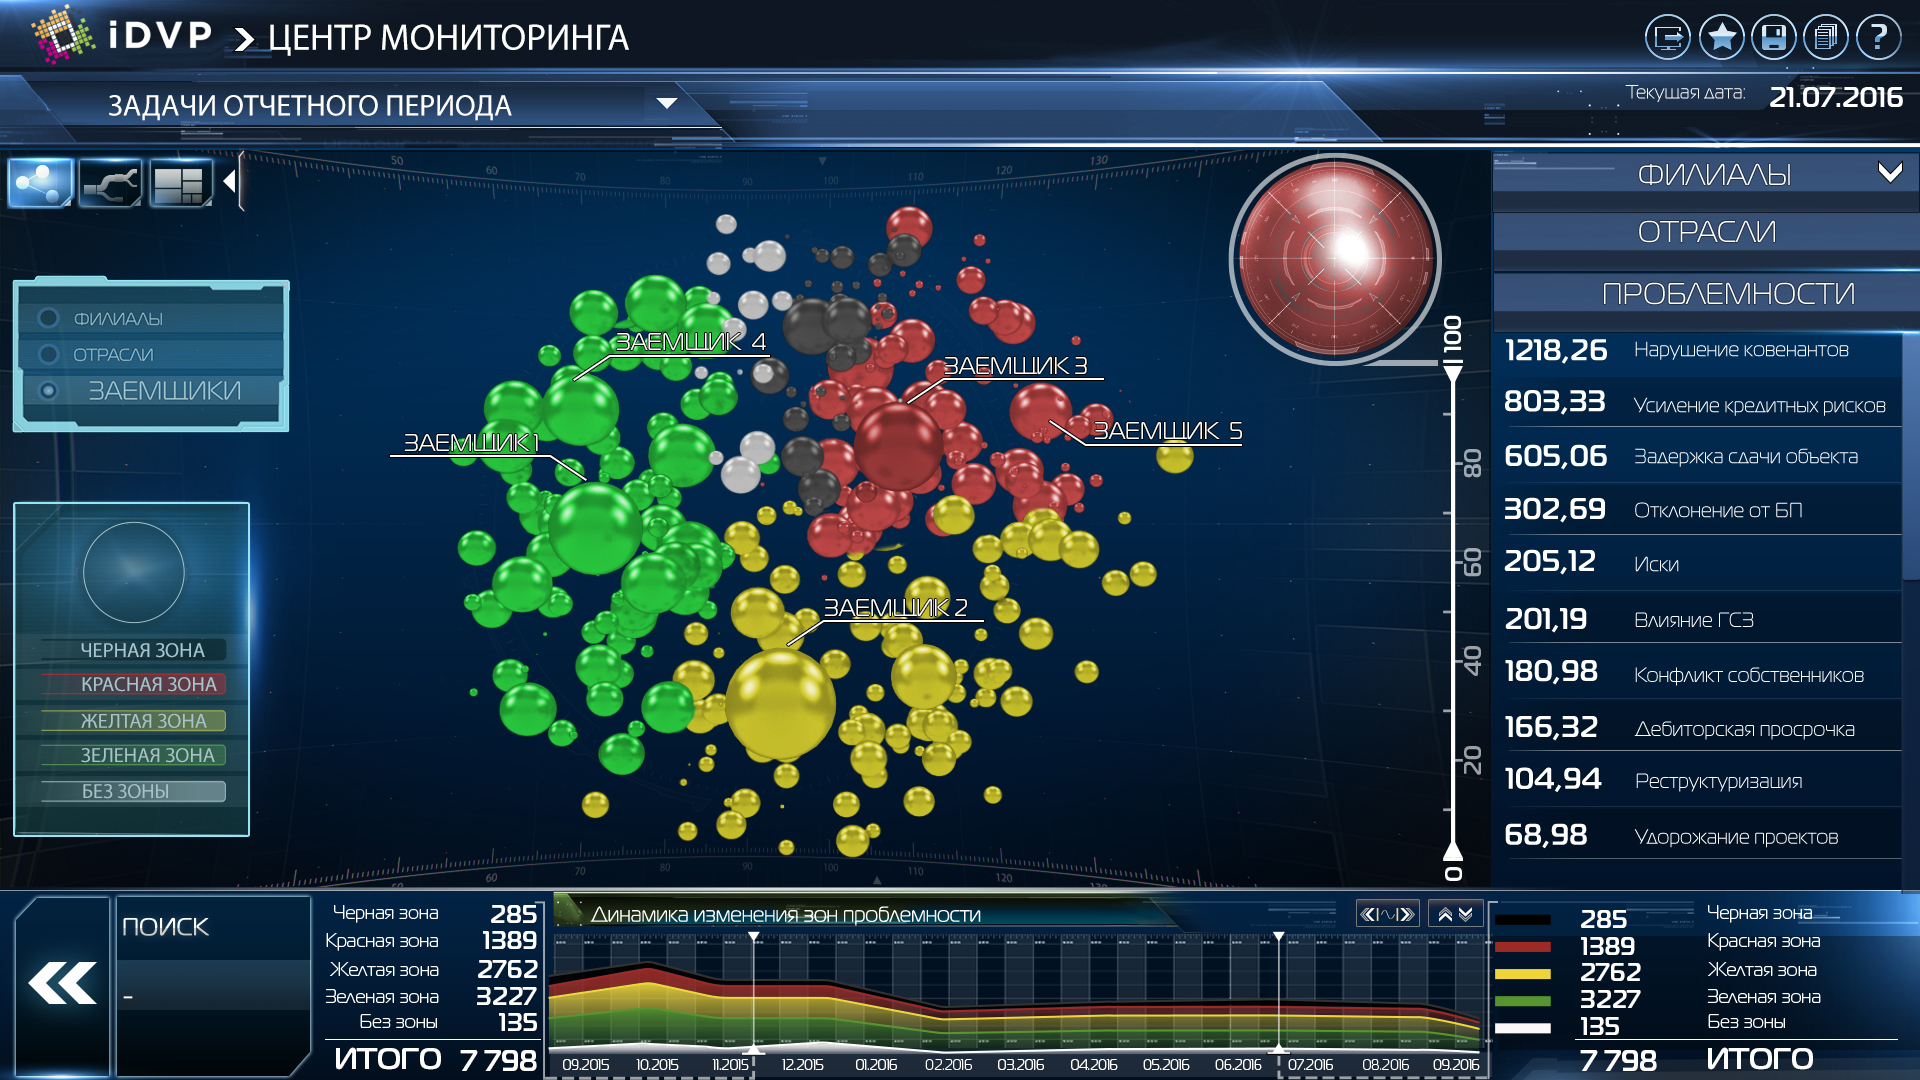
The main screen with the display of a circular diagram of the distribution of color zones of problematic

Main screen with debtors filtered by debt volume (on the scale to the left of the planets, the lower display limit is set at 20% of the maximum)
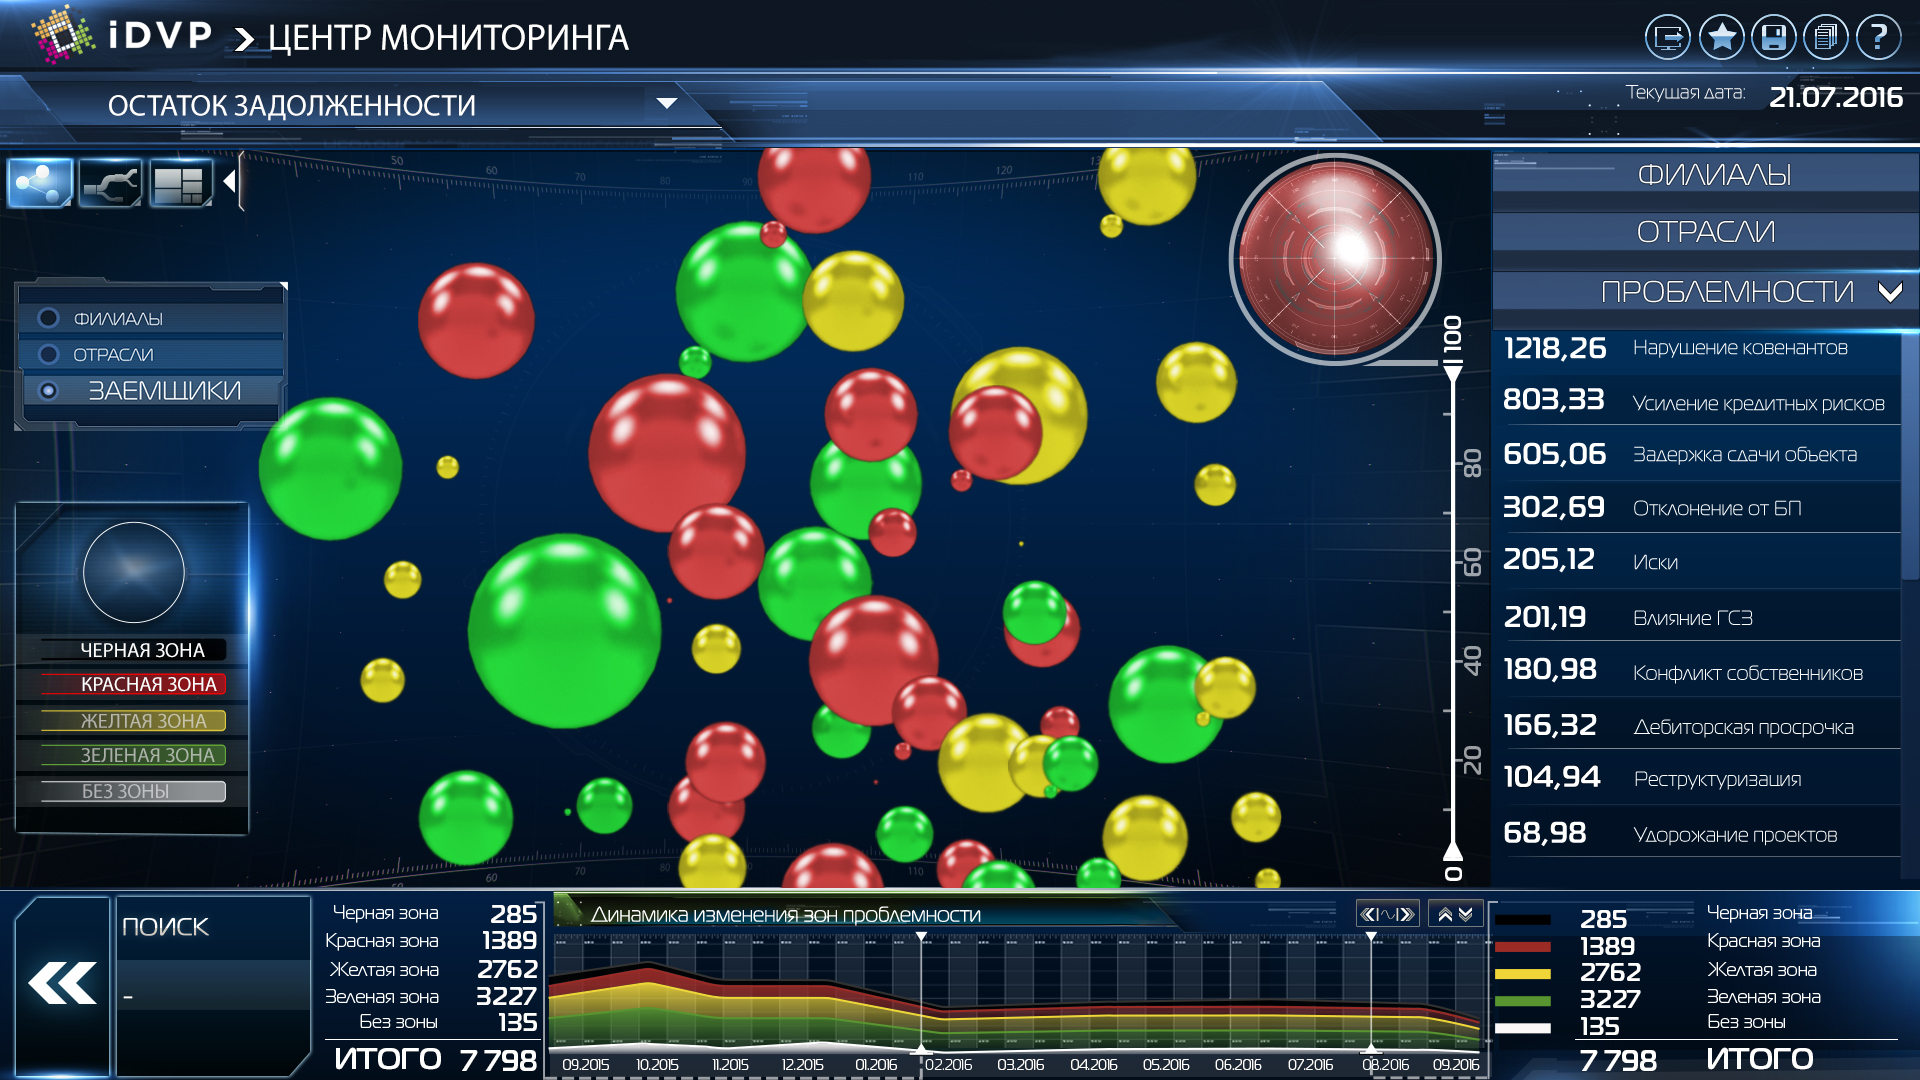
Main screen. The approach of the planets (zoom-in)
Borrower's card
Borrower card. Borrower's problem areas
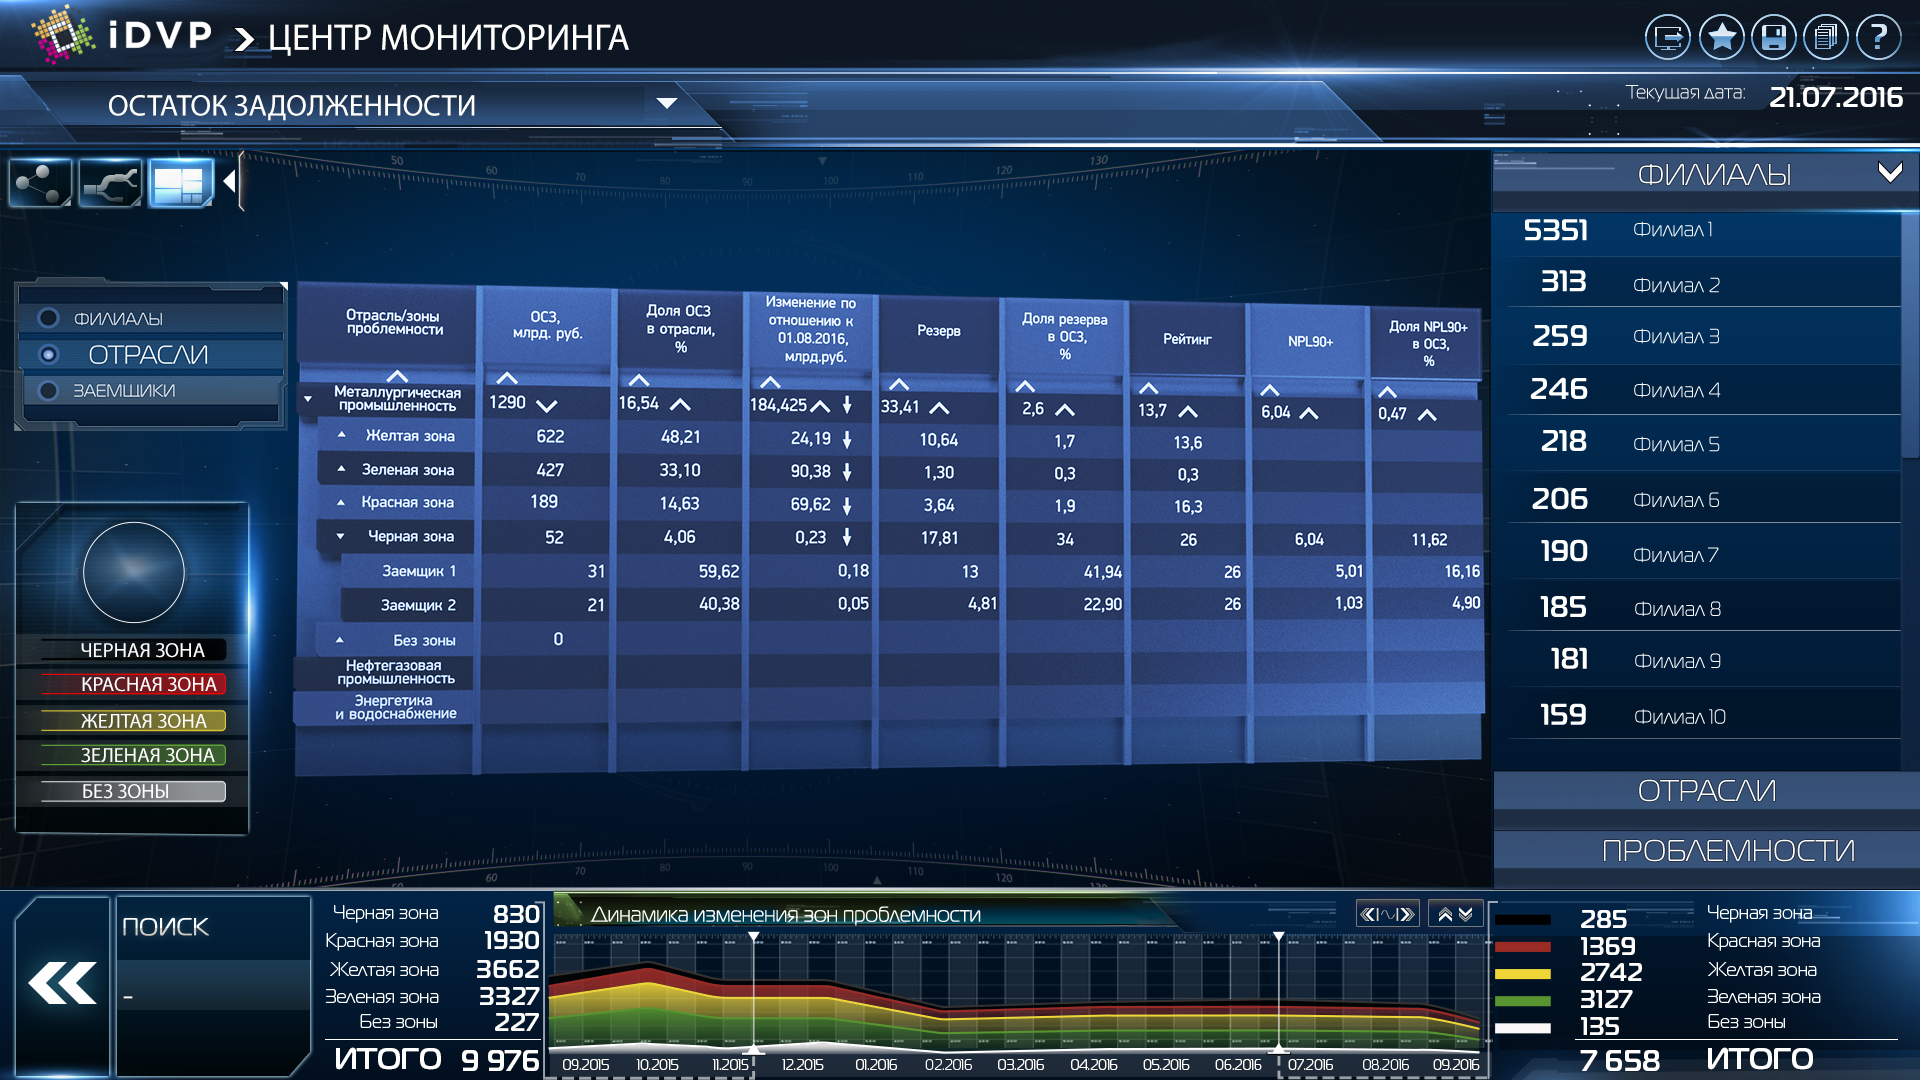
Tabular representation of the loan portfolio

Distribution of the loan portfolio by problem areas and change in their volume
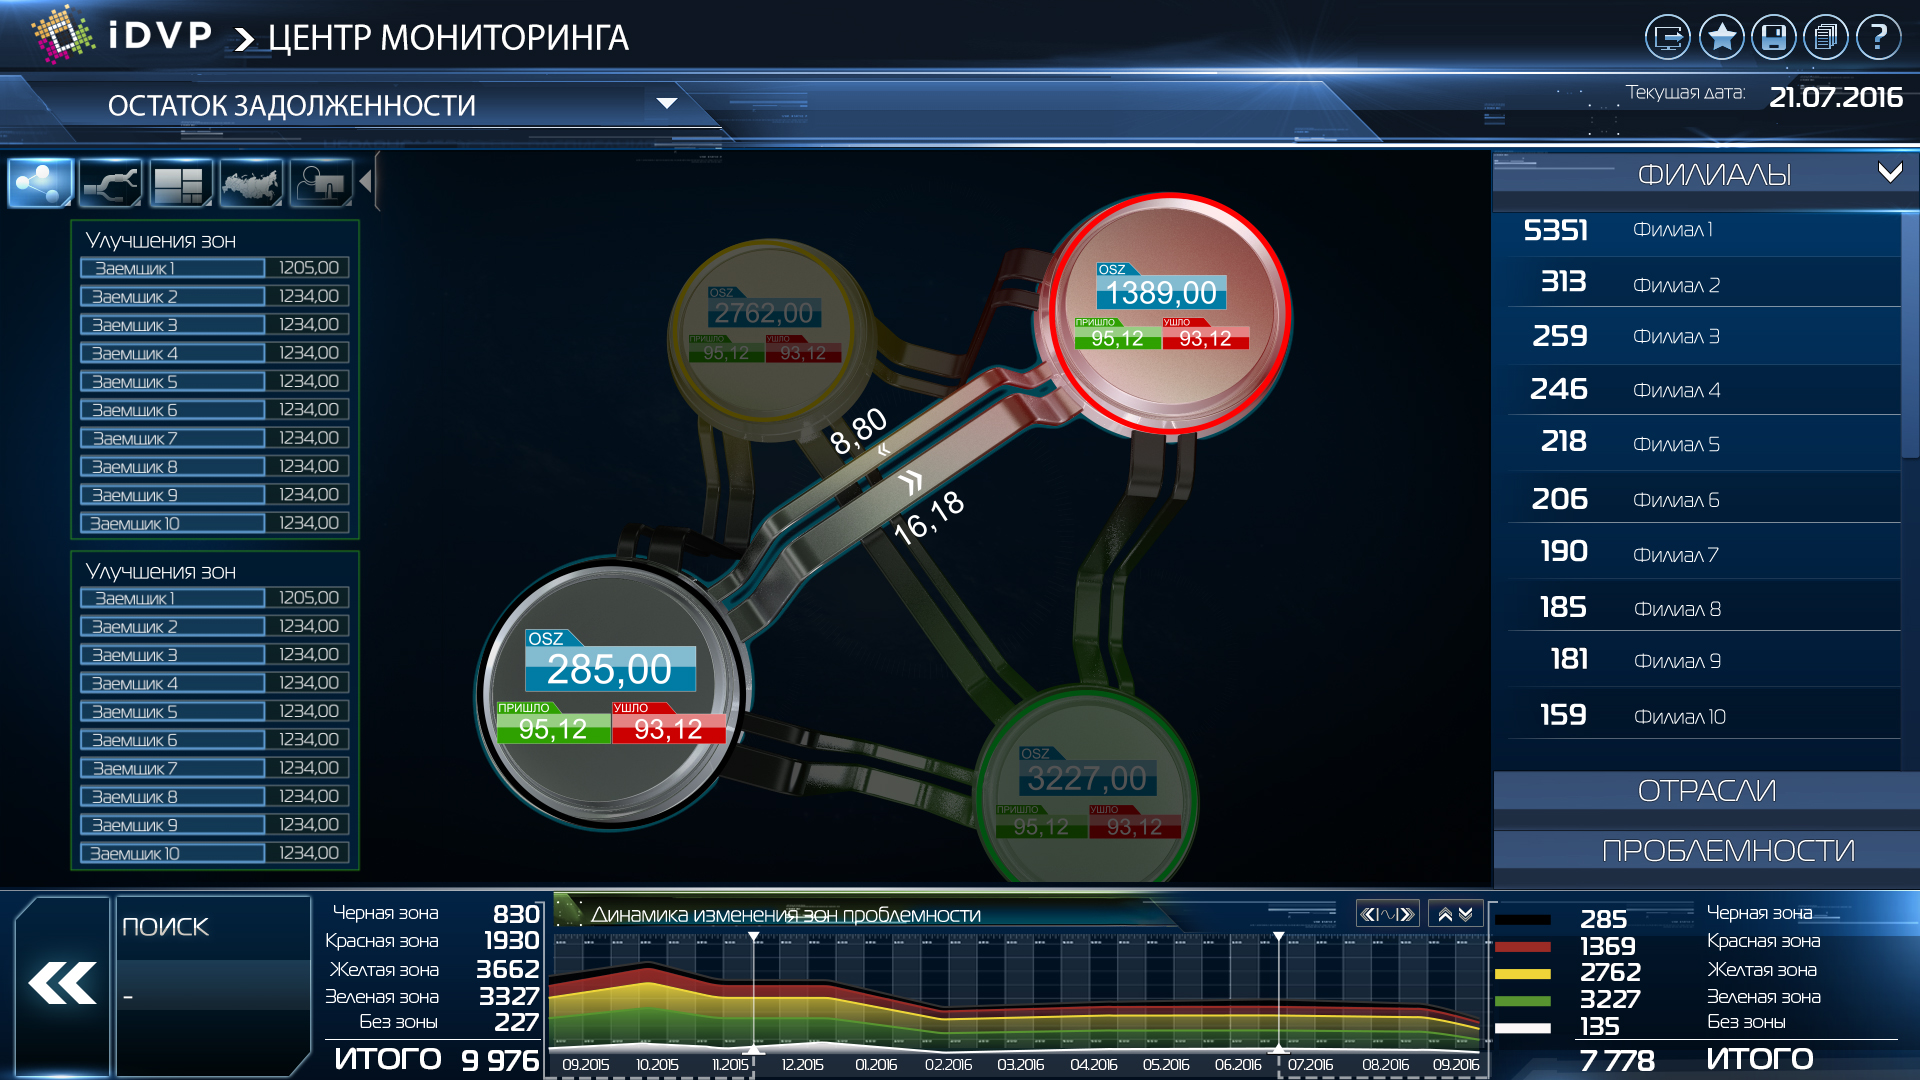
Dynamics of borrowers transition between two problematic zones (the sketch shows the transition between the red and black problematic zones)
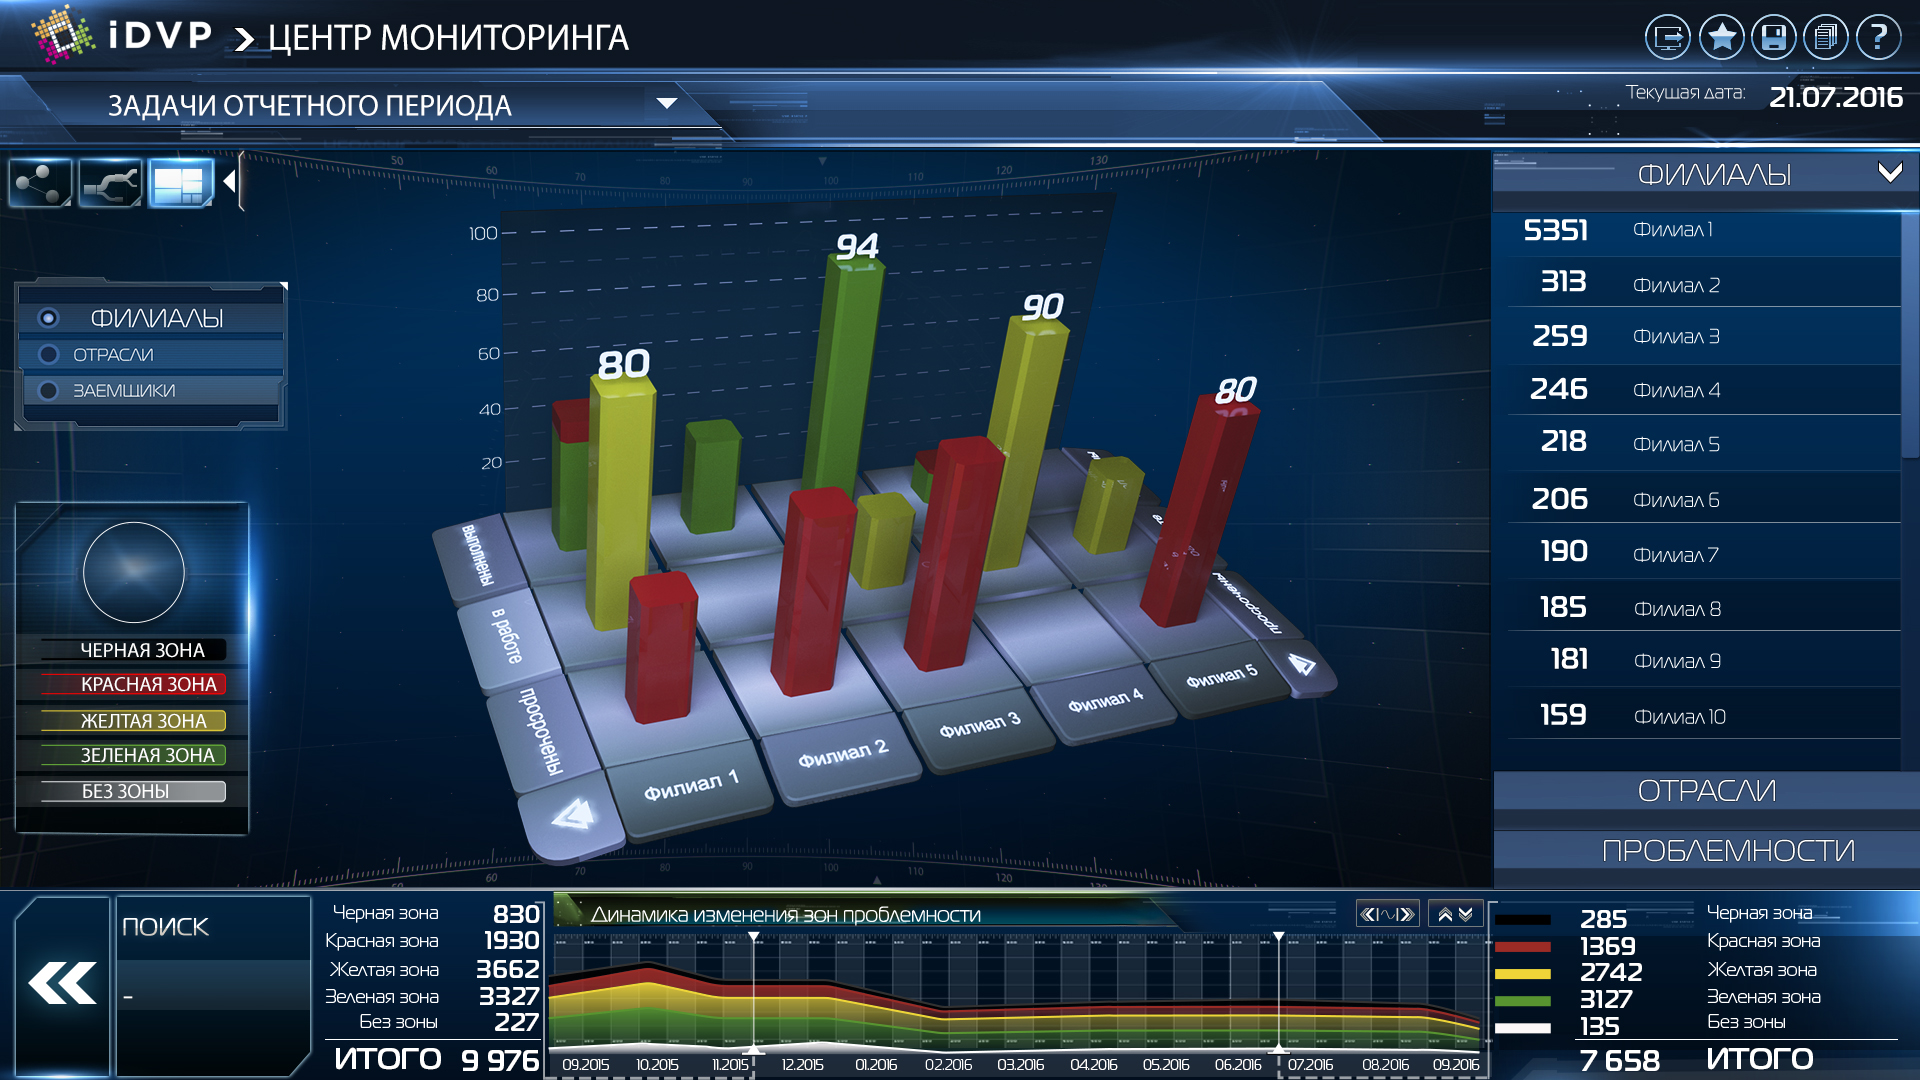
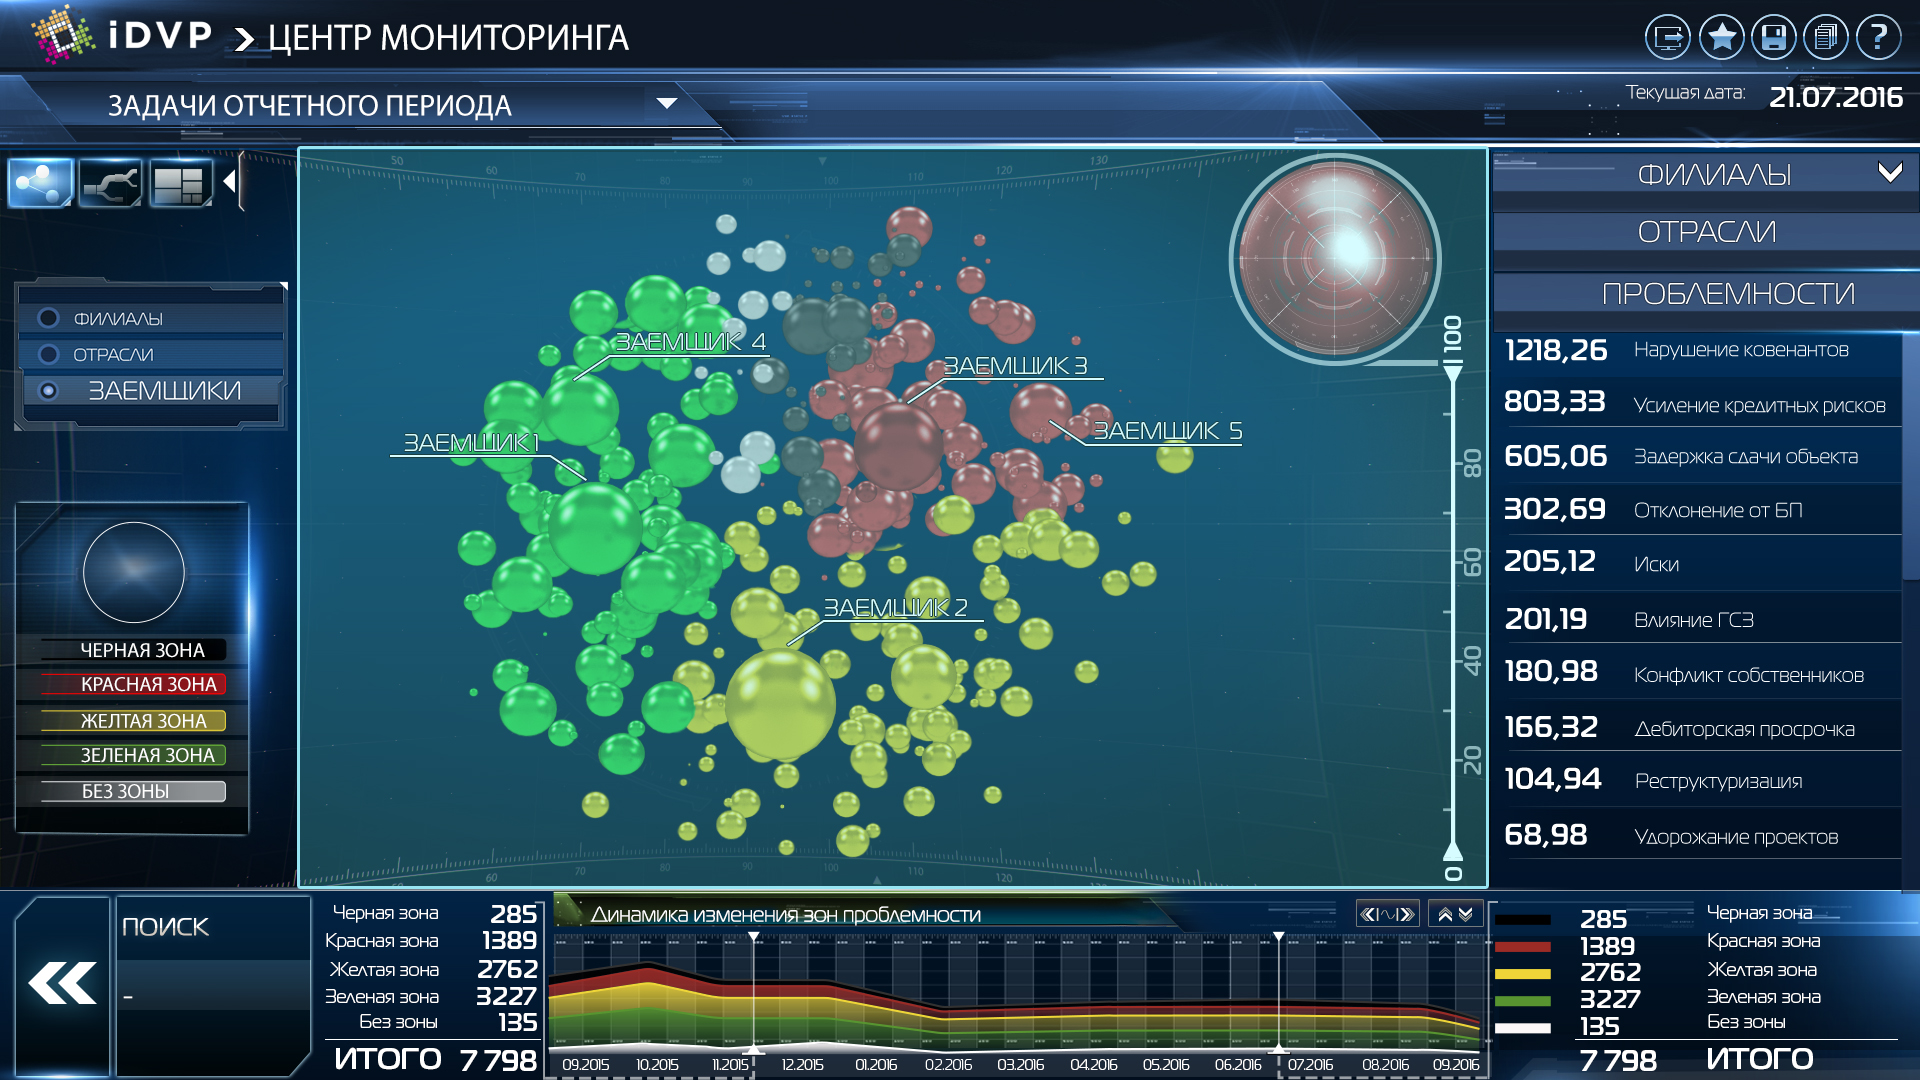
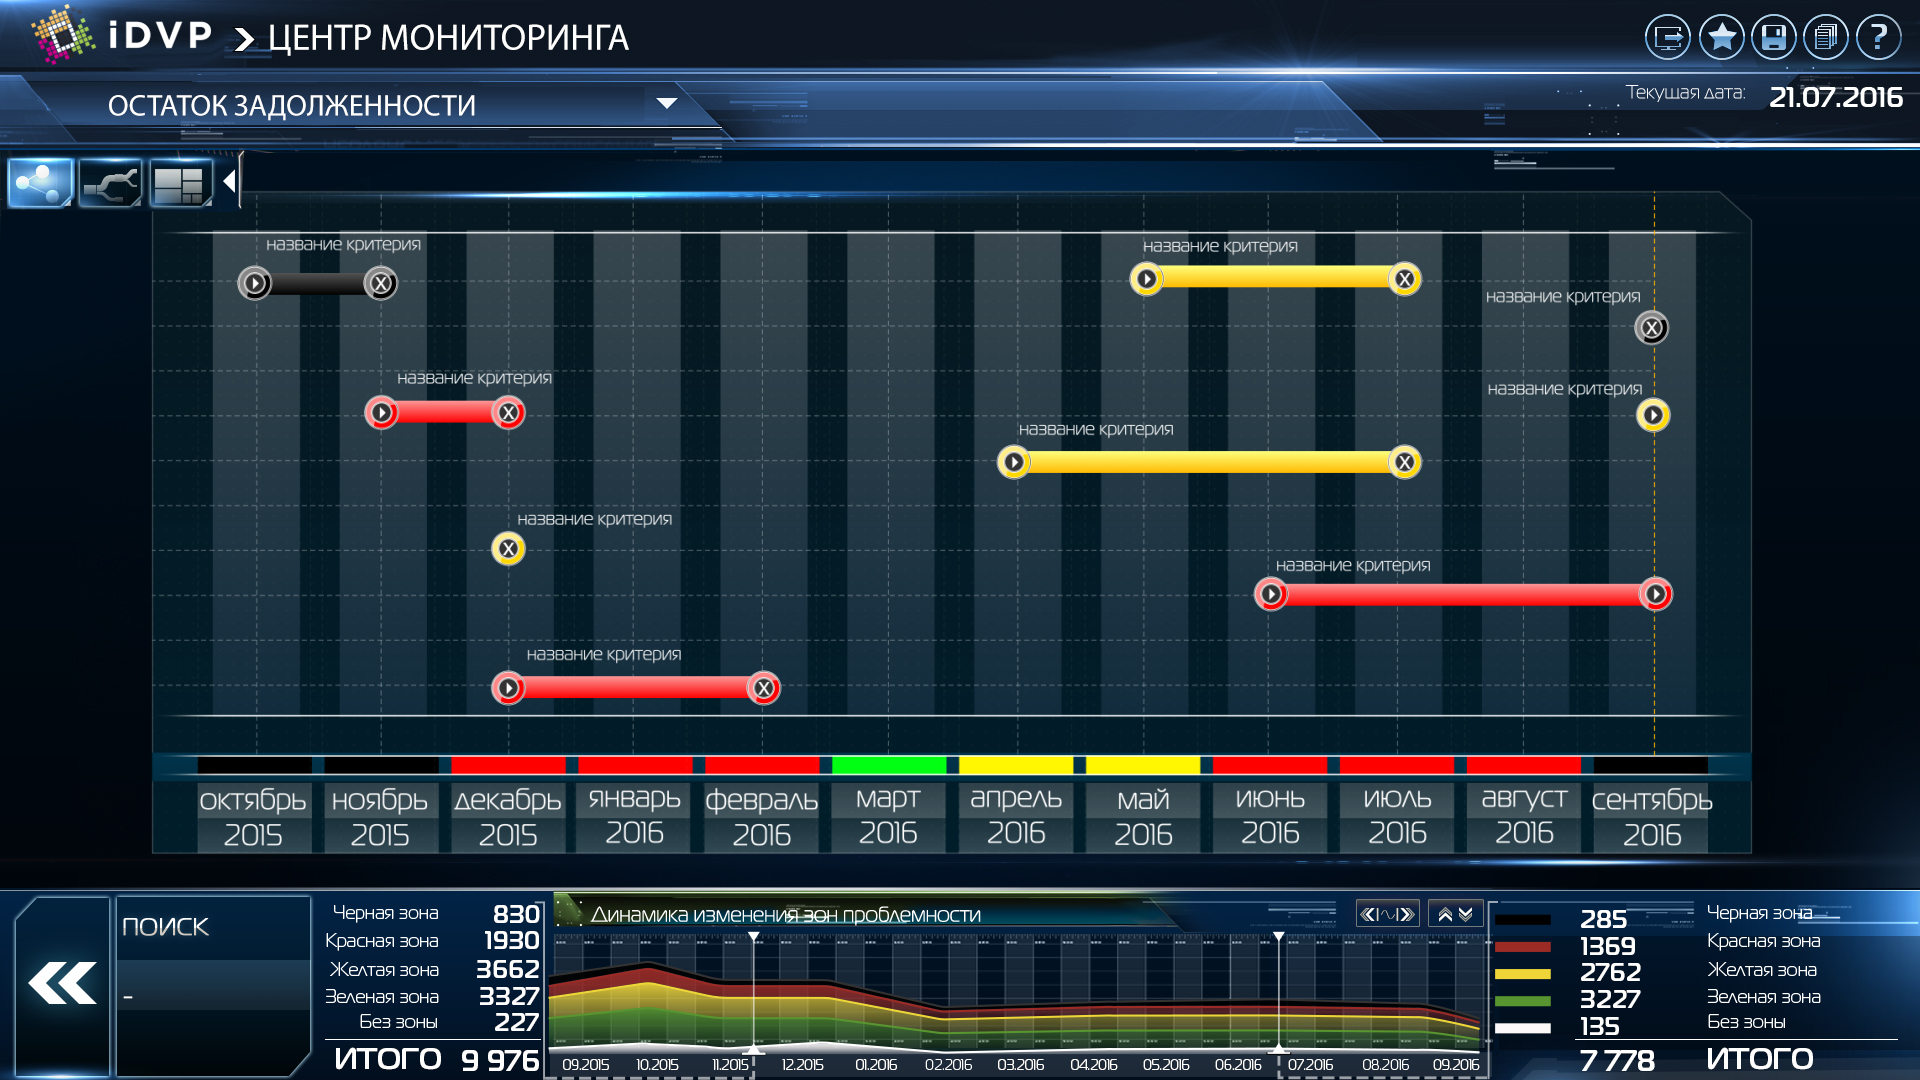
The dynamics of the tasks aimed at eliminating problems with borrowers
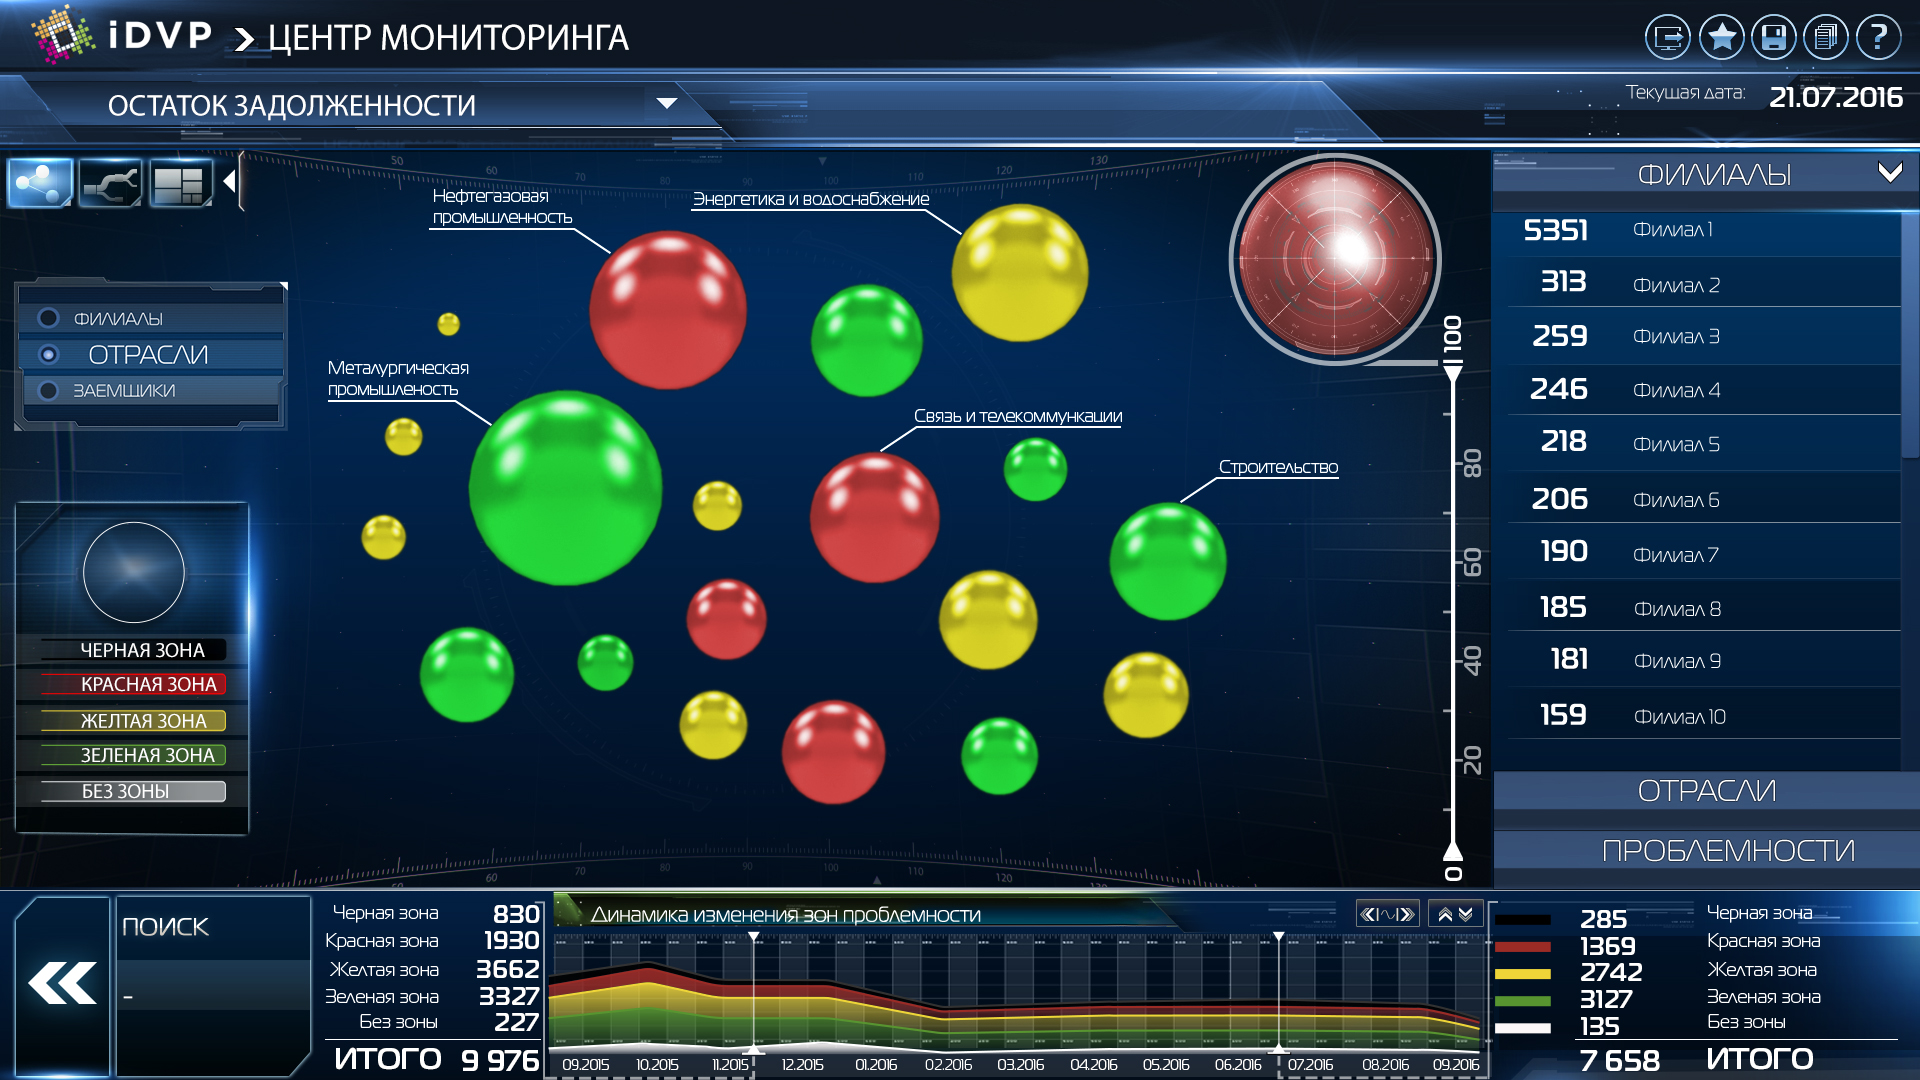
Display of the loan portfolio of the bank by industry
I hope that the visual part of our application is pleasant for perception and quite clear from the semantic point of view.
Formation of the final document "Description of the application"
According to the results of the analysis, solution design and sketching, a document “Application Description” was prepared, the structure and contents of which are described in detail in the previous article.
- According to this document, the project is currently ongoing, namely:
- Formation of statement on the visual part of the application;
- Formation of statement on loading and processing of application data;
- Development of 3D components (the “planet” component has already been developed by us);
- Imposition of the application;
- Testing and acceptance of the application.
Conclusion
I hope that our approach to data analysis and visualization will be useful for you.
I will also be glad to hear constructive criticism of our visual findings, if any.
Surely you had questions when reading. Ready to answer them in the comments. Write!
Thank you for reading to the end!
Source: https://habr.com/ru/post/349658/
All Articles