DevOps was invented by developers so that admins work more
 4 years ago, the use of containers in production was exotic, but now it is already the norm for both small companies and large corporations. Let's try to look at the whole story with devops / containers / microservices in retrospect, take another fresh look at what tasks we initially tried to solve, what solutions we have now and what is not enough for complete happiness?
I will talk more about the production environment, as I see the bulk of the unsolved problems there.
Previously, the production environment looked like this:
- monolithic application working in splendid isolation on a server or virtual server
- DB on separate servers
- frontends
- supporting infrastructure services (caches, queue brokers, etc.)
At some point, the business began to shift greatly in IT (to a digital product, as it is fashionable to say now), this led to the need to increase both development volumes and speed. The development methodology has changed to meet new requirements, and this in turn has caused a number of problems at the interface between development and operation:
- monolithic applications difficult to develop a crowd of developers
- difficult to manage dependencies
- difficult to release
- Difficult to deal with problems / bugs in a large application.
As a solution to these problems, we first obtained microservices, which transferred the complexity from the code area to the integration field.
If somewhere something has departed, then somewhere something must arrive. M. Lomonosov
In the general case, no sane admin responsible for the availability of the infrastructure as a whole would agree to such changes. To somehow compensate for this, we have something called DevOps. I will not even try to argue about what devops are, better see what results we got as a result of the participation of developers in operational issues:
- docker is a convenient way to pack software for deployment in various environments (yes, I really think that docker is just a package :)
- infrastructure as a code - our infrastructure has become much more complicated and now we just have to fix a way to restore it from scratch somewhere (it was optional before)
- orchestration - earlier we could afford to pour virtuals / iron servers with our hands for each application, now there are a lot of them and we want to have some kind of "cloud", which we just say "run the service in three copies on different pieces of hardware"
- a huge amount of tooling to manage this whole farm
A side effect of these new technologies and approaches is that the barriers to the creation of microservices have finally disappeared.
When a novice admin or romantic developer looks at a new picture of the world, he thinks that the infrastructure is now a “cloud” on top of a certain number of servers, which is easily scaled by adding servers if necessary. We kind of built an abstraction over our infrastructure, and now we are not interested in what is happening inside.
This illusion is shattered immediately after we have a load and we begin to be sensitive to the response time of our services. For example:
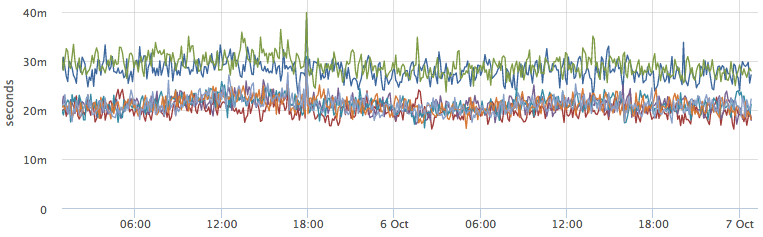
Why do some service instances run slower than others? Immediately after this, questions of this type begin:
- maybe there servers are weaker?
- maybe someone ate resources?
- need to find which servers the instances run on:
dc1d9748-30b6-4acb-9a5f-d5054cfb29bd
7a1c47cb-6388-4016-bef0-4876c240ccd6
and look at the neighboring containers and resource consumption
That is, we began to destroy our abstraction: now we want to know the topology of our "cloud", and the next step we want to manage it.
As a result, the typical "cloud" infrastructure currently looks something like this (plus, if you recognize your own :)
- there are docker- , kube- servers on each of them 20-50 containers
- bases work on separate pieces of iron and as a rule the general
- resource-intensive services on separate glands so as not to disturb anyone
- latency-sensitive services on separate glands , so that no one bothers them
I decided to try to put together (from the long-known components) and test a little approach that could save the "cloud" black box for the user.
We will begin of course with the formulation of the problem:
- we have our server resources and a certain number of services (applications) between which they need to be divided
- the load on neighboring services should not affect the target service
- opportunity to utilize idle resources
- we want to understand how much resources are left and when it’s time to add capacity
I tried to peep the solution or approach from existing orchestrators, or rather their cloud-based commercial installations of Google Satellite Engine , Amazon EC2 Container Service . As it turned out, this is just a separate installation of kubernetes on top of the virtualoks you rented. That is, they are not trying to solve the problem of resource allocation virtualok on your services.
Then I remembered my longtime experience with Google App Engine (the most true cloud in my opinion). In the case of GAE, you really do not know anything about the underlying infrastructure, but simply fill in the code there, it works and automatically scales. We pay for each hour of each instance of the selected class (CPU Mhz + Memory), the cloud itself regulates the number of such instances, depending on the current load on the application. Separately, I note that the processor frequency in this case shows only what part of the processor time will be allocated to your instance. That is, if we have 2.4Ghz percents, and we allocate 600Mhz, then we give 1/4 of the time of one core.
We will take this approach as a basis. From the technical side, there is nothing complicated about it, there are cgroups in linux since 2008 (there is a detailed description on Habré). Focus on open questions:
- how to choose restrictions? If you ask any developer how much memory his service needs, with a probability of 99% he will answer: "well, let 4Gb probably fit". The same question about the CPU will definitely remain unanswered :)
- How much do resource limits work in practice?
Cgroups: CPU
- shares: proportions of processor allocation
- quota: hard limit on CPU time per real time
- cpusets: binding processes to specific cpu (+ NUMA)
For the test, I wrote an http service that threshes half the time of the request with cpu and half the time just sleeps. We will run it on a server of 8 cores / 32Gb (hyper-threading is turned off for simplicity). Let us load it over yandex.tank from a neighboring machine (on a fast network), first only to it, and after some time to a neighboring service. The response time will be tracked by a histogram with bakts from 20ms to 100ms in increments of 10ms.
A starting point:
docker run -d --name service1 --net host -e HTTP_PORT=8080 httpservice docker run -d --name service2 --net host -e HTTP_PORT=8081 httpservice bar chart
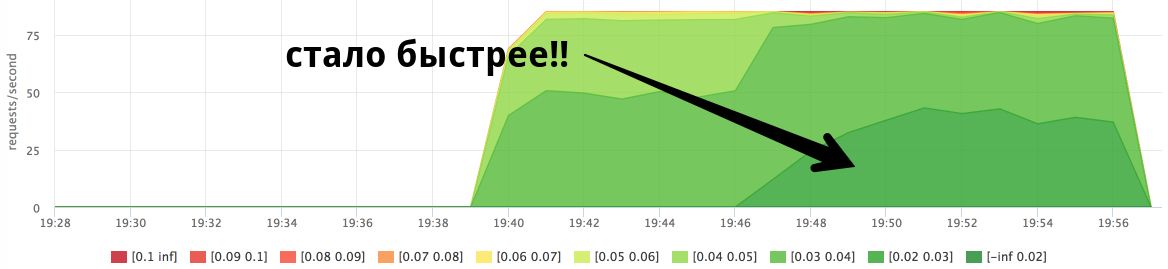
Consumption of cpu in the context of containers:
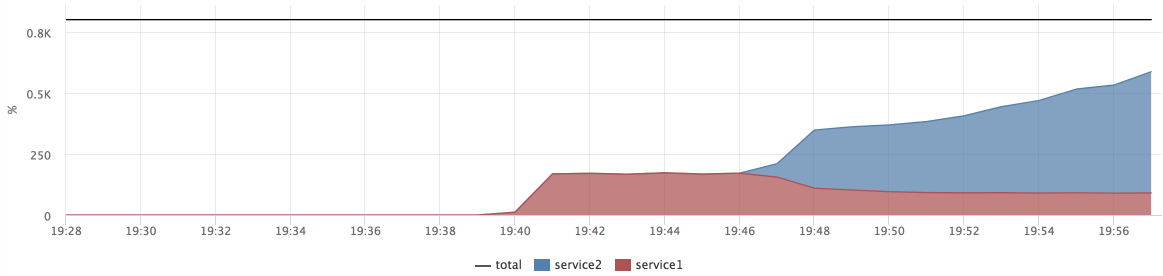
We see that at the time of loading the load on service2, the response time of service1 has improved. I had many hypotheses why this could happen, but I accidentally saw the answer in perf:
perf stat -p <pid> sleep 10 Slowly (no load on the neighbor):
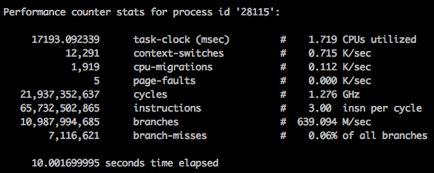
Fast (with a load on the neighbor):
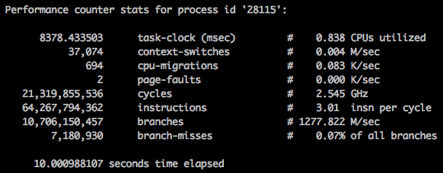
The pictures show that we spend the same number of processor cycles in 10 seconds in both cases, but the speed of their "waste" is different (1.2Ghz vs 2.5Ghz). Of course, this turned out to be the "best friend of performance" - the power saving mode.
We repair:
for i in `seq 0 7` do echo “performance” > /sys/devices/system/cpu/cpu$i/cpufreq/scaling_governor done Run the same test again:

Now, we see how service2 begins to interfere with expected service1. In fact, when no restrictions / priorities are set, we have the distribution of shares of processor time equally (cpu shares 1024: 1024). At the same time there is no competition for resources, the process can utilize all available resources. If we want a predictable response time, we need to focus on the worst case .
Let's try to hold service1 with quotas, but first we will quickly understand how cpu quotas are configured:
- period - real time
- quota - how much CPU time can be spent per period
- if we want to cut 2 cores: quota = 2 * period
- if the process has spent quota, processor time is not allocated to it (throttling) until the current period ends
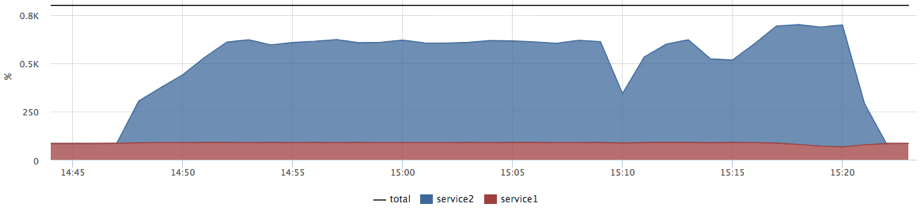
Let's allocate two cores to service1 (2ms cpu for 1ms) and serve up the increasing load:
docker run -d --name service1 --cpu-period=1000 --cpu-quota=2000 … Bar chart:

Actual cpu consumption:

Throttled time:
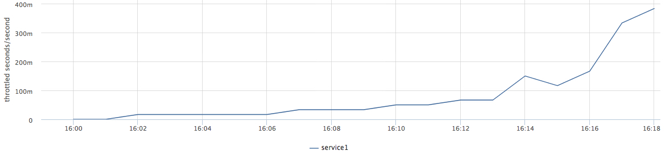
As a result of this test, we found the limit of service performance without degrading the response time at the current quota.
- we know how many limit requests can be submitted from the balancer to such an instance
- we can calculate in% cpu utilization by service
Fact: /sys/fs/cgroup/cpu/docker/id/cpuacct.usage
Limit: period / quota
Trigger: [service1] cpu usage> 90% (both on each cluster machine, and on the cluster as a whole)
Distribute resources:
- we divide the car into “slots” without overselling for latency-sensitive services (quota)
- if we are preparing to increase the load, we start each service so much that consumption is <N%
- if there is a clever orchestrator and a desire, we do it dynamically
- the number of free slots is our stock, we keep it at a comfortable level

In order to “finish off” the machine with a background load, we will try to set the maximum cpu-shares to our slots with quotas, and set the “background” tasks the minimum priority.
docker run --name service1 --cpu-shares=262144 --cpu-period=1000 --cpu-quota=2000 ... docker run --name=stress1 --rm -it --cpu-shares=2 progrium/stress --cpu 12 --timeout 300s 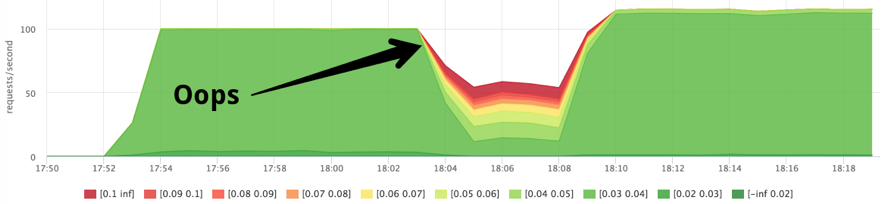
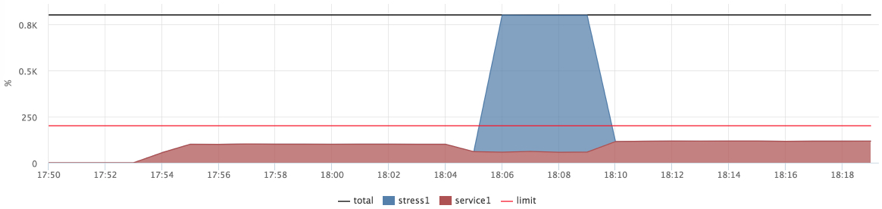
After this test, I stuck on exercises for 2-3 days with different scheduler settings ( CFS ) and studying its internal structure. The conclusions without details are as follows:
- time allocated slots (slices)
- you can turn sysctl –a | grep kernel.sched_ handles to reduce scheduling errors, but for my test I did not get a significant effect
- I set the quota to 2ms / 1ms, it turned out to be quite a small slot
- as a result, I decided to try the 20ms / 10ms quota (the same 2 cores)
- 200ms / 100ms on 8 cores can be “burned” for 200/8 = wall 50ms, that is, throttling in the limit will be 50ms, this is noticeable against the background of the response time of my test service
We try 20ms / 10ms:
docker run --name service1 --cpu-shares=262144 --cpu-period=10000 --cpu-quota=20000 ... docker run --name=stress1 --rm -it --cpu-shares=2 progrium/stress --cpu 12 --timeout 300s 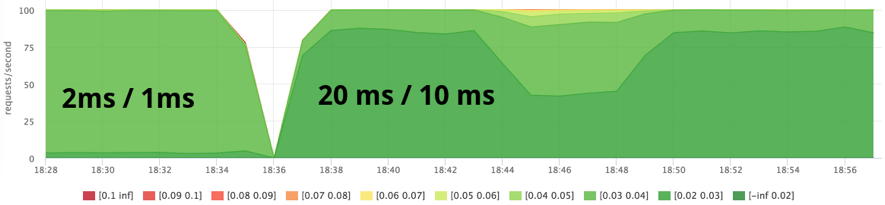
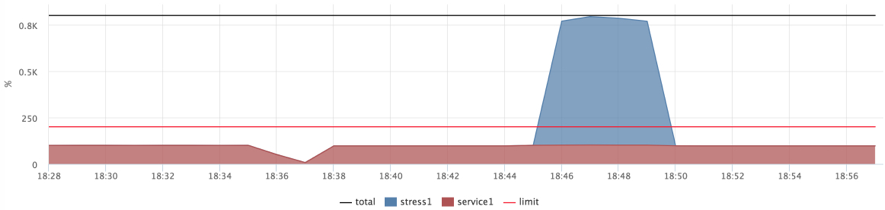
I considered such indicators acceptable and decided to finish with the CPU:
- we loaded the car to 100% cpu usage, but the response time of the service remained at an acceptable level
- need to test and select parameters
- “Slots” + background load - a working resource allocation model
Cgroups: memory
The story of memory is more obvious, but I would like to briefly touch on a couple of examples. Why do we even need to limit the memory services:
- a leaked service can eat up all the memory, and the OOM killer can nail him and not the neighbor
- A leak service or actively reading from a disk can “wash” page cache, which is very necessary for a neighboring service.
Moreover, using cgroups, we get extended statistics on memory consumption by various groups of processes. For example, you can understand which of the services how much page cache uses.
I decided to test the following scenario: our service is actively working with the disk (reads a piece from a 20Gb file from a random offset to each request), the data completely fits into memory (we preheat the cache), next we run a service that reads a huge huge file someone logs came to read).
dd if=/dev/zero of=datafile count=20024 bs=1048576 # 20GB docker run -d --name service1 .. DATAFILE_PATH=/datadir/datafile … We warm up the cache from the cgroup service:
cgexec -g memory:docker/<id> cat datafile > /dev/null Check that the file is in cache:
pcstat /datadir/datafile 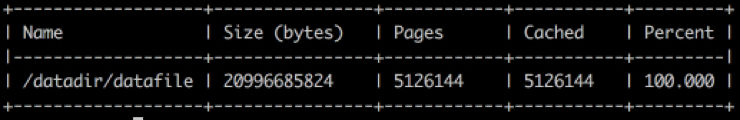
We check that the cache was credited to our service:
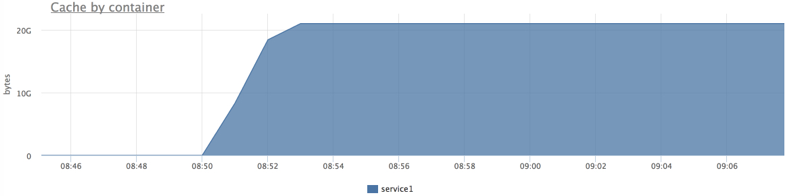
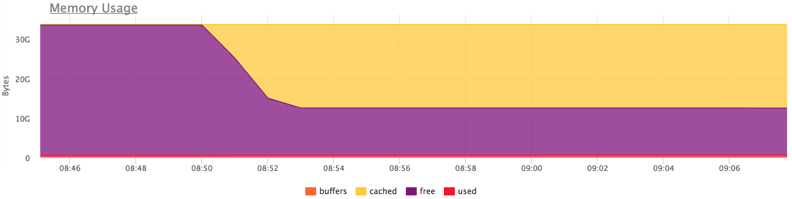
Start the load and try to "flush" the cache:
docker run --rm -ti --name service2 ubuntu cat datafile1 > /dev/null 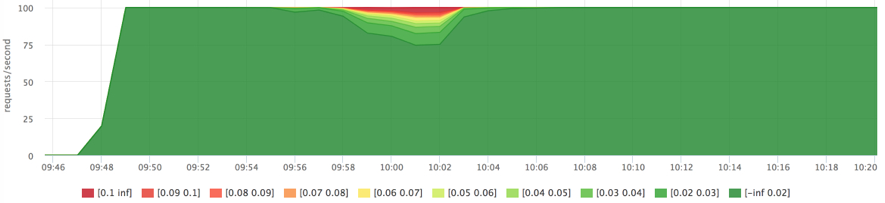
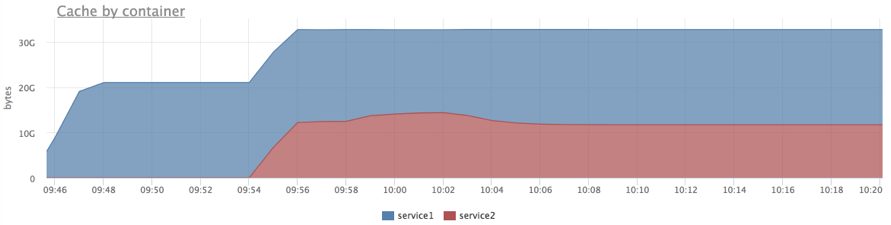
As soon as we "washed" the cache a little, 1 this immediately affected the response time.
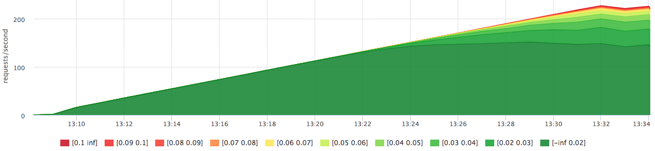
Let's do the same, but limit service2 1Gb (the limit applies to both RSS and page cache):
docker run --rm -ti --memory=1G --name service2 ubuntu cat datafile1 > /dev/null 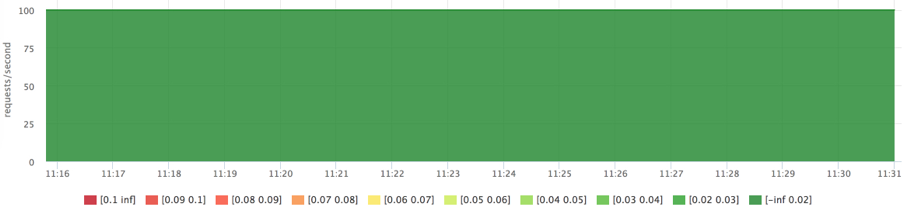
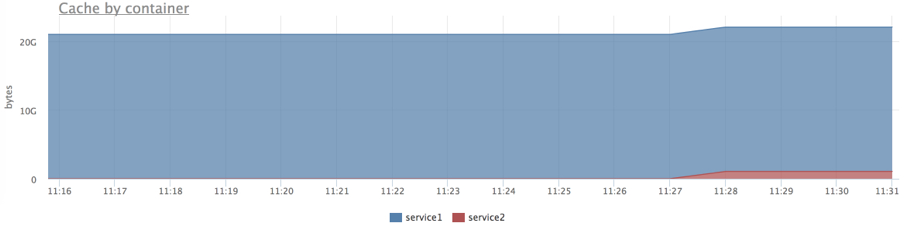
Now we see that the limit works.
Cgroups: blkio (disk i / o)
- all by analogy with the CPU
- it is possible to set the weight (priority)
- iops / traffic limits for read / write
- can be customized for specific drives
We will do the same as with the CPU: we will cut off the iops quota for critical services, but set the maximum priority, set the minimum priority for background tasks. Unlike the CPU, the limit is not very clear here (there is no 100%).
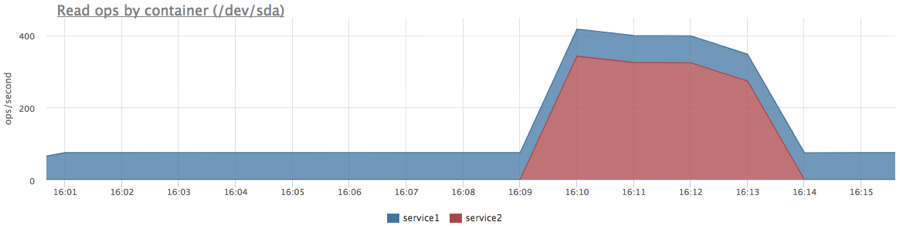
First, find out the limit of our specific SATA disk with our load profile. The service from the previous test: 20Gb file and random reading of 1Mb per request, but this time we clamped our service from memory to eliminate the use of page cache.
We received a little more than 200 iops, try to hold the service for 100 iops for reading:
docker run -d --name service1 -m 10M --device-read-iops /dev/sda:100 … 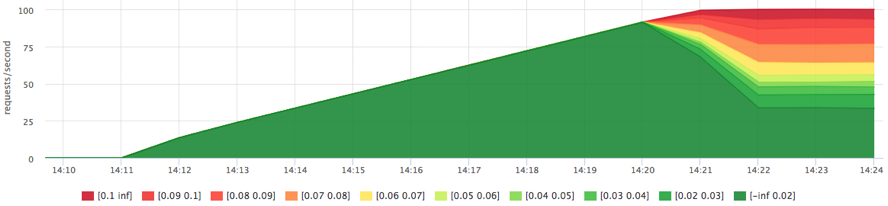
The limit works, we were not allowed to read more than 100 iops. In addition to the restriction, we now have extended statistics on disk utilization by specific groups of processes. For example, you can find out the actual number of read / write operations on each disk (/sys/fs/cgroup/blkio/[id₽/blkio.throttle.io_serviced), and these are only those queries that actually reached the disk.
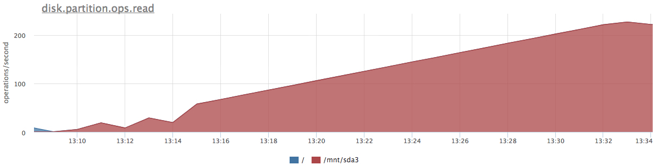
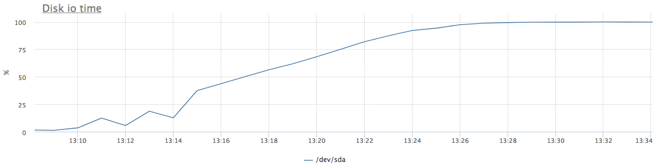
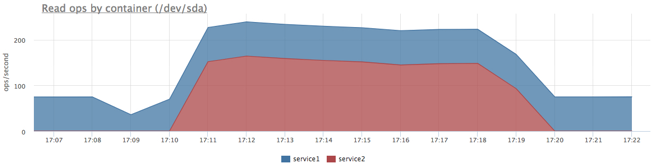
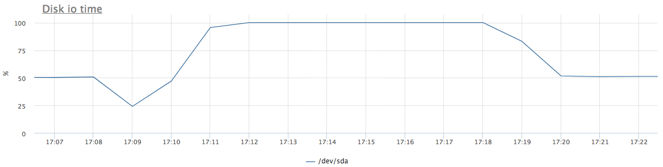
Let's try to reload the disk as a background task (for now, without limits / priorities):
docker run -d --name service1 -m 10M … docker run -d --name service2 -m 10M ubuntu cat datafile1 > /dev/null 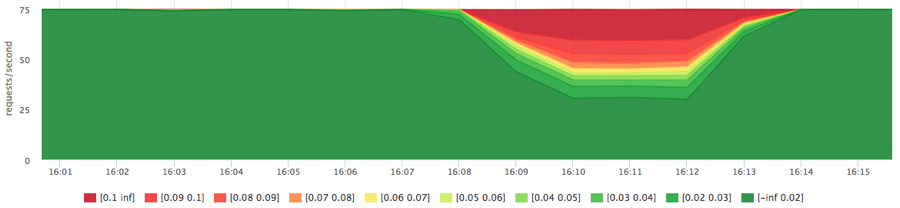
We got the expected picture, but since service2 was reading consistently, we got more iops in total.
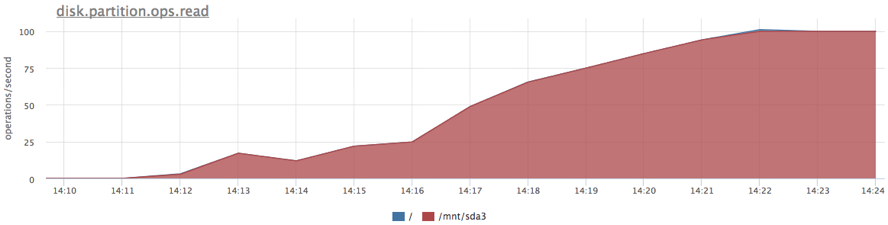
Now we’ll set priorities:
docker run -d --name service1 -m 10M --blkio-weight 1000 docker run -d --name service2 -m 10M --blkio-weight 10 ubuntu cat datafile1 > /dev/null 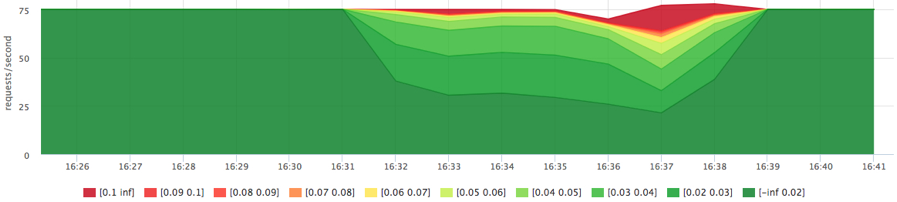

I'm used to the fact that nothing immediately works out of the box :) After a couple of days of exercises with IO linux schedulers (I remind you, I had an ordinary spindle SATA disk):
- I could not configure cfq, but there is something to twist
- The best result on this test was given by the deadline scheduler with the following settings:
echo deadline > /sys/block/sda/queue/scheduler echo 1 > /sys/block/sda/queue/iosched/fifo_batch echo 250 > /sys/block/sda/queue/iosched/read_expire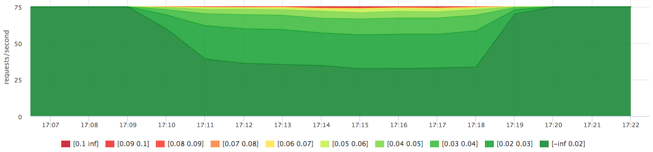
I found these results acceptable and did not explore the topic further.
Total
- if you really want to, set up and test everything thoroughly, you can run hadoop next to the combat database in prime time :)
- before the "true" cloud we are still very far away and there is a car of unresolved issues
- you need to look at the correct metrics, it is very disciplined and makes you deal with each anomaly, both in production and during similar tests
Advertising: all the interesting metrics that I found during this test, we added to our agent (now they are in beta testing, will soon be available to everyone). We have a 2 week trial , but if you want to look at the cgroups metrics, write to us, we will extend the trial to you.
')
Source: https://habr.com/ru/post/349610/
All Articles