"Make beautiful." Visualize learning with Google's Tensorboard

Beauty, as you know, requires sacrifice, but the world promises to save. Enough fresh (2015) Google visualizer is designed to help deal with the processes occurring in the networks of deep learning. It sounds tempting.
The colorful interface and loud promises are delayed to parse this designer devil, with non-intuitive debugging glitches. The API is unusually poor and often updated, the examples on the web are of the same type (the eyes can no longer look at the hackneyed MNIST ).
')
So that the experience was not in vain, I decided to share the simplest description of insights with habravchanami, for the Russian-speaking guides are few, and the English-speaking all as one person. Maybe this introduction will help you reduce the time to get acquainted with the Tensorboard and the number of abusive words at the start. Also I will be glad to know what results he gave in your project and whether he helped in a real task.
In order not to repeat once again, I will not raise the topic of working with Tensorflow as such, you can read about it, for example, and here at the end you can even look at an example of using Tensorboard. The narration will be conducted with the assumption that the concept of the graph of operations used in Tensorflow is already familiar to you.
The official Guide Tensorboard contains, in fact, all that is required, so if you are used to working with a brief description and picking up ideas on the fly, you can follow the link and use the developer’s instructions. I couldn’t recognize and apply them.
The general principle of logging
Pulling the parameters of the network, built in TensorFlow (TF), is very difficult. TensorBoard (TB) acts as a tool in this task.
TF is able to collect, one may say, in “boxes” - summary , data, which TB displays to us. Moreover, there are several types of these "boxes" for different types of data.
- tf.summary.scalar Here you can put any numerical values, for example, loss functions for each (or not each) epoch of training. Display in TB will be in the form of the usual schedule x (n) .
- tf.summary.image Collects images.
- tf.summary.audio Collects any audio files.
- tf.summary.text Collects text data.
- tf.summary.histogram Collects a set of values and in TB displays "layered" histograms of the distribution of these values, for each recording step. Good for storing data weights, you can track changes in their values at each age of training.
The argument is the name of the “box” and the variable from which the value will be taken. For example:
tf.summary.scalar('loss_op', loss_op) In my task the scalar and histogram types were relevant.
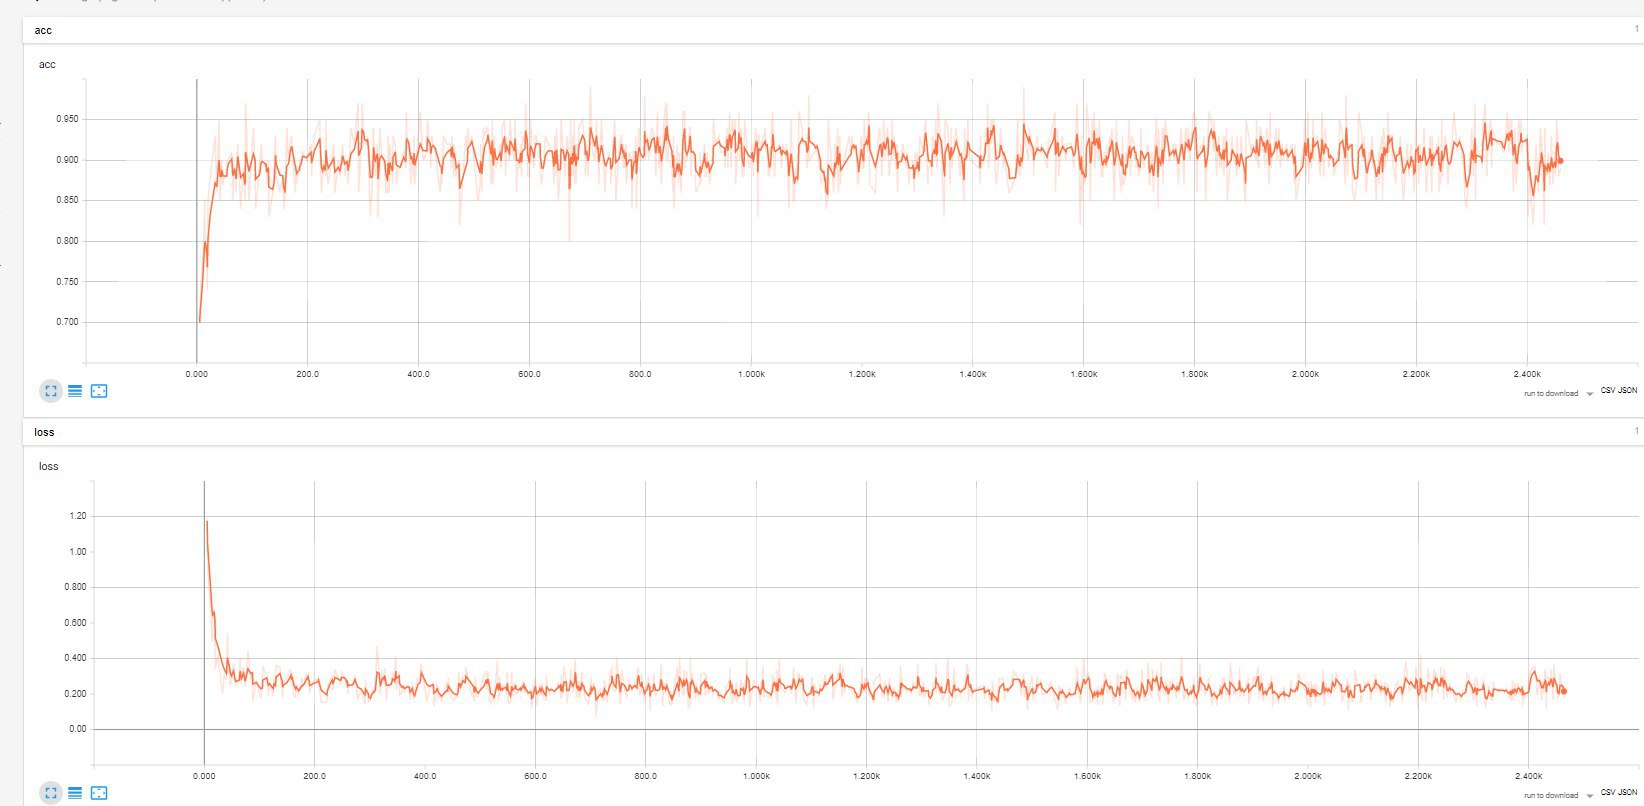
What does scalar and histogram look like
Accuracy on the training sample and loss function. The bold graph is drawn (the smoothing level is set by the user by the slider), the pale original data.
Histograms of weights of three layers, for two values of the Learning rate (0.001 and 0.0001).
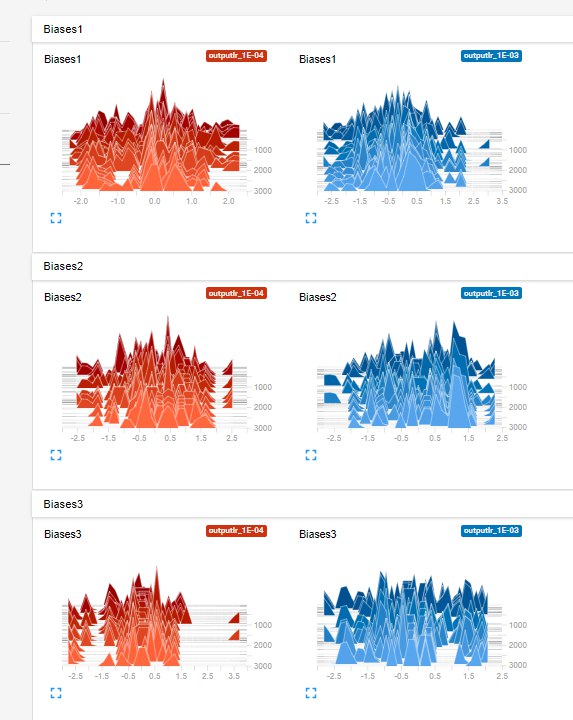
Histograms of weights of three layers, for two values of the Learning rate (0.001 and 0.0001).
In order not to fill up each “box” explicitly, use merge_all () , thus collecting them in one pile and getting the necessary data for all the “boxes” at a time.
tf.summary.scalar('loss_op', loss_op) # "" . tf.summary.scalar('accuracy', accuracy) # tf.summary.histogram('Biases1',biases['h1']) # ( h1) tf.summary.histogram('Weights1',weights['h1']) # """ ... , summaries ... """ merged_summary_op = tf.summary.merge_all() # "" Naturally, the mentioned accuracy , loss_op , biases and weights are declared separately as members of the current graph of operations.
Further, merged_summary_op is simply activated at the right moments during session execution. For example, when starting training:
[_, _, sum_result] = sess.run([train_op, loss_op,merged_summary_op], feed_dict={X: batch_x_norm, Y: batch_y}) # , , "", sum_result summary_writer.add_summary(sum_result, i) # , i- As you noticed, the result is written to the file using (sorry for diminutive, but I couldn’t think of an alternative) “writing down” summary_writer and its add_summary function. "Recorder" is announced in advance, the path to the folder with logs is indicated in the arguments. Creating several writers is conveniently used to post results on test and training samples. I’ll tell you more about this in the next article. Plus, you can add in the logs the values of the used hyper parameters (such as learning rate, type of activation function, number of layers, etc.). More details on how to set hyper parameters and see here ), short ones will also be displayed in TB.
Log_Dir="logs/outputNew/myNet" # hparam= "LR_%s,h1_%s,h2_%s,h3_%s" % (learning_rate,n_hidden_1,n_hidden_2,n_hidden_3) # summary_writer= tf.summary.FileWriter(Log_Dir+hparam) summary_writer_train.add_graph(sess.graph)# writer TB The TB visualizer is launched using the command (of course, via the console):
tensorboard --logdir='Log_Dir' So having banished the session, having trained the network and collected all the necessary data in the logs, you can finally see them in the browser by going to localhost: 6006. I think you yourself will understand the different display formats: at least it is really intuitive for TB. And how to display graphics in groups (hyper parameters, for example), use tags, I will tell in the next article.
So, in general, the process of preparing the soil for TB (omitting the features of building a graph of operations with TF, of course, is not about that now) looks like this:
- We form a graph of operations , following the principles of working with TF
- Create “boxes” -summary for data that we want to collect in logs
- Merge all “boxes” with merge_all ()
- We set the “record manager ” summary_writer , in which we specify the path for the logs and immediately add our graph
- During the session, we call the smug boxes in the run-e and write the result using the summary_writer
- We look at the result in TB, fingers crossed
Three problems that can surface
TB does not see the logs
Check the path indicated to them! If you do not see again, check again! And so it does not work. If there are files in the logs folder, then TB cannot see them only if the directory is incorrect.
Heavily inhibited update schedules
In order for the graph to appear in the TB, you have to wait up to 15 minutes. At first, I thought that these were some problems with logging, but even restarting TB did not help to solve the problem of late upload of new data. I had to work in the mode “write logs - wait 10 minutes - see what loaded TB”. The computer has never had to blame the brakes, so the root of the problem is somewhere else. It will be interesting to hear if someone else has encountered this glitch.
Duplication of names and data
Periodically, I got out the duplication of data. For example, there could be several types of precision or weights. Or something like this , and this problem could not be resolved, since it is unclear the origin of duplicates. I urge to be more careful with naming - this sometimes helps (in the graph of operations and in summary) and the analysis of the final graphs. Sometimes there it turns out not what we would like.
Next, I plan to highlight the issue of the separation of writers for test and training samples, as well as what are the options for displaying a generated heap of logs.
In a working draft on the classification of time-series plots, the result is better than a simple log. Regression, neurons were not given, no matter how I tried to try different configurations. But the tool is mastered, which means it can bear fruit in the future.
Stay tuned!
PS In our company “Inkart” there are open vacancies for brainy programmers and electronics engineers, and there is also a chef, cool corporate parties and an office on the shore of the lake. We develop and produce cardiorespiratory monitors used by most cardiologists in Russia. We are constantly improving the processing algorithms and the iron part of the case. Free minds from Petersburg - write in private messages for details.
Source: https://habr.com/ru/post/349338/
All Articles