The evolution of traffic jams rendering in MAPS.ME

Hello! Last year we launched traffic jams in our app. We have been preparing for a long time to launch, and in the course of this preparation, our views on solving problems associated with traffic jams changed. Rendering of traffic jams has gone a long way from the first prototypes to the first implementation, and today I want to talk about the evolution of rendering jams on the way to release.
Initial task
At the very beginning of the journey, we set the task of learning how to draw traffic jams very quickly. First, “very quickly” meant the speed of appearance. Traffic jams should occur on the smartphone screen with minimal delays (ideally, without them at all), so that the user does not wait and, accordingly, is not annoyed. Secondly, the overall rendering performance in the application should not be seriously affected. Thirdly, you need to display traffic jams on secondary roads at such scale levels where our competitors no longer show traffic jams.
In short, it was necessary to learn how to quickly draw a lot of additional data on mobile devices. The benefit of our graphics engine was designed with the rendering of large amounts of data. That you estimate working volumes of our engine, I will provide the following statistics.
| City | The number of polygons in the scene |
|---|---|
| Moscow | 400,000 |
| New York | 600,000 |
| London | 800,000 |
NB: hereinafter measurements were taken at the zoom level with the best detail and the largest visible area of the map (screen resolution 2732 × 2048, iPad Pro 12.9 ″).
With such data volumes, we support 30–60 FPS on the target set of devices in map viewing mode, and it was important to keep this indicator.
Prototype
Here it is necessary to mention the source data for traffic jams. In this post we will not talk about the format of transmission and compression. We take for the input data an array of pairs (road segment; color). A segment is a two-point straight stretch of road + direction bits needed for bi-directional roads. In addition, the data comes to us in such a way that we always get a complete list of segments for all roads on the map. Below is an example of the input data for the graphics engine.
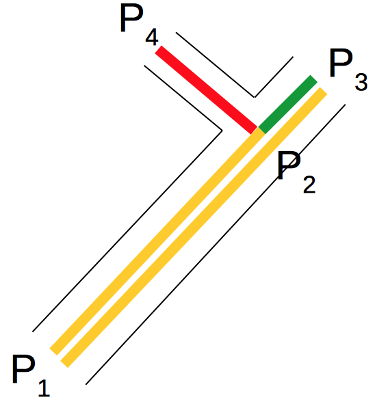
(P 1 ; P 2 ; right side) - yellow
(P 1 ; P 2 ; left side) - yellow
(P 2 ; P 3 ; right side) - yellow
(P 2 ; P 3 ; left side) - green
(P 2 ; P 4 ; right side) - red
As I once wrote , our graphics engine uses vector data and renders the map in real time. With the help of batching, we minimize the number of draw calls, which allows us to effectively render large volumes of geometric data. Traffic data, fortunately, has good uniformity and fits well into the current batting system.
For the prototype, we chose the following architecture. We have divided the geometric data into two parts: mutable (color) and immutable (position, normal, etc.). For each of the parts, we created separate vertex and index buffers and gave the geometric data in two data streams for drawing. When it came time to update the colors of the plugs, we rewrote only mutable buffers. In order to speed up the formation of geometric buffers, we used pre-caching of unchanged parts.
When the prototype was working, we saw that traffic jams did appear and render very quickly, provided that the prekeshing was completed. Traffic jams appeared even faster than the map itself. However, the size of the cache unpleasantly surprised us. For Moscow, about 700 MB of RAM had to be spent on the cache - about 10 million polygons. On the one hand, we were proud that our engine was able to process such amount of data on a mobile device, on the other hand, it became obvious that such a solution was not suitable for production.
In the second prototype, we began to solve the problem of the rapid appearance of traffic jams without excessive consumption of RAM. To do this, we "turned over" the cache, putting at the center of it not immutable geometric data, but color data. We began to cache the data about the color of the road segments, and the geometric data was formed on the fly for the area of the screen that the user was currently looking at. At the same time, the cache of colors was not prepared for sending to OpenGL buffer, it was used exclusively for receiving colors of specified road segments. The result: geometric buffers of the plugs began to form in a manner similar to the tiles of the card.
The size of memory consumed by the rendering of traffic jams has decreased to 50 MB for Moscow, however, we have lost a lot in the appearance rate of the map at some levels of scale. Traffic jams now arose along with the map, but the delay in the appearance of the map increased greatly, which was also unacceptable.
After profiling, we found that the generation of real-time geometric buffers for traffic jams takes too long at those scale levels where minor roads are included, but you can see a fairly large portion of the map. The main problem was that we could not algorithmically accelerate the generation of geometry. OpenGL functions for transferring data from CPU-controlled memory to GPU-controlled memory turned out to be bottlenecks. The only way out of this situation was to reduce the amount of geometric data.
Implementation
To reduce the amount of geometric data, we chose a technique widely known in real-time rendering - the use of levels of detail (LOD - level of details). If the width of a traffic jam for a road of a given class at a given scale level is less than the set limit, then we draw it as a hardware line (using the GL_LINES primitive). It is still necessary to form a geometric buffer for a hardware line, but the size of such a buffer is substantially smaller.
This approach has two significant drawbacks:
- The maximum width of the hardware line is different for different devices. Moreover, on some devices it may be quite small (in the worst case, one pixel). In this case, we can not use hardware lines for most traffic jams. Fortunately, most of these devices are either outdated, or belong to the lowest price segment, have a low-resolution screen, and therefore a smaller amount of displayed data.
- Hardware lines are not visually attractive. Aliasing is well manifested in them, and there are no joints between the segments. Therefore, we had to use hardware lines where it is least noticeable: on secondary roads.
Nevertheless, after adjusting the width of the traffic jams at various levels of scale, the result was almost satisfactory.
To further reduce the amount of memory consumed by traffic jams, we introduced an additional preemptive cache. The fact is that our cartographic data is broken down into fairly small areas, and traffic data are broken down in exactly the same way. If the user was actively moving the map at the global scale levels or was on the border of the splitting areas, he could receive and store data on the colors of traffic jams that were useless for him. The preemptive cache allowed to eliminate such usage scenarios, limiting the amount of memory consumed from above.
results
- The memory consumed by the rendering of traffic jams is in the range of 25-50 MB. This figure varies depending on the terrain, the quality of road mapping in OSM, the amount of traffic data.
- Rendering of traffic jams almost does not affect the formation time of the frame on the target set of devices.
- At the most loaded zoom levels, up to 70% of traffic jams are displayed using hardware lines. On a large scale, we try to draw cork with the highest quality.
In this post, we looked at an important, but only external, visible to the user part of a complex system of providing information about traffic jams. In order for our users to receive it, the efforts of the whole MAPS.ME team were required. We worked a lot on minimizing network traffic, routing learned how to build routes taking into account traffic jams, we got the first serious server-side.
I want to remind that the client part of MAPS.ME is an open source product, it is available in GitHub for everyone.
PS We are hiring! We have opened several interesting vacancies in both client and server development. If you are interested in what we do, join us, and together we will make even more cool features.
')
Source: https://habr.com/ru/post/349182/
All Articles