Monitor communication channels via Juniper RPM and Zabbix
This article prompted me to write an article - Automatic switching of a route in Juniper SRX .
I wanted to expand the topic of using RPM a little. This technology is analogous to the SLA mechanism in the Cisco world, and like Cisco, it is no longer intended for switching channels, but for measuring channel characteristics in real time. And the purpose of my article is to show how the results of these measurements can be transferred to the Zabbix monitoring system. I hope this information is useful to someone. Go.
a brief introduction to Juniper RPM
Juniper RPM stands for Realtime Performance Monitoring. RPM works like this:

A device on one side of the channel (Client) periodically sends a series of requests to a device (Server) on the other side of the channel, receives responses (or does not receive) and stores the results
Requests are of the following types:
- HTTP GET request at a target URL
- HTTP GET request for metadata at a target URL
- ICMP echo request to a target address (the default)
- ICMP timestamp request to a target address
- UDP ping packets to a target device
- UDP timestamp requests to a target address
- TCP ping packets to a target device
The first two types of requests are obviously not entirely related to the quality of the channel, but rather to the availability and promptness of the web service.
The last 4 requests are extended and require RPM support from the device with the Server role. In addition to supporting RPM in hardware, an extended license is also required for these tests. In my case, both for the Client role and for the Server role, I use ex2200 switches with the base license and the RPM Server role for advanced tesas I cannot apply.
Therefore, in this article I will limit ICMP echo request. Especially since this is a much more universal scenario. The Server role can be performed by absolutely any network device that can respond to ping.
My test setup is as follows:
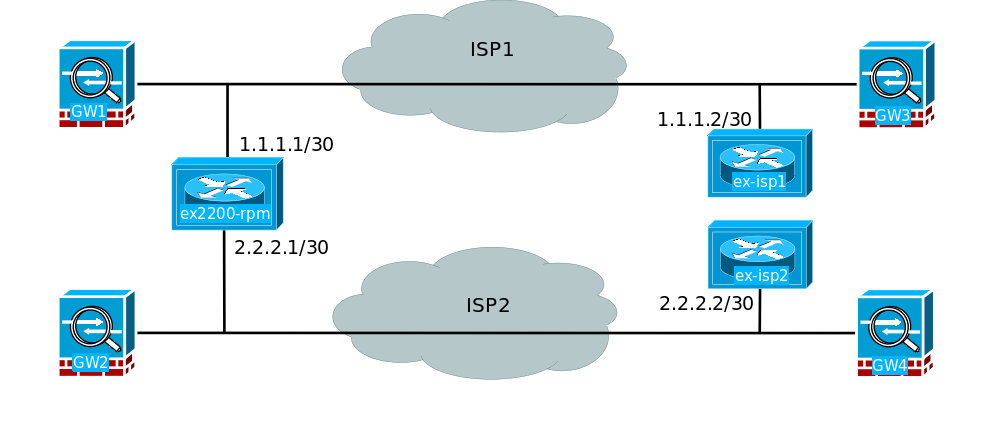
We have two L2 channels between offices from two telecom operators. To both channels we catch our devices from the side. Here, as in the upper picture, the device with the Client role is located on the left. In principle, it was enough to use one device on each side, but it so happened that by the time the test was organized, the ex-isp1 and ex-isp2 devices were already used in this part of the network. They were used, of course, as switches.
Actually with all the scheme. Go to the RPM configuration. On the ex2200-rpm device, we write the following configuration:
iddqd@ex2200-rpm> show configuration services rpm probe Gee { test Jitter { probe-type icmp-ping-timestamp; target address 2.2.2.2; probe-count 15; probe-interval 1; test-interval 15; source-address 2.2.2.1; data-size 1400; thresholds { successive-loss 2; } hardware-timestamp; } } probe BARS { test Jitter { probe-type icmp-ping-timestamp; target address 1.1.1.2; probe-count 15; probe-interval 1; test-interval 15; source-address 1.1.1.1; data-size 1400; thresholds { successive-loss 2; } hardware-timestamp; } } The configuration, as they say, does not require self-explanatory and special explanation.
Make commit and quit and in a minute you can already collect test results.
Owner: Gee, Test: Jitter Target address: 2.2.2.2, Source address: 2.2.2.1, Probe type: icmp-ping-timestamp, Test size: 15 probes Probe results: Response received, Fri Apr 28 10:38:11 2017, Client and server hardware timestamps Rtt: 4908 usec, Round trip jitter: -232 usec, Round trip interarrival jitter: 1257 usec Results over current test: Probes sent: 7, Probes received: 7, Loss percentage: 0.000000 Measurement: Round trip time Samples: 7, Minimum: 1921 usec, Maximum: 5243 usec, Average: 3355 usec, Peak to peak: 3322 usec, Stddev: 1514 usec, Sum: 23486 usec Measurement: Positive round trip jitter Samples: 3, Minimum: 262 usec, Maximum: 3322 usec, Average: 2179 usec, Peak to peak: 3060 usec, Stddev: 1364 usec, Sum: 6536 usec Measurement: Negative round trip jitter Samples: 4, Minimum: 232 usec, Maximum: 3179 usec, Average: 1682 usec, Peak to peak: 2947 usec, Stddev: 1448 usec, Sum: 6728 usec Results over last test: Probes sent: 15, Probes received: 15, Loss percentage: 0.000000 Test completed on Fri Apr 28 10:37:50 2017 Measurement: Round trip time Samples: 15, Minimum: 1882 usec, Maximum: 5099 usec, Average: 2502 usec, Peak to peak: 3217 usec, Stddev: 864 usec, Sum: 37535 usec Measurement: Positive round trip jitter Samples: 7, Minimum: 39 usec, Maximum: 3175 usec, Average: 1000 usec, Peak to peak: 3136 usec, Stddev: 979 usec, Sum: 7000 usec Measurement: Negative round trip jitter Samples: 8, Minimum: 26 usec, Maximum: 1444 usec, Average: 476 usec, Peak to peak: 1418 usec, Stddev: 494 usec, Sum: 3809 usec Results over all tests: Probes sent: 124282, Probes received: 124282, Loss percentage: 0.000000 Measurement: Round trip time Samples: 124282, Minimum: 1548 usec, Maximum: 208183 usec, Average: 2964 usec, Peak to peak: 206635 usec, Stddev: 2148 usec, Sum: 368337928 usec Measurement: Ingress delay Samples: 101, Minimum: 1000 usec, Maximum: 6000 usec, Average: 2030 usec, Peak to peak: 5000 usec, Stddev: 1438 usec, Sum: 205000 usec Measurement: Egress delay Samples: 77, Minimum: 1000 usec, Maximum: 6000 usec, Average: 1883 usec, Peak to peak: 5000 usec, Stddev: 980 usec, Sum: 145000 usec Measurement: Positive round trip jitter Samples: 62713, Minimum: 0 usec, Maximum: 205349 usec, Average: 1152 usec, Peak to peak: 205349 usec, Stddev: 1866 usec, Sum: 72214061 usec Measurement: Negative round trip jitter Samples: 61568, Minimum: 1 usec, Maximum: 174369 usec, Average: 1173 usec, Peak to peak: 174368 usec, Stddev: 1645 usec, Sum: 72211519 usec Owner: BARS, Test: Jitter Target address: 1.1.1.2, Source address: 1.1.1.1, Probe type: icmp-ping-timestamp, Test size: 15 probes Probe results: Response received, Fri Apr 28 10:38:08 2017, Client and server hardware timestamps Rtt: 2695 usec, Round trip jitter: -109 usec, Round trip interarrival jitter: 1178 usec Results over current test: Probes sent: 15, Probes received: 15, Loss percentage: 0.000000 Measurement: Round trip time Samples: 15, Minimum: 1654 usec, Maximum: 5020 usec, Average: 2630 usec, Peak to peak: 3366 usec, Stddev: 1105 usec, Sum: 39452 usec Measurement: Positive round trip jitter Samples: 6, Minimum: 20 usec, Maximum: 3079 usec, Average: 1504 usec, Peak to peak: 3059 usec, Stddev: 918 usec, Sum: 9021 usec Measurement: Negative round trip jitter Samples: 9, Minimum: 23 usec, Maximum: 3143 usec, Average: 1186 usec, Peak to peak: 3120 usec, Stddev: 1235 usec, Sum: 10671 usec Results over last test: Probes sent: 15, Probes received: 15, Loss percentage: 0.000000 Test completed on Fri Apr 28 10:38:08 2017 Measurement: Round trip time Samples: 15, Minimum: 1654 usec, Maximum: 5020 usec, Average: 2630 usec, Peak to peak: 3366 usec, Stddev: 1105 usec, Sum: 39452 usec Measurement: Positive round trip jitter Samples: 6, Minimum: 20 usec, Maximum: 3079 usec, Average: 1504 usec, Peak to peak: 3059 usec, Stddev: 918 usec, Sum: 9021 usec Measurement: Negative round trip jitter Samples: 9, Minimum: 23 usec, Maximum: 3143 usec, Average: 1186 usec, Peak to peak: 3120 usec, Stddev: 1235 usec, Sum: 10671 usec Results over all tests: Probes sent: 82380, Probes received: 7769, Loss percentage: 90.569313 Measurement: Round trip time Samples: 7769, Minimum: 1483 usec, Maximum: 10135 usec, Average: 2589 usec, Peak to peak: 8652 usec, Stddev: 1147 usec, Sum: 20110188 usec Measurement: Ingress delay Samples: 3, Minimum: 3000 usec, Maximum: 3000 usec, Average: 3000 usec, Peak to peak: 0 usec, Stddev: 0 usec, Sum: 9000 usec Measurement: Egress delay Samples: 8, Minimum: 1000 usec, Maximum: 4000 usec, Average: 1750 usec, Peak to peak: 3000 usec, Stddev: 1090 usec, Sum: 14000 usec Measurement: Positive round trip jitter Samples: 3936, Minimum: 0 usec, Maximum: 8426 usec, Average: 1048 usec, Peak to peak: 8426 usec, Stddev: 1091 usec, Sum: 4125122 usec Measurement: Negative round trip jitter Samples: 3832, Minimum: 1 usec, Maximum: 8409 usec, Average: 1076 usec, Peak to peak: 8408 usec, Stddev: 1123 usec, Sum: 4124713 usec That's all about RPM. Moving on. And for the disclosure of the topic will send a detailed guide from Juniper
Configure Zabbix to monitor RPM tests
Unfortunately, JunOS MIBs for RPM objects are not built in the most convenient way.
The built-in SNMP LLD Discovery functionality in Zabbix is not enough to auto-detect RPM tests
Zabbix uses the snmpwalk method to auto-detect . Where as return parameters are used SNMP indexes and their values
For example, when searching for an ifDescr object
$ snmpwalk -v 2c -c public 192.168.1.1 IF-MIB :: ifDescr
IF-MIB :: ifDescr.4 = STRING: WAN
IF-MIB :: ifDescr.7 = STRING: LAN1
IF-MIB :: ifDescr.11 = STRING: LAN2
the discovery method in Zabbix will detect indices 4,7,11 and their values WAN, LAN1 and LAN2
But for the detection of RPM tests, Juniper did not provide such a convenient object.
The most suitable object that I was able to detect is the jnxRpmResSampleValue object .
And this is how the table returned by this object looks like:
iddqd@ex2200-rpm> show snmp mib walk jnxRpmResSampleValue jnxRpmResSampleValue.3.71.101.101.6.74.105.116.116.101.114.1 = 1989 jnxRpmResSampleValue.3.71.101.101.6.74.105.116.116.101.114.2 = -424 jnxRpmResSampleValue.3.71.101.101.6.74.105.116.116.101.114.3 = 810 jnxRpmResSampleValue.4.66.65.82.83.6.74.105.116.116.101.114.1 = 3352 jnxRpmResSampleValue.4.66.65.82.83.6.74.105.116.116.101.114.2 = 1612 jnxRpmResSampleValue.4.66.65.82.83.6.74.105.116.116.101.114.3 = 971 Let us examine what this mix of numbers and points means.
jnxRpmResSampleValue is the MIB object we are walking on
A bunch of numbers .3.66.101.101.6.74.105.116.116.101.114 is the name of our test
You can easily verify this by running the previous command with the ascii parameter.
iddqd@ex2200-rpm> show snmp mib walk jnxRpmResSampleValue ascii jnxRpmResSampleValue."Gee"."Jitter".1 = 1989 jnxRpmResSampleValue."Gee"."Jitter".2 = -424 jnxRpmResSampleValue."Gee"."Jitter".3 = 810 jnxRpmResSampleValue."BARS"."Jitter".1 = 3352 jnxRpmResSampleValue."BARS"."Jitter".2 = 1612 jnxRpmResSampleValue."BARS"."Jitter".3 = 971 Well, the SNMP index (the last number after the point) is the serial number of test parameters:
.1 - RTT
.2 - Round trip jitter
.3 - Round trip interarrival jitter
iddqd@ex2200-rpm> show services rpm probe-results | match RTT Rtt: 1989 usec, Round trip jitter: -424 usec, Round trip interarrival jitter: 810 usec Rtt: 3352 usec, Round trip jitter: 1612 usec, Round trip interarrival jitter: 971 usec By the way, to find out the OID (i.e. numerical value) of MIB objects in JunOS such as jnxRpmResSampleValue, jnxRpmResultsSampleTable, jnxRpmHistorySummaryTable yes
and any others, you can run the command:
show snmp mib walk jnxRpmResSampleValue | display json
Autodiscover Script
So, without external help, Zabbix cannot detect RPM tests.
So we will provide such assistance in the form of an external script.
The script is written in Python 2.7 and is very compact.
#!/usr/bin/python import sys from pysnmp.hlapi import * import json def findsubstrings(s): la = s.split('.') lb = la[1:] if '6' in lb: # looking for a delimiter. 6 for EX or 10 for SRX i = lb.index('6') elif '10' in lb: i = lb.index('10') else: sys.stderr.write("delimiter nor 6 ot 10") exit(0) l1 = lb[:i] l2 = lb[i+1:] param2 = ''.join([chr(int(i)) for i in l1]) param3 = ''.join([chr(int(i)) for i in l2]) return param2, param3 eRR = '{ data: ["Error parsing arguments"]}\n' if len(sys.argv)!=3: sys.stderr.write(eRR) exit() hostname = sys.argv[1] community=sys.argv[2] jnxRpmResSumSent = "1.3.6.1.4.1.2636.3.50.1.2.1.2" l = [] # init snmpwalk over jnxRpmResSumSent MIB Object varBind = nextCmd(SnmpEngine(), CommunityData(community), UdpTransportTarget((hostname, 161)), ContextData(), ObjectType(ObjectIdentity(jnxRpmResSumSent)), lexicographicMode=False) # do snmmpwalk and collect an rpm specific substring for res in varBind: s = str(res[3][0][0])[len(jnxRpmResSumSent)+1:-2] l.append(s) # lets make values inside the list l uniq u = set(l) jsonData=[] for param1 in u: d={} param2, param3 = findsubstrings(param1) d["{#RPMUUID}"] = param1 d["{#RPMOWNER}"] = param2 d["{#RPMTEST}"] = param3 jsonData.append(d) print (json.dumps({"data": jsonData}, indent=4)) uses only one external library - pysnmp
The library is popular and present in most distributions.
in Ubuntu, you can install it with the command: apt install python-pysnmp4
or in any distribution through the PIP manager with the command: pip install pysnmp
At the input of the script served 2 parameters hostname and community
And JSON is returned in this form
{ "data": [ { "{#RPMTEST}": "Jitter", "{#RPMUUID}": "4.66.65.82.83.6.74.105.116.116.101.114", "{#RPMOWNER}": "BARS" }, { "{#RPMTEST}": "Jitter", "{#RPMUUID}": "3.71.101.101.6.74.105.116.116.101.114", "{#RPMOWNER}": "Gee" } ] } User macros {#RPMUUID} , {#RPMOWNER} and {#RPMTEST} are further used in element names, their keys, triggers and even graphs
The script needs to be made chmod + x and placed in the directory for external Zabbix scripts
In my case, this is the directory: / etc / zabbix / etc / externalscripts
Template
Further I will not tell how to configure Zabbix . And just share the working pattern (link below). The template includes 3 elements: RTT, Jitter and PacketLoss , for each RPM test, which it detects using a script
If the RPM type of the test does not imply a Jitter measurement, then this parameter is simply automatically excluded from monitoring.
For more advanced tests, the pattern can be customized at will. However, the script will not require changes.
All 3 elements are scaled and displayed on one graph, which is also automatically created.
Total
After tightening the template on a Juniper device running RPM tests, after a while we will see such a picture in the data elements (items)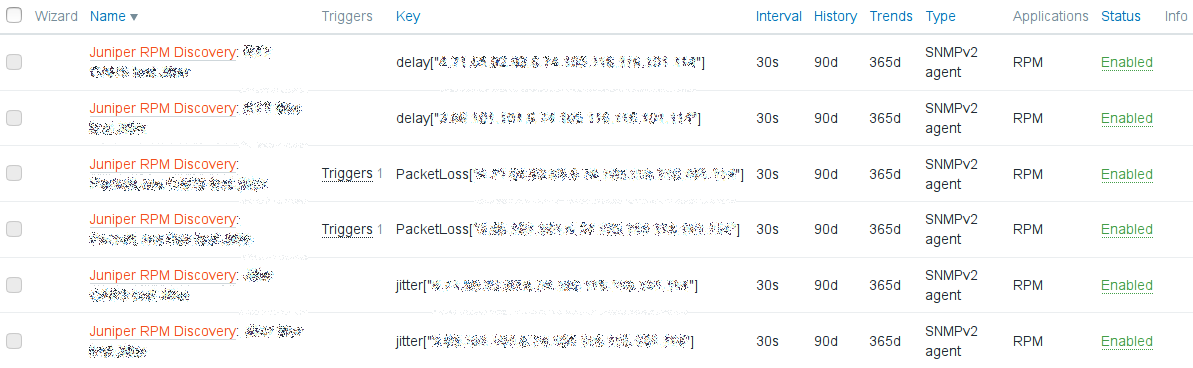
And something like this would look like a graph:
That's all. script and template posted on gitHub . It is possible, if desired, to refine, forate, etc. without restrictions.
')
Source: https://habr.com/ru/post/349128/
All Articles