From satellite images to graphs (the competition of the SpaceNet Road Detector) - hit the top 10 and code (translation)
Hi, Habr! I present you the translation of the article .
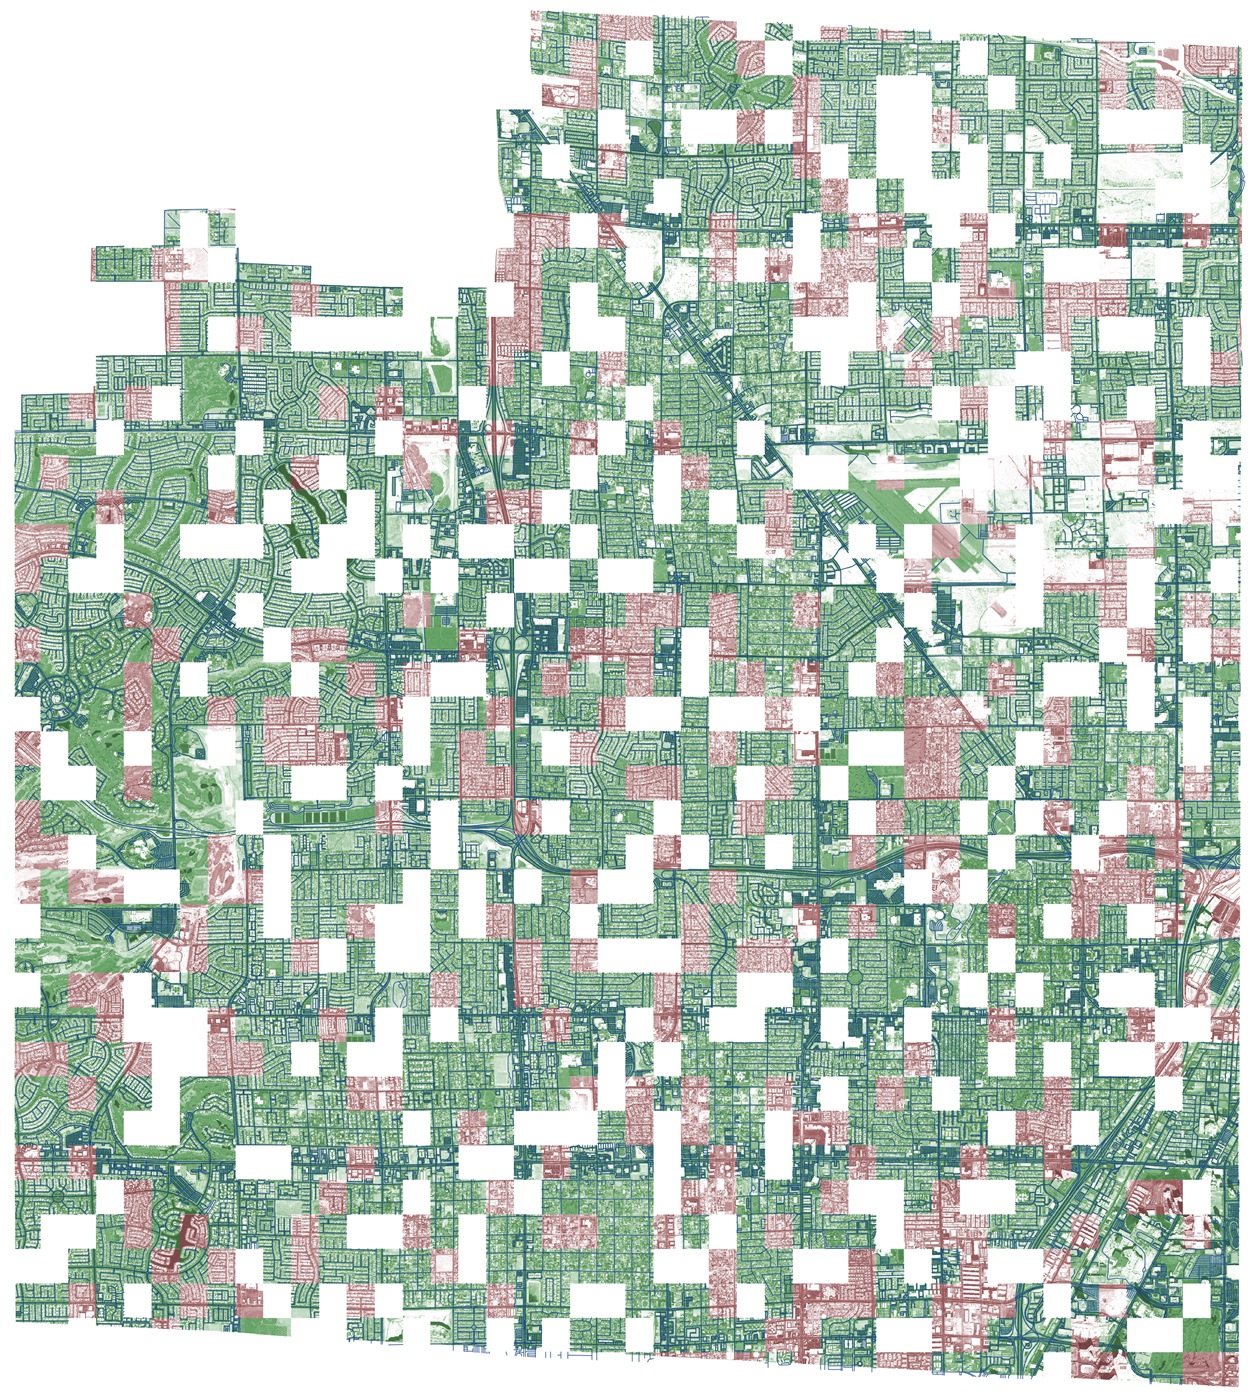
This is a Vegas with the markup provided, a test dataset, and probably white squares are deferred validation (privat). Looks cool. True, this panorama is the best of all four cities, so it was because of the data, but more on that below.
0. TLDR
Link to the competition and a detailed description .

We finished preliminary on the 9th place , but the position may change after additional testing of submitters by the organizers.
I also spent some time writing good, readable code on PyTorch and data generators. It can be used without shyness for your own purposes (just put a plus sign). The code is as simple and modular as possible, plus read on about best practices for semantic segmentation.
In addition, it is possible that we will write a post about understanding and analyzing the Skeleton Network , which all the finalists in the top competition used to convert the image mask into a graph.
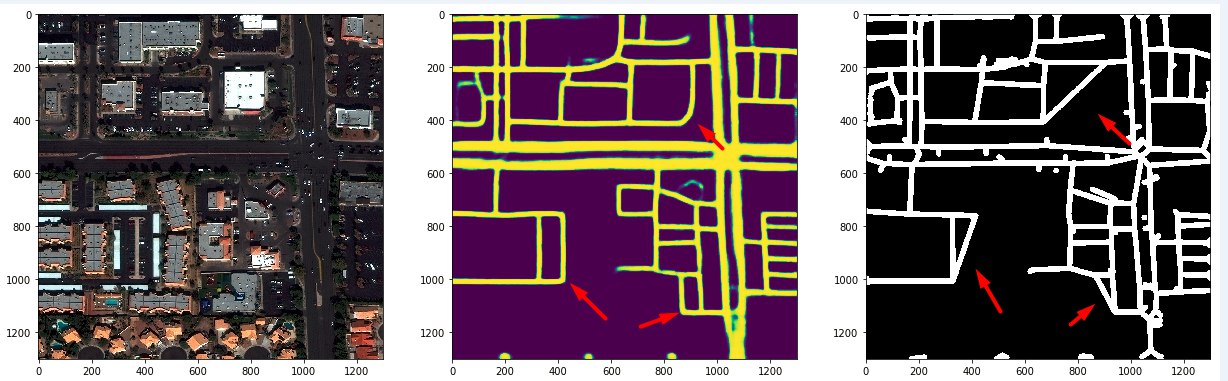
The essence of the competition in 1 picture
1. Competition
As you may know from my past entries, we sometimes participate in competitions ( 1 and 2 ) and have a specific set of criteria for choosing such competitions - firstly, a decent level of competition (usually well-drawn contest on the pin attracts hordes of stackers and are not very difficult ), secondly, our common interest in the topic, and thirdly, the challenge.
In this competition were all the criteria:
- Hard challenge and a high probability that the ods.ai team will be a worthwhile opponent (they participated in 3-4 satellite competitions in 2017).
- The competition required not only to construct a suitable semantic segmentation of the image, but also to construct a graph of the predicted masks. This gave rise to an intricate and interesting metric (post about it once , twice , turnips ). People who tried the repository code told me that the Python code somehow disagreed with them on the leaderboard, so everyone eventually used their tool for visualization, written in Java.
- An interesting area is satellite images with abundant information, approximately 4000 HD images from 4 cities in different channels (mostly we had highbrow highs, 8 channel MUL images, pan-sharpened MUL images and regular RGB).
- Interesting data (graphs, geojson, satellite images) and a new area to search (TLDR - you can use skimage and rasterio - all other libraries from the list provided by the hosts are HORRIBLE ). It also turned out that skimage works well with 16-bit images, tiff and other strange formats.
- I cannot understand whether this is good or bad, but the TopCoder platform requires participants to have a high level of professionalism (all your decisions need to be verified, which is very boring for me, not because I don’t like docker, but in fact because so we also wrote unit tests for them). But the platform itself is just awful, and the quality of the code provided by them seemed to me to say the least debatable. It annoyed me a lot - after you spent a lot of time on the actual solution of the problem, they ask you to spend even more time on packaging this solution when the very description of the competition and the code are very hard to read.
- Kaggle is a bunch of stackers, and mostly business oriented tasks, at least in 2017.
- TopCoder - sometimes very interesting and challenging niche tasks, but in general the platform is scary and the requirements for participants are high.
- DrivenData is the smallest, but the best. Interesting areas, excellent organizers who do their job and do not require too much from you.
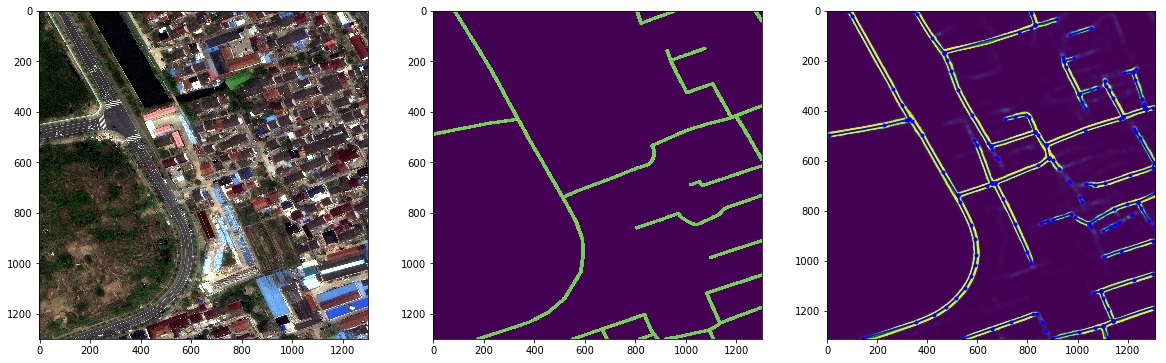
2. Quickly about the initial data analysis and interesting boundary cases.


It can be seen that the land and asphalt do not actually have sharp peaks on the reflectivity graph. So I spent some time testing a combination of different channels.
You can see the input data in the image above, but there are a couple of interesting points and noteworthy marginal cases that explain what actually happens.

Histogram of the original 16-bit images
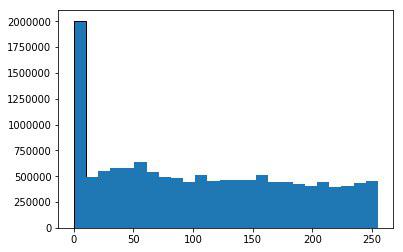
8-bit histogram, some information was lost
Asphalt roads versus unpaved

An example of asphalt roads together with unsightly plus intersections

Combination of lanes - notice a few 12 lane roads - at border checkpoints, I suppose

Typical layout in Paris is not very good.
3. Useful reading
Here is a list of the best materials on the topic that I learned during the competition.
- Post Tinkoff on habre with basic information about satellite imagery
- Information about the channels of satellite images and pan sharpening
- There is only one relevant paper in this area.
- Relevant work on semantic image segmentation:
- Turnip tulza on transfer mask image in the graph - sknw
- Amazon Jungle competiton . Any details and experience. 1 , 2 , 3 .
- Featured Times Two .
- Removing fog: paper and a pair of repositories. time. two. (they work, but slowly)
- Semantic Segmentation Architectures Implemented in PyTorch
- Materials from the competition Carvana competition :
To summarize all the architectures and experiments, something like this will come out:
- UNET + Imagenet is not bad, but LinkNet is better (2 times faster and easier with a small loss of accuracy);
- Transfer learning is required and leads to a better result;
- Skeleton Network is the best tool to turn a mask into a graph, but it requires some tweaking;
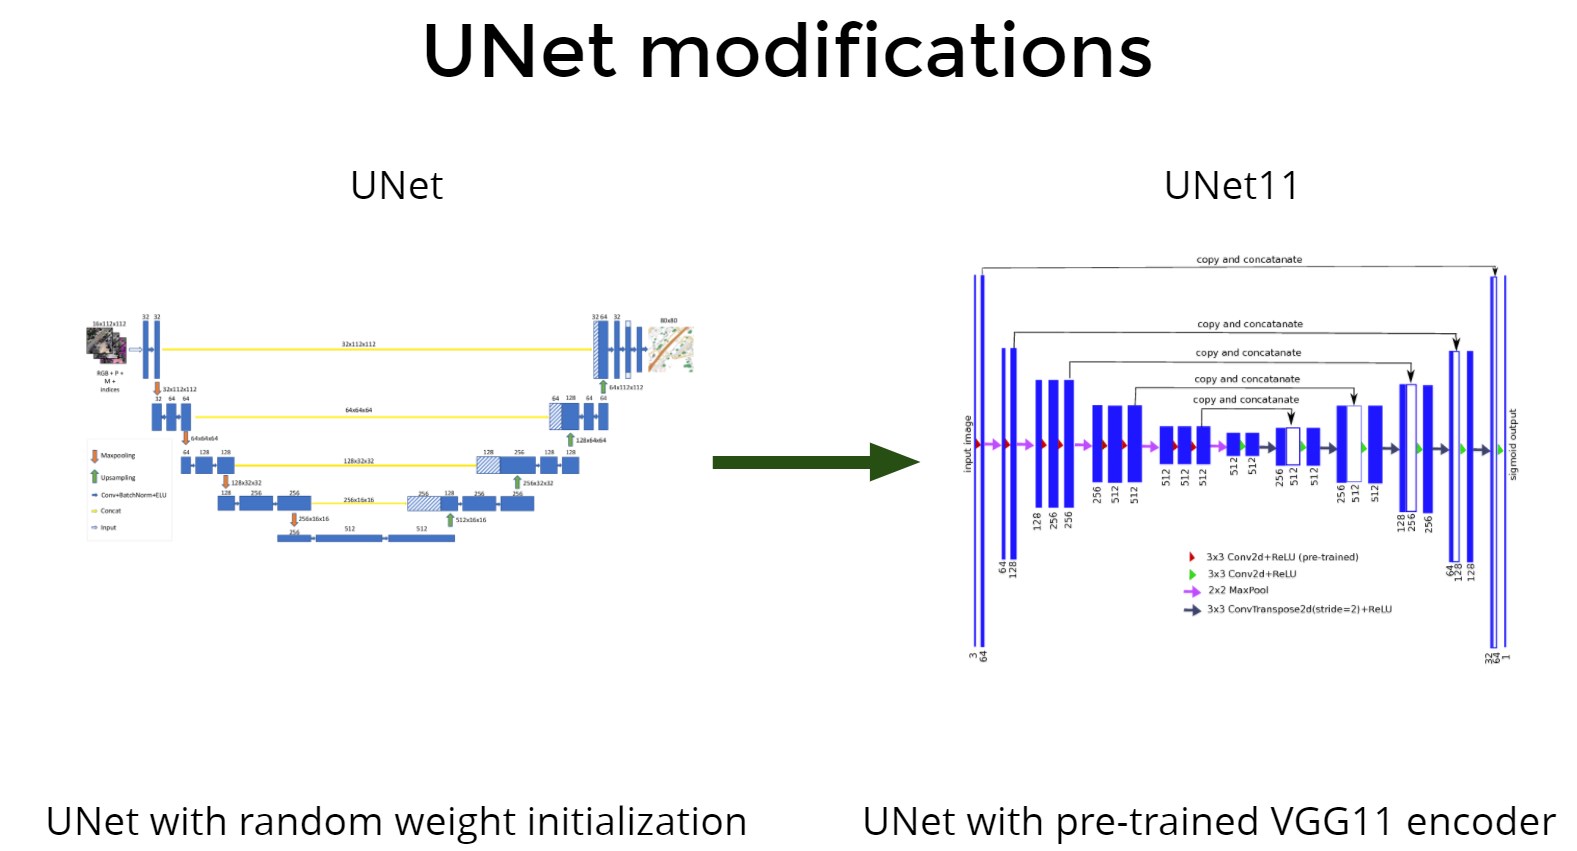
Unet + transfer learning
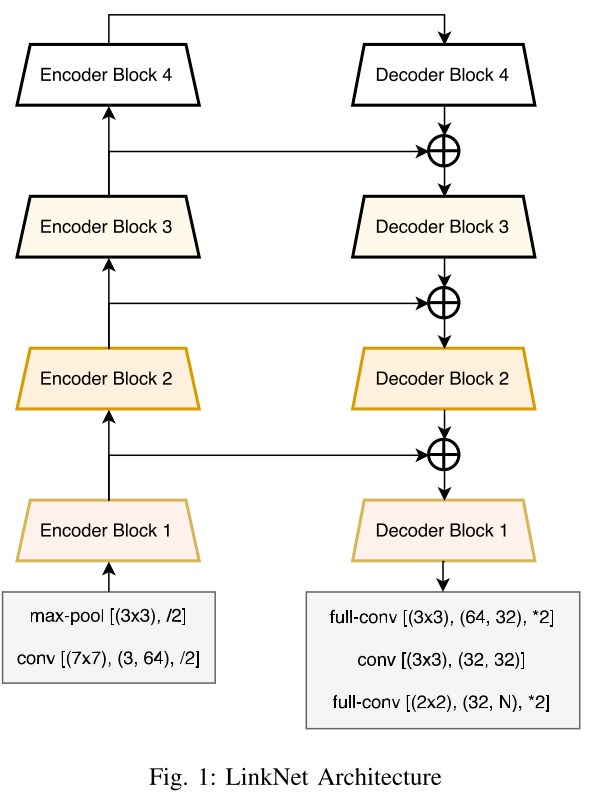
LinkNet
Some scientists still use MSE ...
4. Initial versions of architectures and kosyachny cases
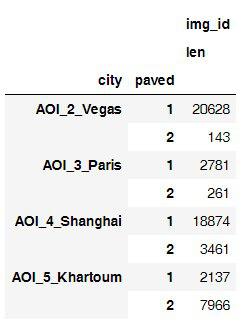
The points on the leaderboard started from 0 to almost 900k for approximately 900 test images, each image was assigned 0 - 1. The final metric was considered as the average between cities, which was not very good, as Paris lowered the speed down very significantly.
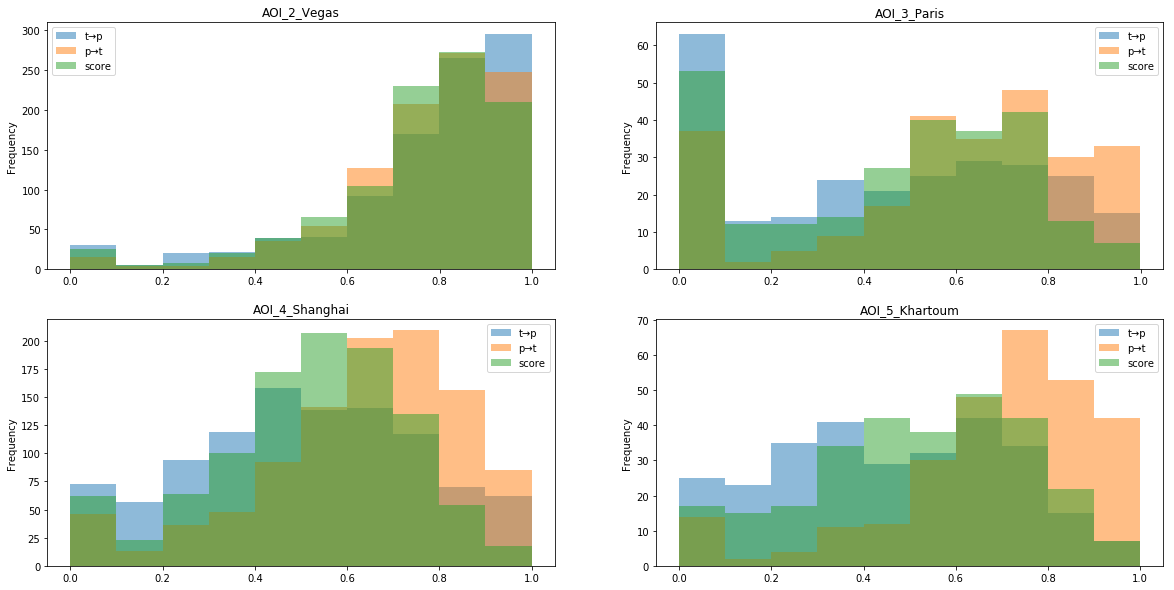
Distribution of scores for tiles for some of the most effective models. In Paris, a lot of vegetation and suburban tiles with poor markings that affect the speed. In addition, Shanghai and Khartoum have higher discrepancies between the tp and pt estimates, that is, it is much easier for the model to make sure that all the edges of the graph are true, but it is much more difficult to find ALL the edges of the graph that exist in nature
I tried a lot of ideas and architectures, and to my surprise, the simplest and most naive model worked best of all, or at least as good as the others (all other participants also used it with variations).
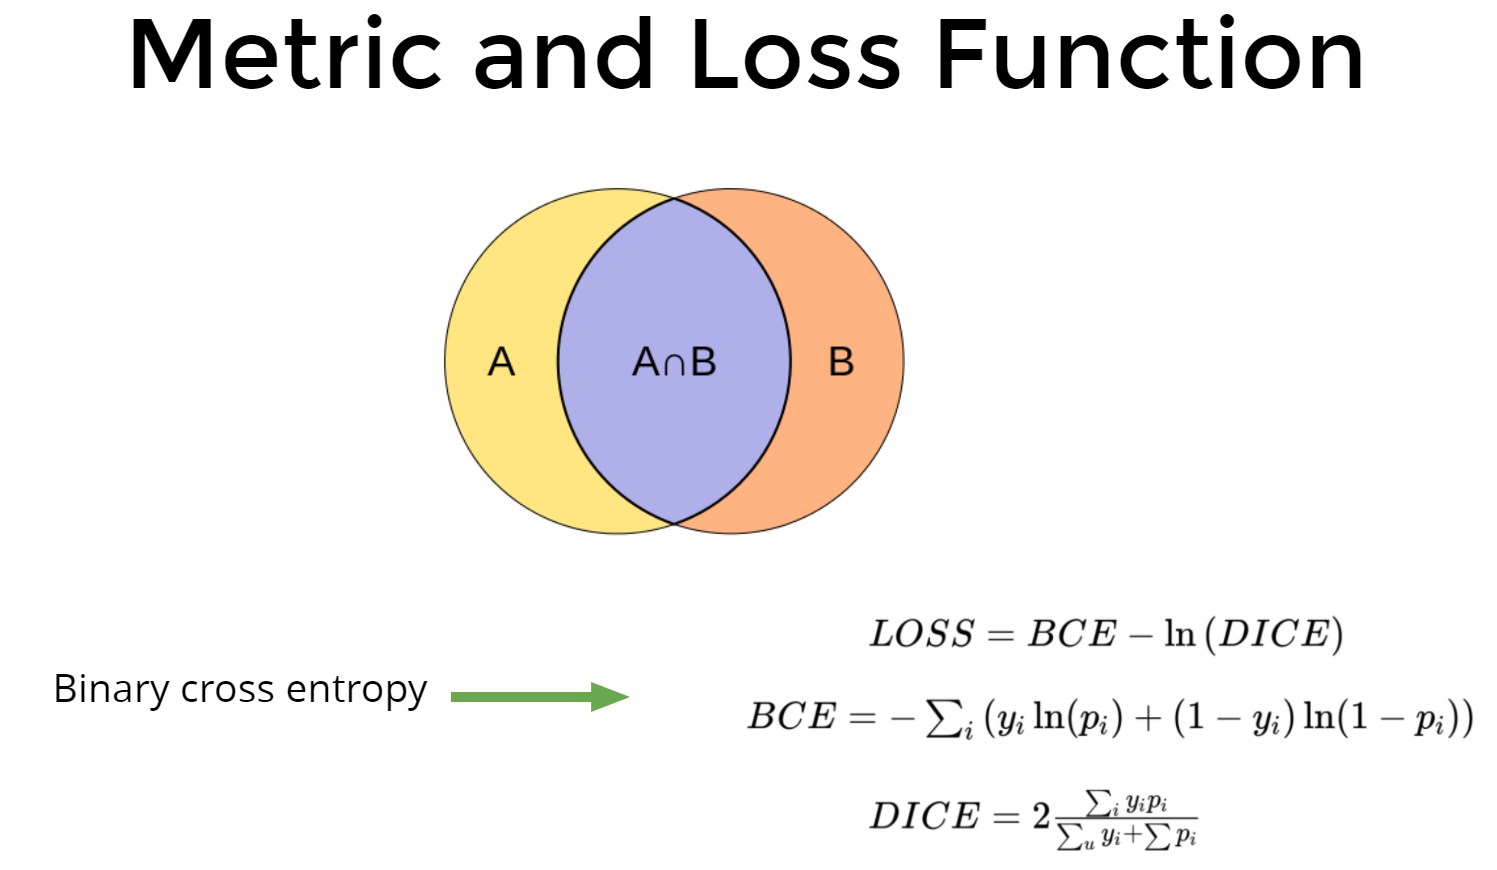
Loss function
- BCE + DICE / BCE + 1 - DICE - proved to be more or less the same.
- Clipping loss functions here proved to be terrible
- N BCE + DICE, BCE + N DICE - did not work in my case. Then the colleagues from the chat suggested that it is necessary to monitor not DICE, but hard DICE (in fact, the percentage of guessing pixels) and it goes well 4 * BCE + DICE, taking into account the fact that you need to take the best era on hard DICE;
CNN
- LinkNet34 (Resnet34 + Decoder) - was the best in speed and accuracy;
- Linknet50, LinkNext101 (ResNeXt + LinkNet), VGG11-Resnet - all showed themselves the same, but required 2-4 times more resources;
- All encoders were pre-trained on ImageNet, essno;
- For the 8-channel grid, I just replaced the first layer, but it behaved more or less like the 3-channel grid (but ate more CPU resources);
Treatment
- Mask binarization;
- I did an ablation analysis of all reasonable combinations of channels - the best were vegetation, rgb, 8 channels, urban (see what they corresponded to in the /src/presets.py code) - but the difference was minimal (3-5%);
- Naturally HD images performed better;
- 8 and 16-bit images also showed themselves to be more or less the same;
- Image normalization - Imagenet’s average and standard deviation extraction yielded a + 2-3% decrease in loss function, but there wasn’t much difference on the leaderboard;
Masks
- Mask from apls turnips. 10% of masks were not created, because the organizers code did not contain error handling and there were no roads. At first I didn’t sweat or include them in the training session, but then probably it was my mistake, although I couldn’t check it out normally;
- Just loading lines into skimage and finishing about 10% of empty images gave a reduction in loss, but the effect on the final result was unclear;
- The same thing was given the masks, where the width of the road corresponded to its real width - like the loss converges better, but the graphs are no better. Probably hard DICE would solve this problem;
- Models for unpaved roads worked much worse because of poor data;
- Multilayer masks also did not work (1 layer for intersections, 1 layer for dirt roads, 1 layer for asphalt roads);
Metamodel
Siamese networks also did not work to refine the predictions of models on "wide" and "narrow" masks. What is interesting is that the predictions of models with “wide” masks looked much better, but the graphs turned out worse.
Pipelines
- 3 or 8 channel images showed themselves to be more or less the same;
- Turns by 90 degrees, horizontal and vertical coups, small affine transformations reduced the loss by another 15-20%;
- My best model was at full resolution, but the random 800x800 crop worked out well too;
Ensemble
3x fold + 4x TTA did not give any gain in my case.
Still any ideas that apparently gave a boost to my competitors LB
- LinkNet34 (LinkNet + Resnet) => Inception encoder - + 20-30k (I wanted to try Inception Resnet, but after a series of failures I despaired and did not try);
- On the train - training at full resolution. In inference: downsize => predict => upsize => ensemble - + 10-20k;
- Post processing of graphs and bringing them to the edges of tiles - + 20-30k;
- RGB images (as opposed to MUL) - + 10-15k due to the fact that the original data were inconsistent;
- 4 BCE + 1 DICE, monitoring hard DICE as a metric - + 10-30k.
The main cant. No one has solved this problem, as far as I know. Wide masks would probably decide - but the graphs from them were not very good.
The main reason why wide masks kosyachat - they produce polyps and octopuses =)
Same problem
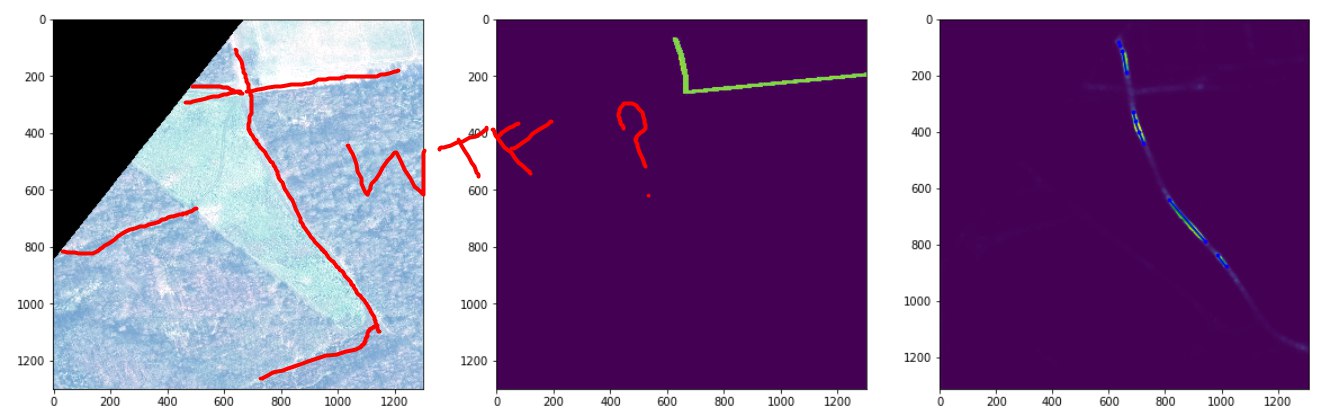
Paris is a bad markup. Forest areas - also kosyachny case
Multi-level roads - predicting a wide versus narrow model
The model came up with the road over the parking =)
Sometimes PyTorch was buggy and gave birth to such artifacts.
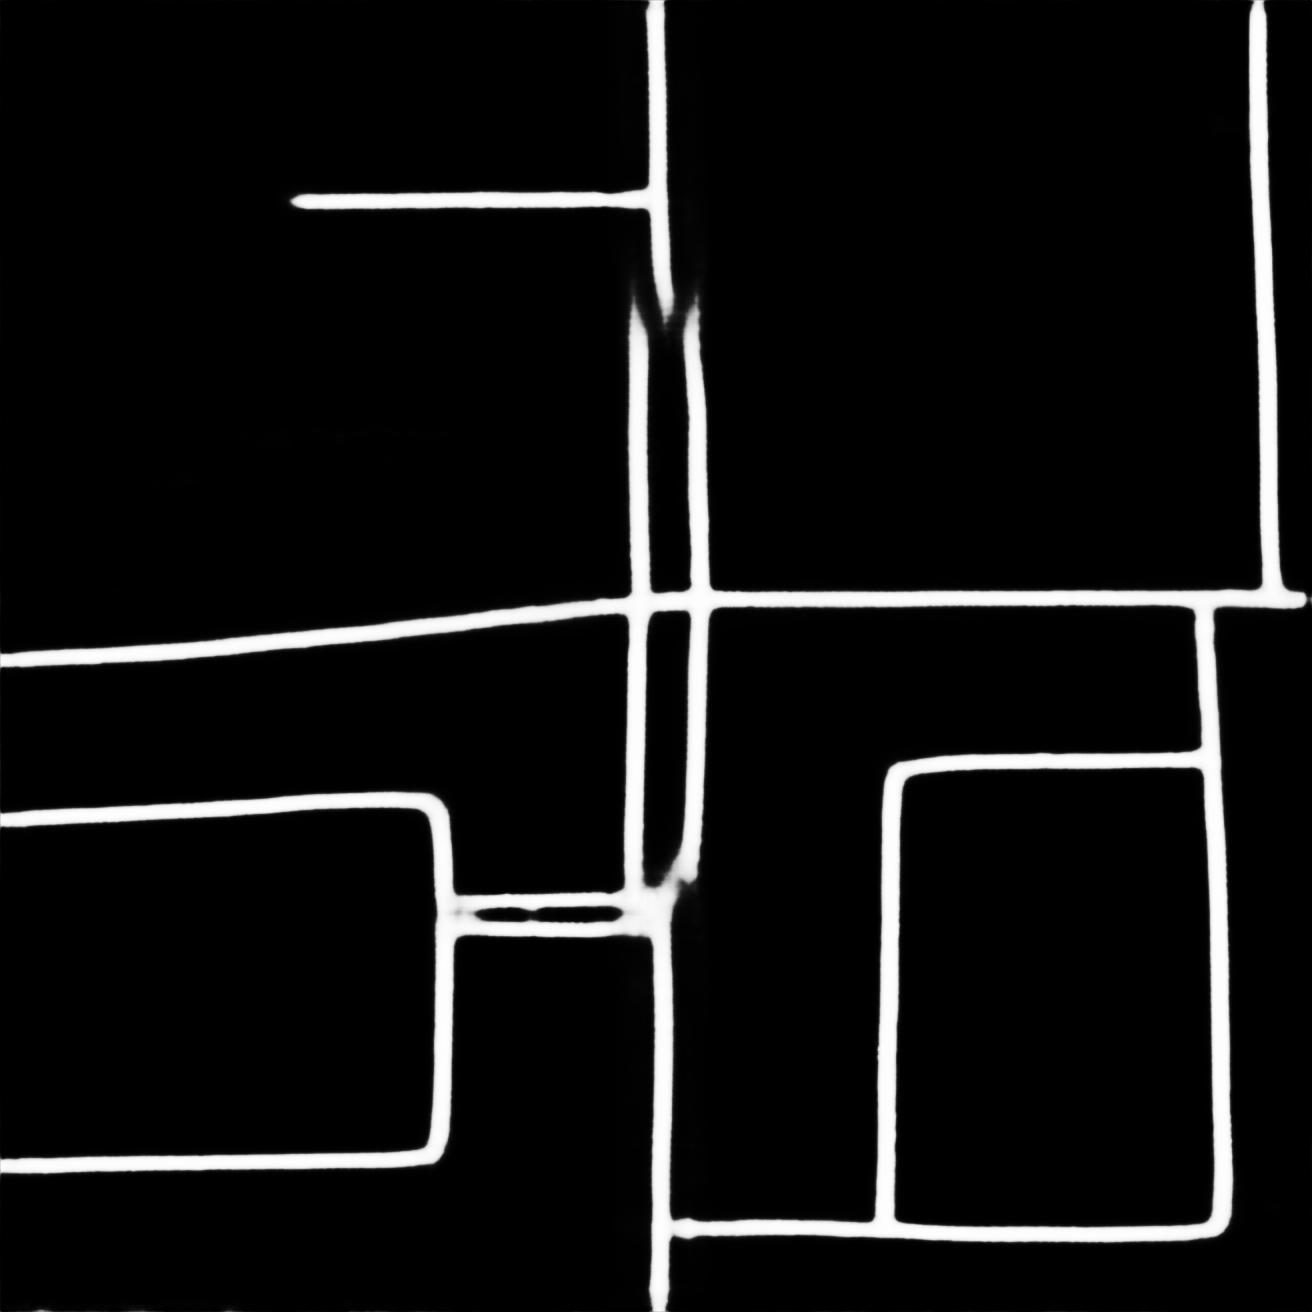
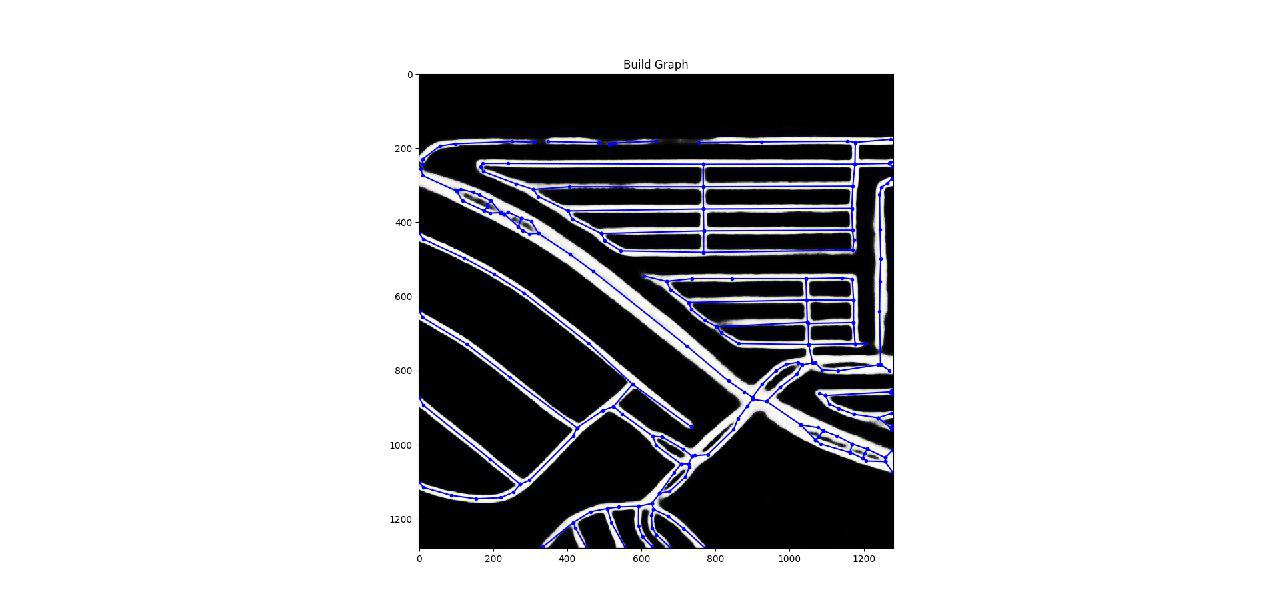
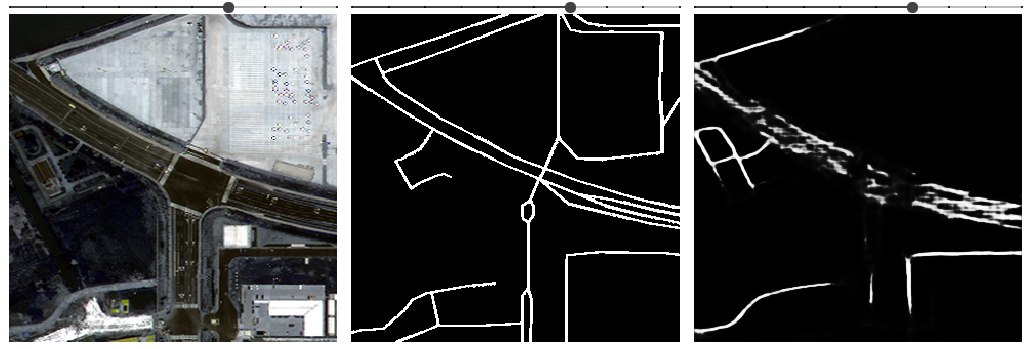
5. Construction of graphs and basic kosyachny cases
The key ingredient is Skeleton Network + add graph edges for curved roads (thanks to Dmytro for his advice!). One thing is likely to guarantee that you will be in the top 10.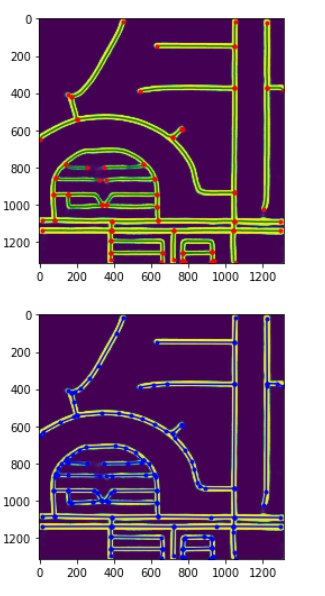
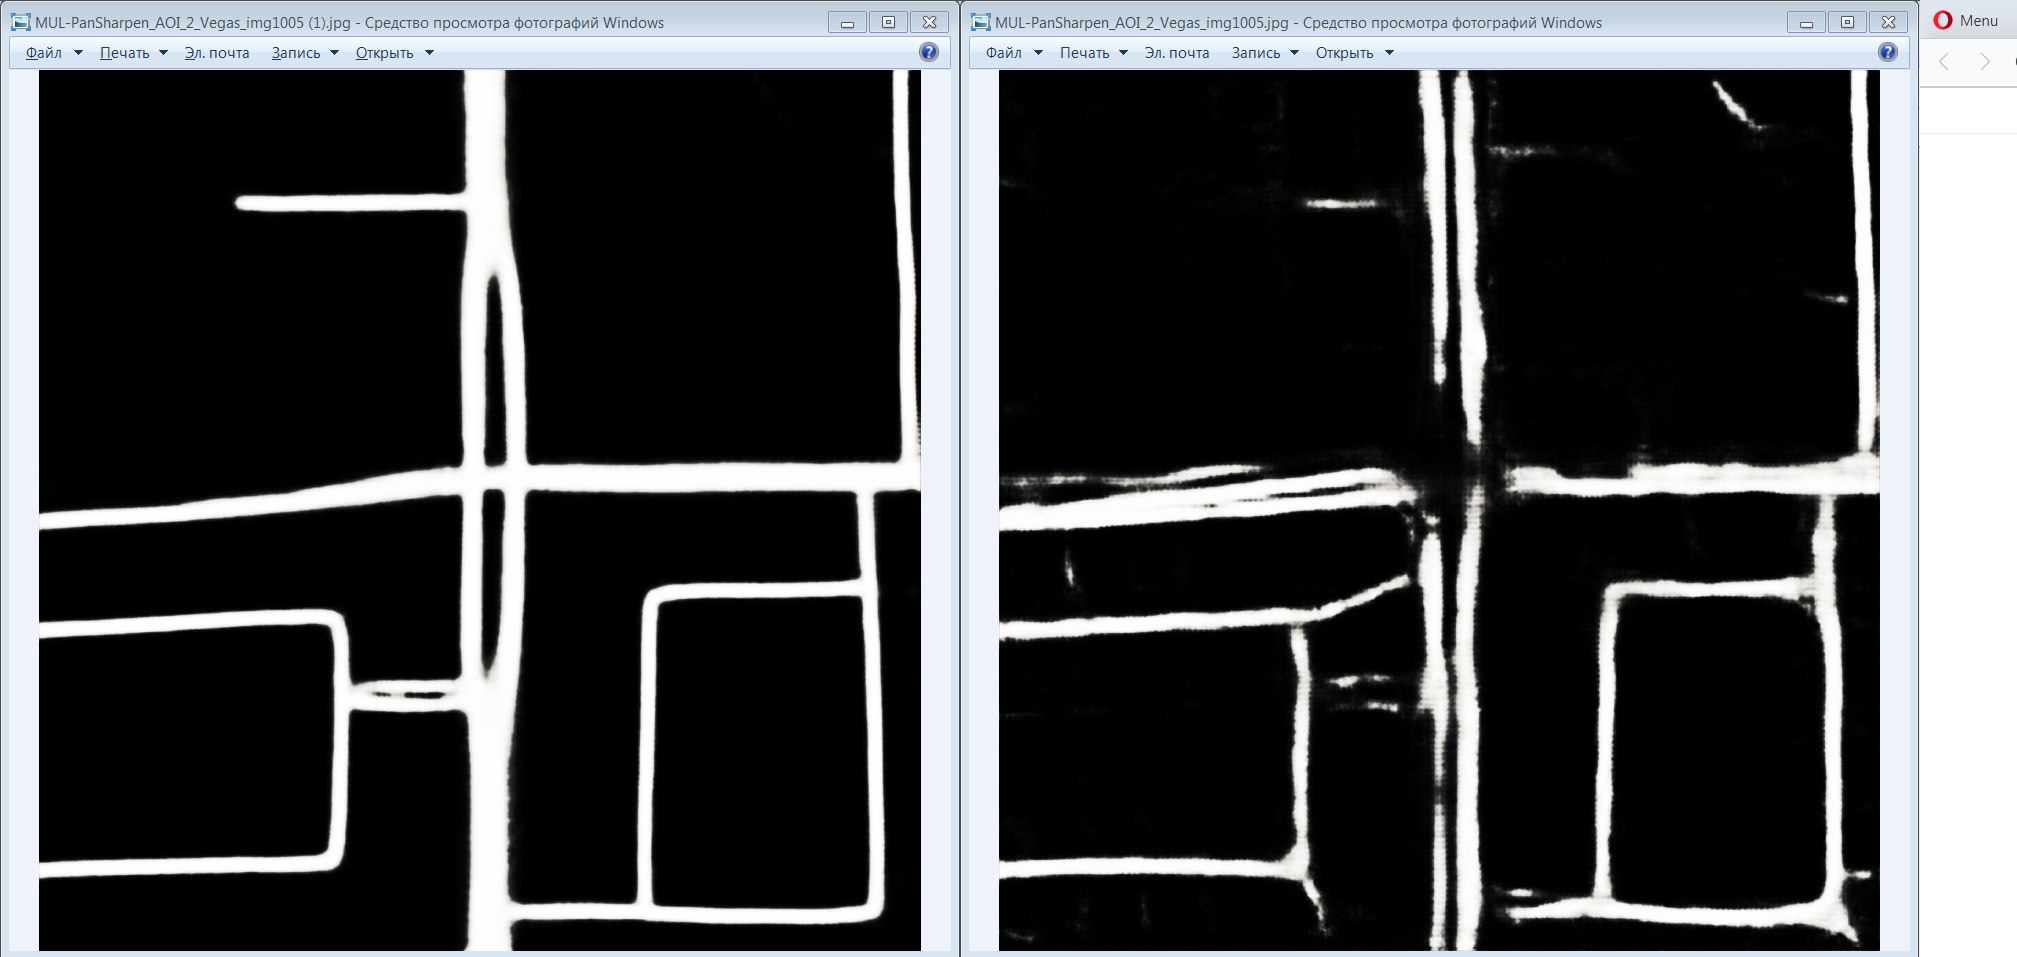
Without these steps, all the masks looked like this.
Alternative Pipelines I Have Tried
- Skeletonization + corner detection from skimage
- Some variation of the dilation from here.
- All this produced some kind of edge, but the Skeleton Network is still much better.
Additional things that sometimes helped other members
- Dilation of both pre and post processing;
- Bring the edges of the graph to the edges of the cells;
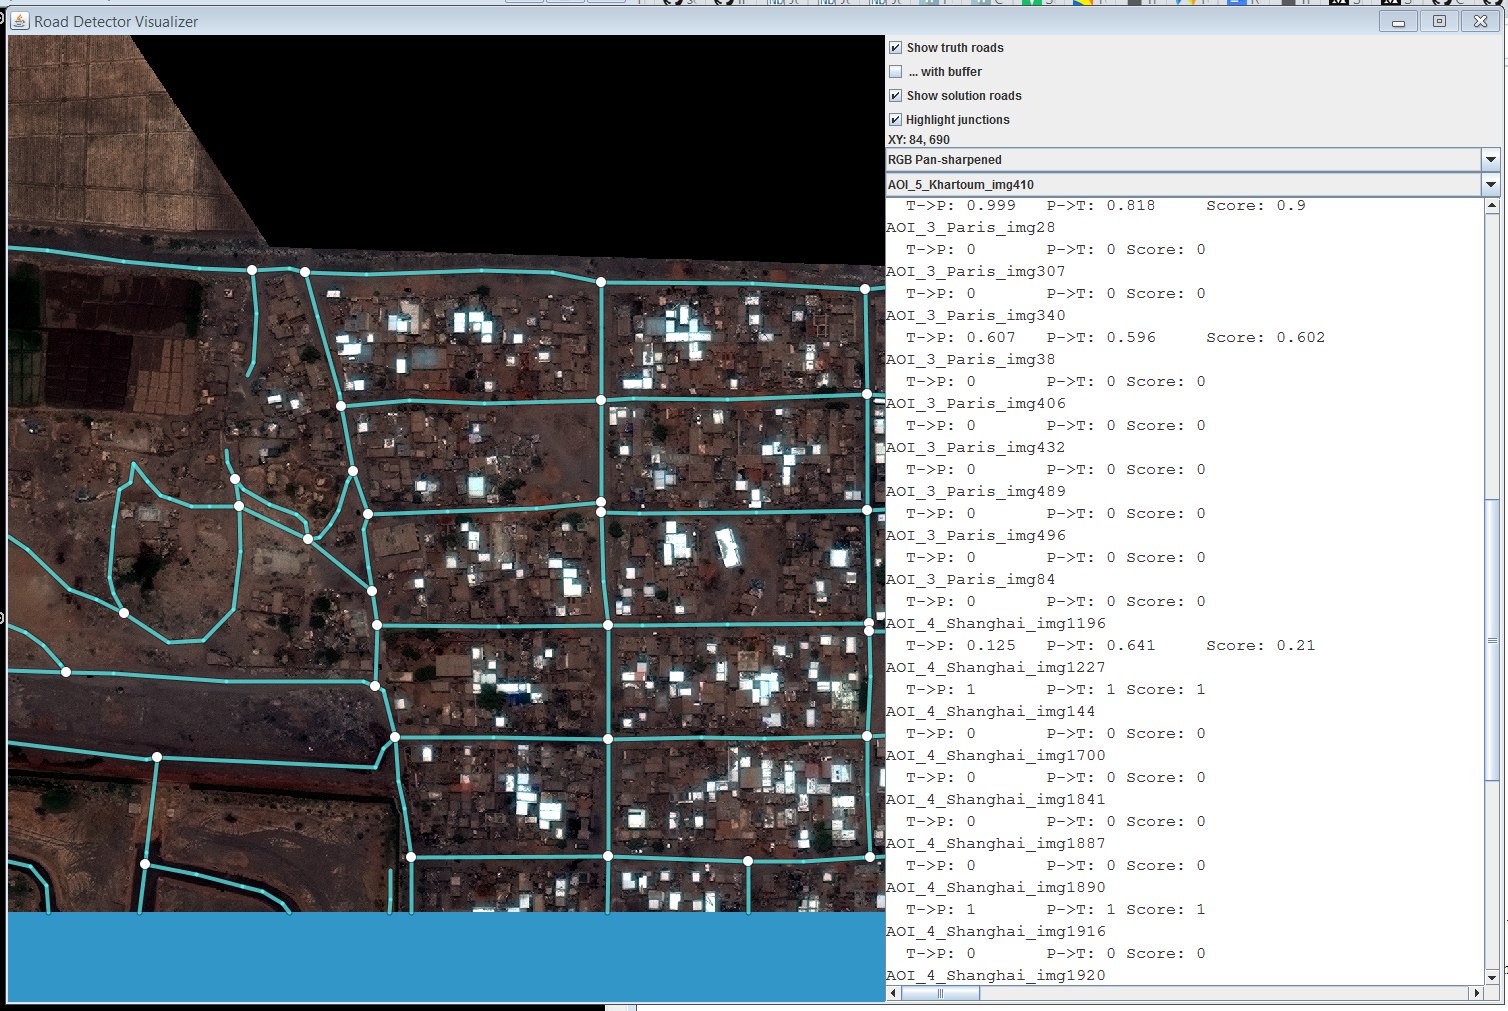
Tools for visualization from orgov
6. The final decision

Essentially a replacement for TLDR
7. Beautiful visualization - tiles for all cities gathered together
Following the tradition of the last competition, one person from the chat made full-size pictures of the city from geo-cells using geodata from tif images.
View them in high resolution by clicking on them.
Vegas
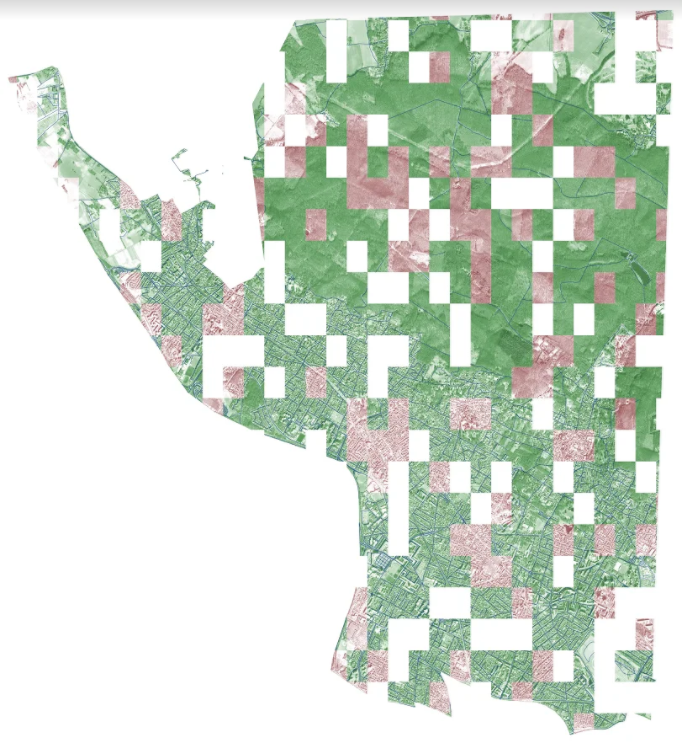
Paris

Shanghai
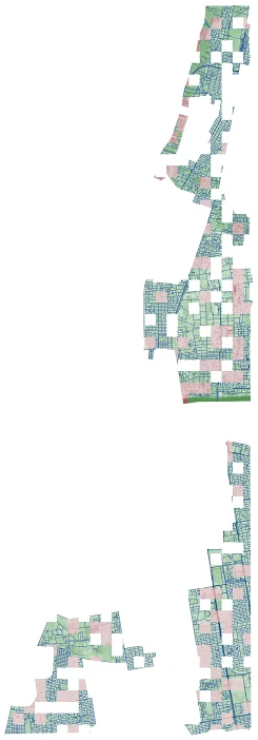
Khartoum
- Competition site
- Skeleton Network - mask to graph conversion library
- SpaceNet Road Detection and Routing Challenge - a long post about competition metrics
- Part II - the second part about metrics
- https://github.com/CosmiQ/apls - repository for metric evaluation
- Pan Sharpening Images . - Rose G.
- Earth satellite - habr
- Road Extraction by Deep Residual U-Net . - Zhengxin Zhang, Qingjie Liu, Yunhong Wang
- Focal Loss for Dense Object Detection . - Tsung-Yi Lin, Priya Goyal, Ross Girshick, Kaiming He, Piotr Dollár
- LinkNet: Exploiting Encoder Representations for Efficient Semantic Segmentation . - Abhishek Chaurasia, Eugenio Culurciello
- Kaggle: an analysis of the Amazon terrain from satellite images - habr
- Dust Satellite Imagery Competition, 1st Place Winner's Interview: Kyle Lee
- Planet: Understanding the Amazon from Space, 1st Place Winner's Interview
- Winner's Interview: 2nd Place, Nima Shahbazi, Chahhou Mohamed, Two Sigma Financial Modeling Challenge
- Two Sigma Financial Modeling Code Competition, 5th Place Winners' Interview: Team Best Fitting | Bestfitting, Zero, & CircleCircle
- Single Image Haze Removal Using Dark Channel Prior . - Kaiming He, Jian Sun, Xiaoou Tang
- Fully Convolutional Networks over the years
')
Source: https://habr.com/ru/post/349068/
All Articles