Debug Embox on STM32
Good day! Due to the fact that people are asking how to load Embox on STM32-based debugging boards, we decided to release this recipe. It can be considered as an addition to the article .
The description will be for the STM32F7-Discovery debug board, but in general it is also true for the other STM32 series (along the way, clarifications will be given for STM32F4).
The first thing to do is to slope Embox
git clone https://github.com/embox/embox.git embox and read about add. packages on our wiki . Probably not all of them are required for a particular template, but keep in mind that it is better to install them immediately.
')
Next, you need a cross-compiler for arm-a and OpenOCD for flashing and debugging.
Go to the directory c Embox.
Assembly:
make confload-arm/stm32f7cubeconfig -make confload-arm/stm32f7cube(ormake confload-arm/stm32f4cubefor F4)- Putting it up with
make(ormake -j4, etc.)
Running OpenOCD (better in a separate console):
sudo openocd -f OPENOCD_PATH/tcl/board/stm32f7discovery.cfg(respectively stm32f4discovery.cfg for F4)
Connection via minicom (better in a separate console):
sudo minicom -D /dev/ttyACM0
Yes, for F7, this is quite simple, since its com port, usb host and debugger are on the same USB. Therefore, we inserted a mini-usb, and that's it. For F4, a special wire for the COM port and an extension for the debug board are used . But the principle remains the same.
Download image (preferably in a separate console):
arm-none-eabi-gdb build/base/bin/embox
In the debugger console, execute the following commands:
target extended-remote :3333monitor reset haltload
Naturally, since this is gdb, all commands are valid there. You can walk in steps and breakpoints, watch the values of variables, set a watchpoint, and so on.
After switching to minicom, we should see that Embox loaded, and the command line appeared:
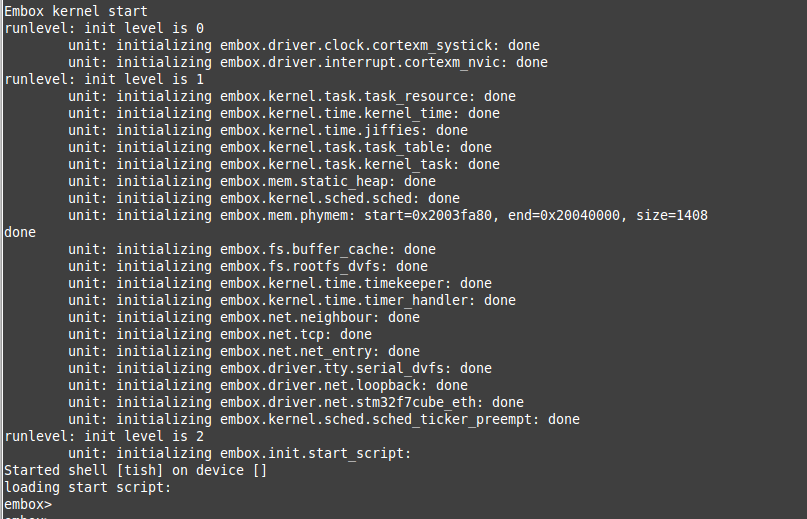
Well that's all done!
Debugging from Eclipse
I will add a little about debugging from the popular IDE Eclipse.
All of the above remains in force, only instead of console gdb we will use graphical Eclipse.
We will need to install a plugin that allows you to debug on the hardware, it is assumed that eclipse-cdt is already installed.
The process of installing the plugin is standard. In the menu, select Help -> Install New Software
And there we add a repository, here is the list:
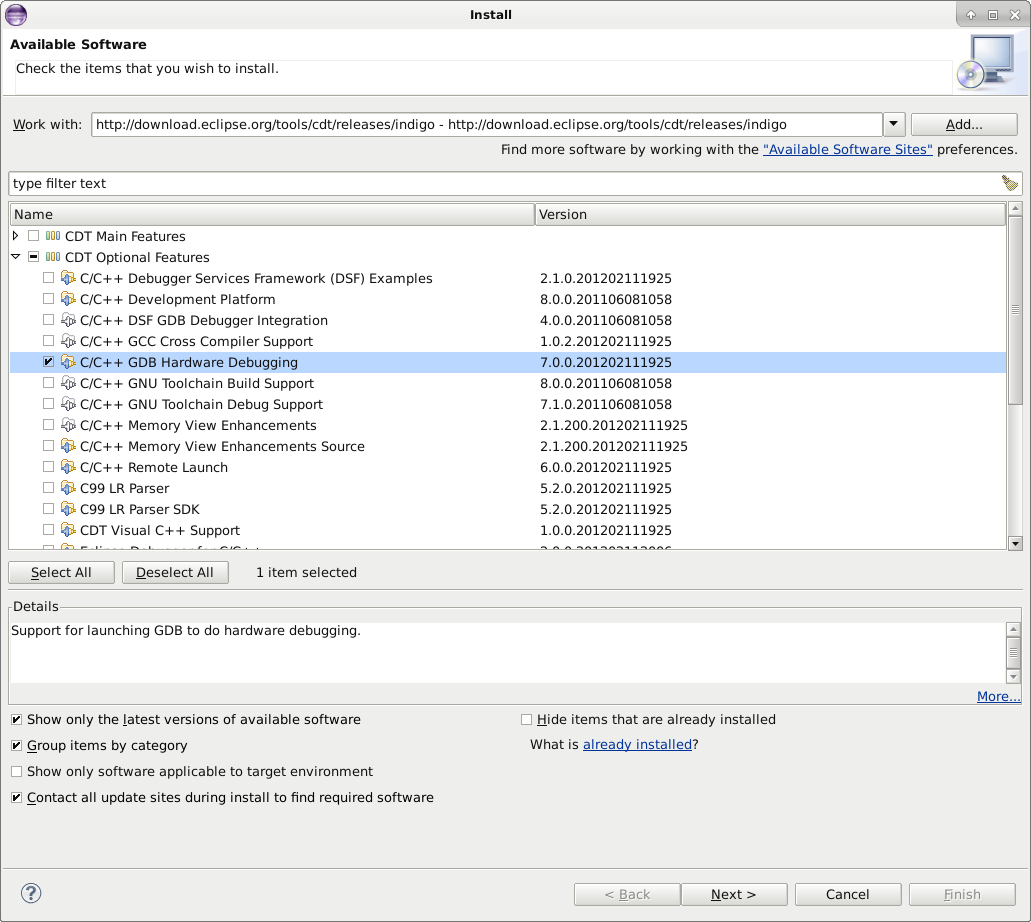
Next, select the item GDB Optional Features -> GDB Hardware Debugging
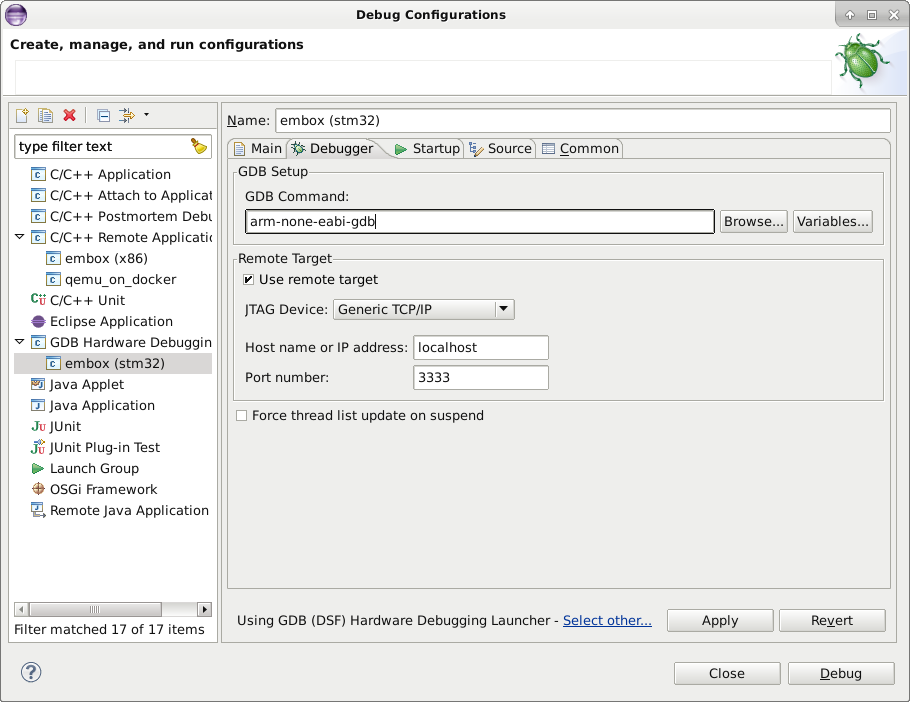
Next, create a configuration for debugging Run -> Debug Configurations . Select the image that will be debugged.
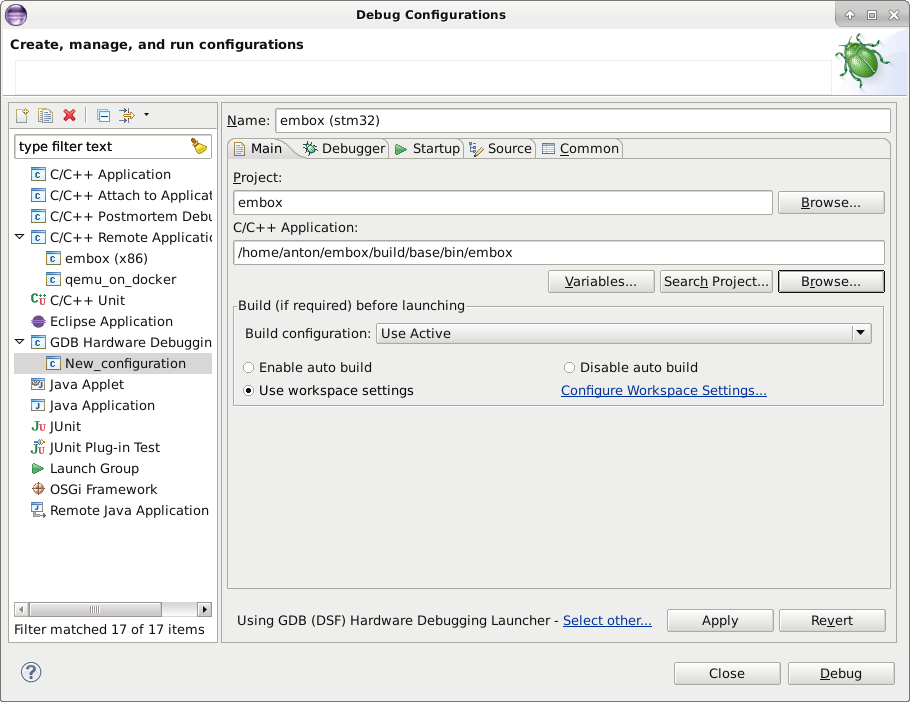
Debugger options.
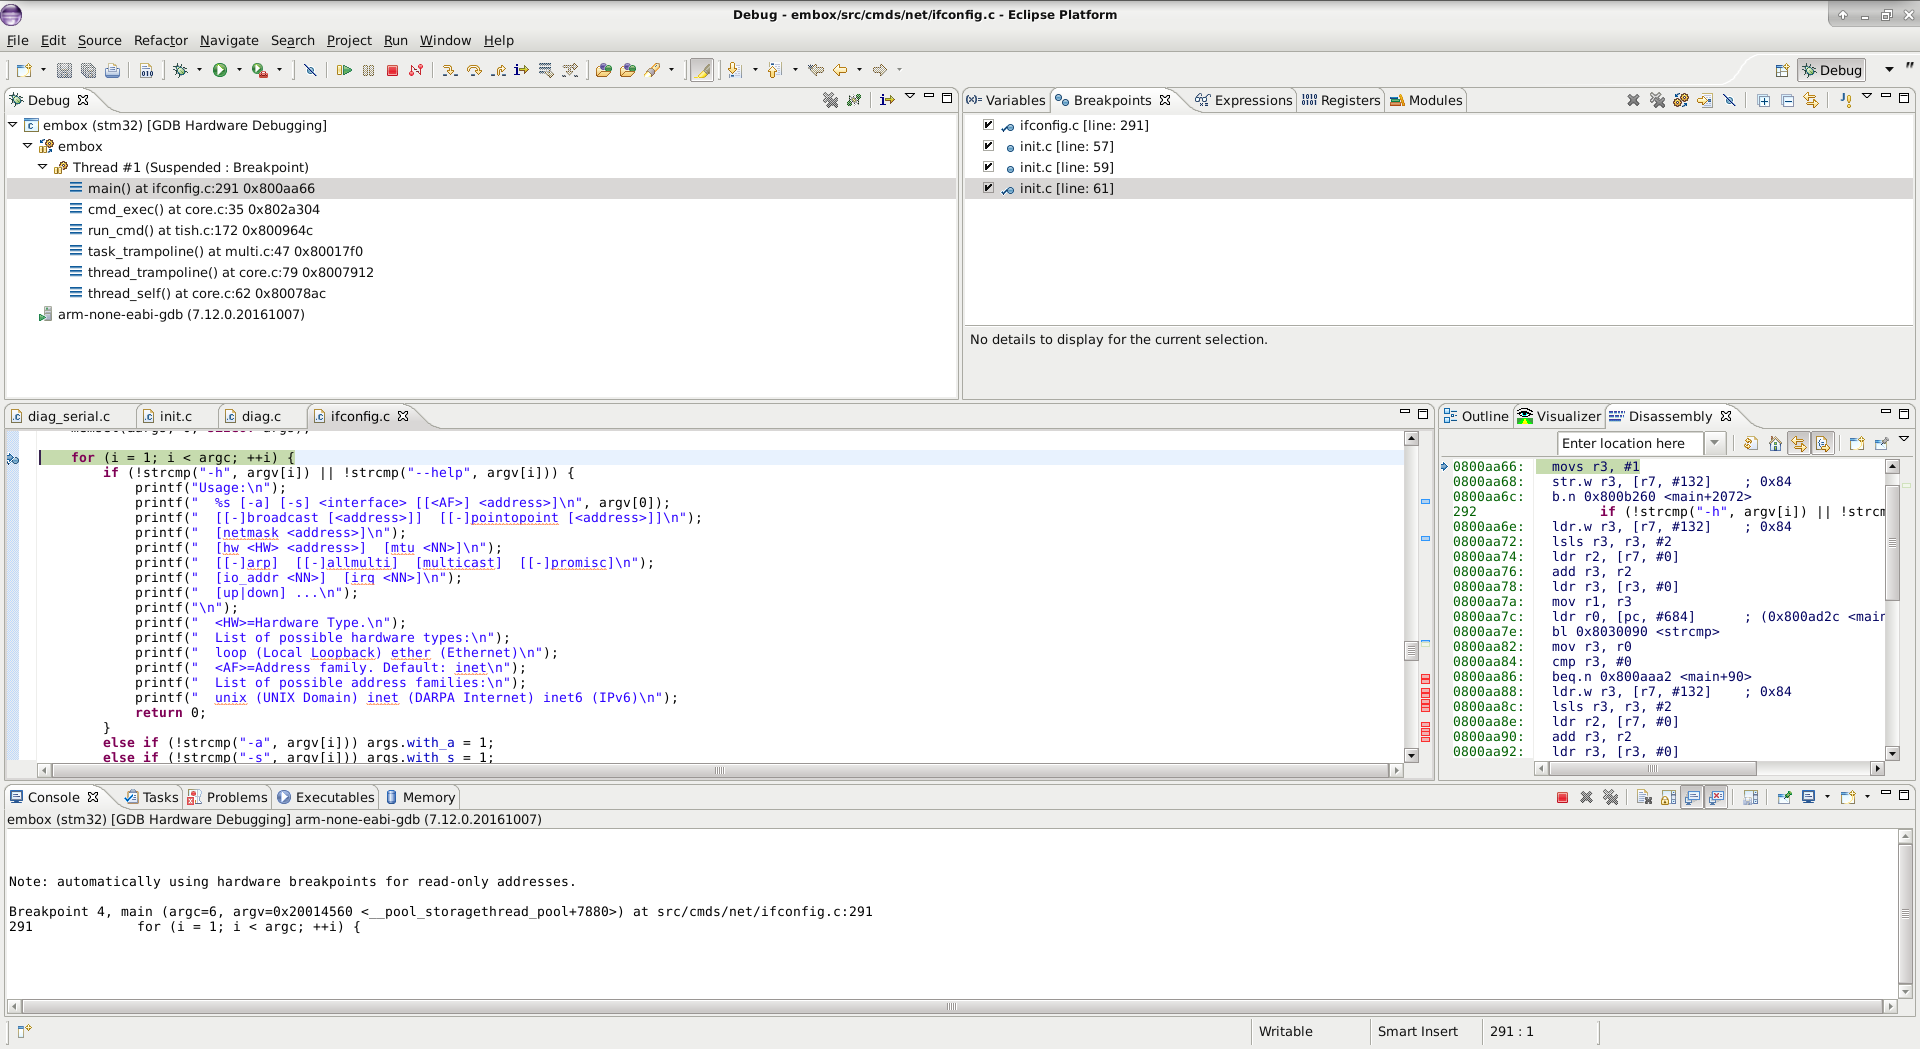
Actually everything, now you can run and walk through breakpoints.
We partially have this information on our wiki page .
That's all for successful debugging.
Source: https://habr.com/ru/post/349034/
All Articles