Fast and secure JVM application monitoring with BPF magic
We all met with complex production errors that are difficult to catch using conventional monitoring tools. BPF is a Linux kernel technology that allows you to do fast and secure dynamic debugging directly on a running running system without having to prepare for it in advance. The JVM itself has many monitoring points for tracking garbage collection, object allocation, JNI calls, even method calls — all without the need for additional instrumentation. When these monitoring points are not enough, the Linux kernel and various libraries can track system calls, network packets, scheduler events, time spent accessing the disk, and even database requests.
In this session, we did a textual transcript of the Sasha Goldshtein report on how BPF tools can be used to monitor JVM applications on GNU / Linux, and performance checklists using classic tools such as fileslower , opens , op , and strace - but all this with using non-invasive, fast and safe BPF technology.
After the kata there will be a lot of pictures with slides. Caution traffic! Pictures as tight as you can, but no more. They are all really needed.
Today we will talk about monitoring through some new and most advanced tools for Linux. My name is Sasha Goldstein and I do a lot of things related to .NET for Microsoft. For several years I have been working on monitoring and tracing tools for Linux, and, in general, my work over the past twelve years or so has been related to performance. It turns out that the same Linux tools that are used to monitor applications in C ++ (I do this quite often), under Python (I do this sometimes), can be used to monitor, improve performance, trace, and solve important problems of Java applications under Linux . Some things that I do are also useful to Java developers.
The report will focus on expert Linux trace tools and how they can be used in Java applications. This means that I will show you only the tip of the iceberg, these are system-level tools that can be used with other languages and environments. So if you sometimes have to debug or profile applications written not only in Java, these tools will be useful to you, unlike many Java-profilers that can only work with Java code, and they do not support C ++ or Python.
During the report, I will highlight four main points that I hope will be useful to you. First, you will learn exactly which traceable tools you can use with JVM applications. About this I will tell quite a bit. Secondly, and this will be one of the key topics, it will be about BPF (this is a system-level technology), and how much it can change a lot in modern tracing tools for Linux, since it allows what it was extremely difficult to achieve before in production under linux. Thirdly, I will demonstrate a sort of checklist of performance assessment tools, with which you can easily and quickly obtain some preliminary data. Finally, I will show examples of narrowly focused research that solves certain problems with the help of more complex and sophisticated tools.
If you sometimes use something other than Linux during deployment, on other systems there are analogues to these tools. Under Windows, some of the things I will talk about can be done by ETW . Under FreeBSD and MacOS, you can use DTrace ; BPF is DTrace for Linux, even though they don’t like to call it that.
Now I will give you a general picture of the Linux trace tools as a graph.

The horizontal axis is the degree of detail, i.e., how detailed information a tool can produce. The vertical axis is ease of use. Separate colors are presented by new tools, stable tools and out-of-use tools, which should not waste your time.
Very often, people are unfamiliar with ftrace , especially for non-system-level developers. Raise your hands, which of you heard about ftrace ? Just a few. Ftrace is a built-in mechanism, it has been included in Linux since time immemorial, it is a tool for tracing performance problems, bugs during production. However, it is not designed to work with Java. It cannot be used to trace many interesting Java events, such as garbage collection, class loading, object highlighting.
Let's go to perf . Quite a useful tool, which of you used it? Already significantly more people. The following speaker will talk about how to adapt perf to work with Java applications. In my report, I will not use perf, and later I will explain why. But I will say that it is applicable to a much wider range of applications.
Next, SystemTap . Which of you used it or heard about it? Again, very few, and, it seems, the same people that raised their hands earlier. SystemTap is a very low-level tool that can trace kernel events and high-level events in user space (including Java events). The main problem that many people encounter in SystemTap is that in order to work with this tool, you need to compile the kernel module during its execution and load it into the kernel. Some are ready to do this; for others, loading dynamically compiled kernel modules does not arouse much enthusiasm. The creators of SystemTap are developing a backend to BPF so that you can not compile a new kernel module for each trace program, but so far this remains a problem.
At the opposite end of the spectrum is maximum availability and convenience, but less functionality, this is SysDig . Which of you used it? Even fewer people. SysDig is a great tool, with a special focus on tracking performance in containers, but it can only work with system calls. He does it well, but he can't do anything else. Not exactly what is needed for Java applications.
Today, I will mainly talk about BPF- based tools, but I'll go on to BPF itself later. BPF has several frontends, tools based on it can be written in C, in Python, there are many options. Those that will be discussed in the report are new, not as stable as others, but extremely powerful. Because of the novelty, it is sometimes not easy to use them, but they are worth it - at least I hope to prove it today.
There are other tools. For example, some obsolete, incl. DTrace under Linux. It was quite an ambitious project, but in the end he died. As I said before, in its own way BPF is the DTrace for Linux that we lacked.
Since Java is today our focus, let's talk about monitoring points in the JVM. What can be traced in a running JVM-specific Java application, i.e. in addition to things performed by the operating system (system calls, network events)? It turns out that in most of the latest Java versions, the JVM has built in quite a few static trace points that can be enabled at runtime, i.e., they do not need to be included in advance. Then you can connect trace programs to these points, which will give you the information you need.
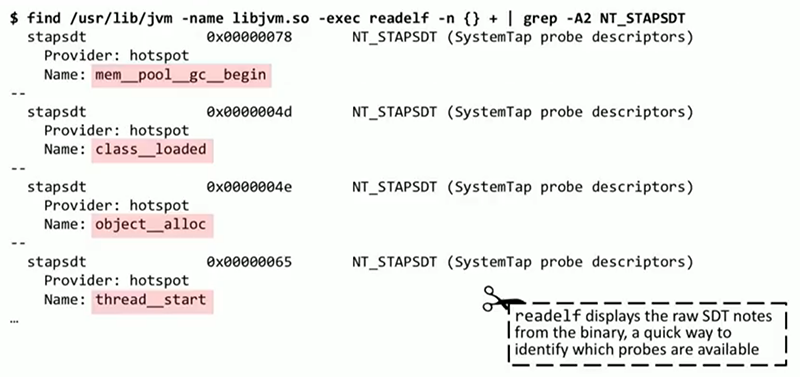
I will describe one of the ways you can get a list of these trace points. Linux has a readelf tool that analyzes ELF headers and can issue notes. They describe those very trace points that are embedded in any Java application on your system. We see high-level Java events: class_loaded , thread_start , object_alloc , they can be traced through these points.

There is another tool, tplist , it is somewhat easier to use, I wrote it myself. You do not need to analyze notes with it, since it creates a simple list. There are many dozens of examples of trace points: garbage collection, occupation and abandonment of monitors, JNI events (they are not shown on the slide).

These events also have arguments. In the interest of saving time, I will not now tell you how this information was extracted, but tplist has a flag that allows you to output the arguments of each of these points of observability. For example, based on common sense, we can say that the monitor__waited event most likely has some kind of information about the monitor that we expected, perhaps there is a stream identifier. However, nothing is said directly here about what exactly these arguments mean. It turns out that here the text files attached to the JVM, in which these trace points are described, can help us. Essentially, SystemTap trace files. In them, you can, for example, find out that the monitor__waited event monitor__waited several arguments, it is the stream identifier, the monitor identifier, the class name of the expected object. It even offers the option of a format in which it can be presented for tracing, for display.
So, the question is: are we talking about OpenJDK, Oracle JDK, any specific distributions? As far as I know, there are these trace points in all JDKs, even though I strongly doubt that the specification forces this. When they arose, I can not say for sure. I remember the Oracle article, it seems, of 2008, in which they were described, so this is not a new phenomenon.
(After this report, we checked: there are no monitoring points on Oracle in OracleJDK. There are on Solaris and possibly on Oracle Linux. These points are in the source, but they are not compiled by default. But in all OpenJDK they are present!).
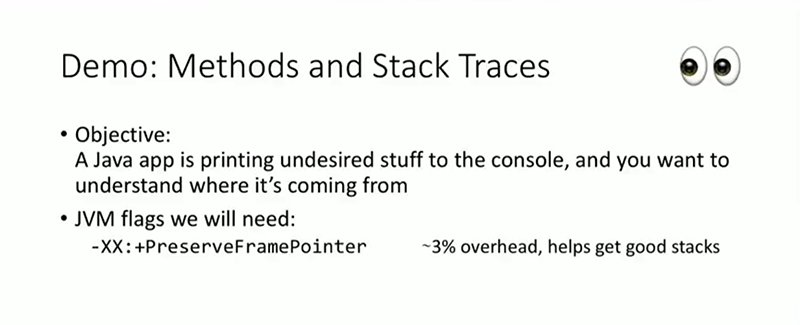
First, I would like to show how they can be used, and then go on to describe BPF and its work with them. Here is a not serious example: a Java application prints messages to the console, which are apparently important, but we do not know where they come from. And to find out which code sends these messages, we want it in production. Perhaps with the help of a debugger, this problem could be solved through breakpoints, but we will not do that. We need the PreserveFramePointer flag, which is also used by many Java profilers for passing the stack. This flag was already present in JDK 8u60, and will be discussed in the next report, which uses perf . The flag is required for walking on the stack. This flag enables verification that frame register (one of the CPU registers) is not used for normal calculations, like any other register. It should only be used to handle call chains, including for walking on a stack.
Estimated cost of using this flag is about 3%. If the CPU load is not ultra-high and millions of methods are not called per second - maybe 0%, this is a modest estimate. On the screen you see the output of the program we are trying to trace.
Warnings look serious enough, so you need to understand where they come from. Let's try to use the trace tool, written, again, by me. He is involved in tracing system-level events, and simultaneously receives a stack of Java calls from these events. There is no need to restart the Java application, recompile, in fact, trace is an extremely lightweight tool that can be run in production. Links are posted along the slides, by the end of the report you will know where to get all these tools.
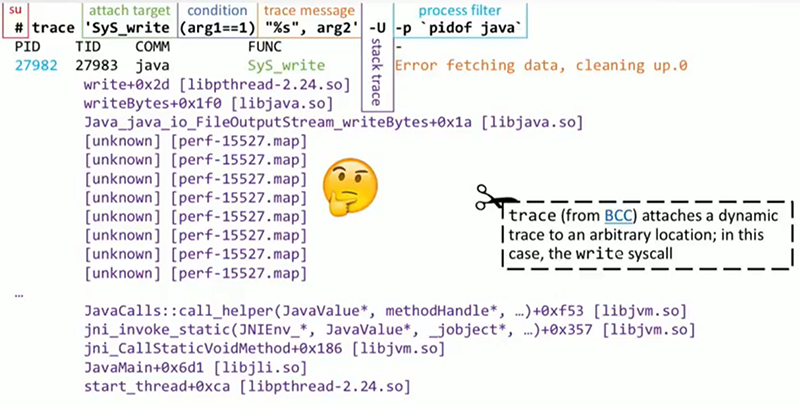
trace is based on BPF . On the slide you see the appeal to him. First, note: I need to run the code as a privileged user. As we will see later, this is required by BPF , like perf , like many other tools. Then you need to determine what exactly to attach the trace . I need output tracing on the screen, but in this particular case I work at the system level, so I will look for a specific system call that, among other things, performs standard output. In addition, I will add the condition that the first argument should be one. What do you think will be the first argument for the desired system call?
That's right, the file descriptor, and the unit is the condition by which I will trace the stdout to stdout . Then we see the message that will be printed, in printf style; arg2 is a buffer that is directly in the process of printing (if it contains text, which is most likely). It is followed by the -U flag, which indicates the call stack in user space. At the very end, we put a filter that leaves only the Java process, since we are only interested in it. If you understand the syntax, I hope it will all become clear.
Let's look at the trace output. He is almost as we wanted. The first few lines are the heading, identifying process and thread identifiers. Then comes the message that interests us - “an error in data acquisition, clearing occurs”. The call stack is almost what we need, at its beginning everything is in order, but it does not show us the most interesting part, for example, what happens before java_io_FileOutputStream . And we will face this problem when working with many tools that try to go through Java stacks and build correspondences with symbols, function names, and methods in your code.

Here, as in perf and many other tools, a small agent will be needed to print the correspondences between the addresses in the memory of the JIT compiled code and the actual method names. If necessary, it can also print information about the source, since it has access to them. In this case, I use a fairly common and very simple agent, perf-map-agent , which can be found on GitHub. It will send its output to the / tmp folder, these will be files in a very simple format with the address of the code, the specific method and the size of this method. These matches are needed to resolve java call stacks. If the profiler initially does not know how to work with frames of Java stacks, one cannot do without such an operation.
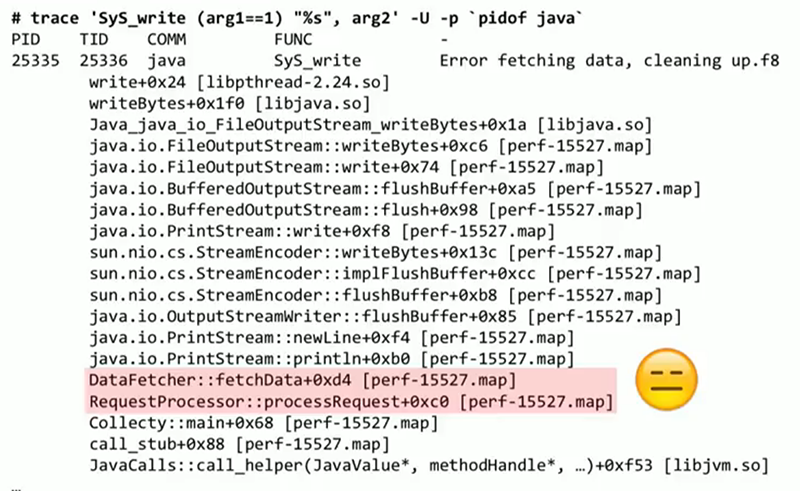
On the slide, the new result using the agent, the stacks look acceptable in it, the names of the functions are resolved, which are all extracted from the .map file we just generated. The slide highlights a part of the code of my application (DataFetcher :: fetchData), which provides the output to the console that disturbed us. The source was found, and now it depends on the situation, what we will do with this code. It seems to me that this is an example of the possibilities that we must have: extract data from an already running system using simple, non-resource-intensive, ready-to-produce tools. This can occur at the Java level, at the system level, at the kernel level — it does not matter.
Before we get to the heart of the matter, consider another similar example. A java application that causes a lot of garbage collection. From the garbage collector log, I know that it calls System.gc() directly, and I need to understand exactly where. The application is huge, a lot of libraries, which code makes these calls is unknown. I did not start with this example, because here we will need a flag that requires a lot of resources. This kind of super-debug mode is called ExtendedDTraceProbes , and it allows you to attach a trace program to the input and output of any Java method. Obviously, this will require more resources than for other methods that I have mentioned, so this flag should only be used when a specific problem needs to be solved.

Before us is the garbage collector log, in which we see direct calls to System.gc() . Here we will use trace again, but in a slightly different way, since the purpose of the attachment will be slightly different.

It will be a point inside the JVM called method__entry , and with it you can trace any Java method. To indicate which particular method we are interested in, we substitute a condition that requires that arg4 (this method name) be equal to gc . Probably I should also add a check on the name of the class, which should be System . Then I type the message, and after it the call stack. Finally, all this should be done only with Java processes. Next is the output that has the call and stack traces for each System.gc() call in this application. We see that this is the same code as last time, DataFetcher::fetchData , called upon RequestProcessor::processRequest , etc.
This is an honest full stack, it has both java-frames and native frames from the JVM, and it leads us all the way through, up to the root thread in Linux. Absolutely everything can be seen here. Such here came an example of what you need to overcome in order to get to such data.
A few more examples of the motivation behind such work ... Let's move from examples to the already mentioned problem - what's wrong with perf ? This tool is mentioned in every monitoring or tracing report of Java applications in production on Linux. As I already mentioned, the next after mine will be a report on the new and original way of using perf for sampling CPU cycles in Java applications.
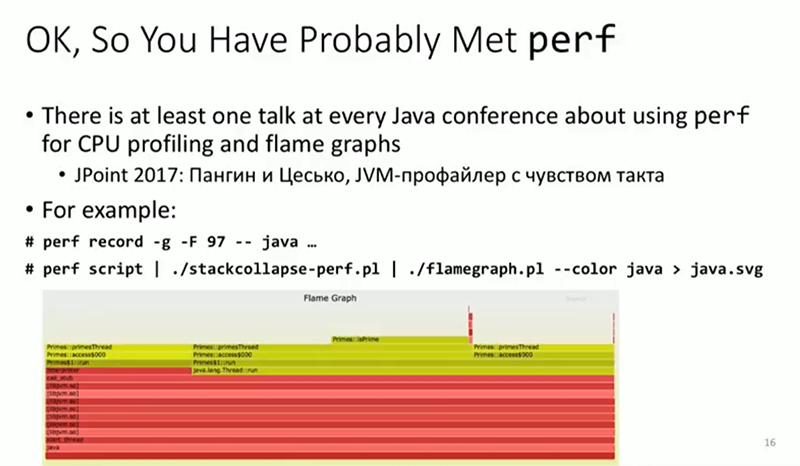
With perf, we act simply - first we write down, then we process the record, we get, for example, a flamegraph. Most likely, some are aware of this use of perf . The problem I’m going to talk about is connected with BPF and with the thought that I would like most of all to convey to you. For its work, perf transfers a large amount of data to the usespace through a file for later analysis. I put an experiment: I created a virtual machine on a certain cloud, connected to this machine and downloaded the file at a speed of about 1 Gbit / s. I don’t have such a connection at home, which is why I said that this is a virtual machine on a cloud. As a result, I got about 90 thousand events netif_receive_skb . I could record this using perf to trace the data my system receives, trace delays and packet sizes. But at the same time, 90 thousand events per second will be output, and when recording call stacks, this is 20 megabytes of data per second written to the file. Obviously, in production, as a rule, it is not done, and it is clearly undesirable to perform such work for more than a minute, as the hard disk space will simply run out. In this case, we may be interested only in 5 bytes from these 20 megabytes per second, for example, the average packet size, or the average delay between receiving a packet and delivering it to a Java application, or something similar. We do not need 20 megabytes per second, but this is exactly how perf works - events are shipped to a file, and then the program is launched in the user space that analyzes this file. This is exactly the problem we are trying to solve. We are trying to move processing closer to the immediate data collection, to the trace program, and to avoid creating any files if we don’t need them ourselves.
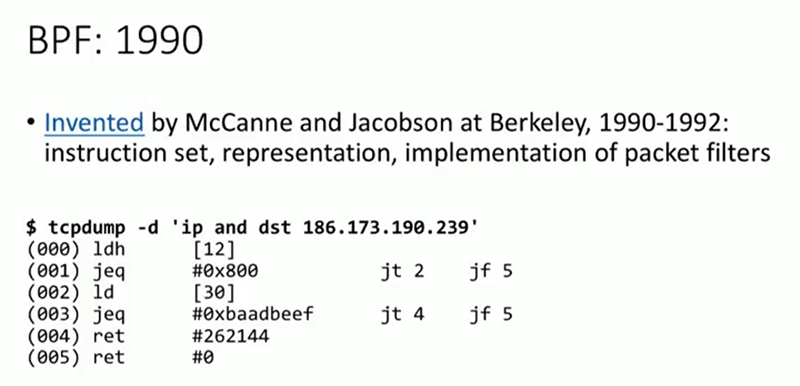
And here I want to introduce you to BPF, stands for “Berkley Packet Filter” . The tool exists since the beginning of the 90s. I would not like the report to turn into a history lesson, just trying to show that the basis here is very mature. BPF was created to filter packets, to trace incoming packets, and to decide whether to pass them or not. tcpdump , Wireshark or similar tracking tools use it when you specify from which IP addresses you want to receive packets, with which protocols. Both tcpdump and Wireshark in such cases create a small BPF program with its own set of instructions, pass it to your kernel, and it then runs this program for each incoming packet to decide whether to remove this packet or trace it. On the slide in front of us is this set of instructions, which is just another assembler. In the 90s, this instruction set was extremely simple. But over the last 3-4 years, much effort has been made to ensure that BPF can be used not only for network purposes, not only for packet filtering. Today, its function includes tracing, and my main focus will be on it. The trace tool I demonstrated above uses BPF . But BPF has other features. In addition, like Java, BPF now has a JIT compiler. This instruction set is no longer interpreted by the kernel; instead, it compiles them into machine code, into processor instructions, and then executes them.
Above, I said that SystemTap has a problem, which is that it loads a dynamically compiled kernel module. This is not the same as BPF . In the latter case, the set of instructions is not arbitrary, it was specially selected to avoid security problems. A bad BPF program cannot drop or suspend the core. BPF programs do not allocate memory, and therefore cannot cause a memory leak in the kernel. All the functions of these programs are severely limited so that they do not harm production.
I'll tell you briefly about some of the scenarios, before moving on to the main topic, the trace. One of the crucial uses of BPF today, which can be heard at network conferences - XDP (eXpress Data Path) . Suppose you are creating a service for protection against DDoS attacks (for example, Cloudflare ). You need to remove packages as quickly as possible, without processing them and not transferring them. In this case, before the packet goes into the kernel, onto the TCP stack, or into any application, a BPF program is executed that decides whether to remove the packet, pass it on to someone else, or send it up to the top. This is one example of setting up dynamic rules for your system using BPF .
Another example of the same kind is seccomp . In Linux today, you can install a BPF program to filter the system calls of a particular application. An application can deny access to a specific file, while allowing calls to other files. You can prevent writing to the hard disk, while allowing you to read from it. Thanks to this filter of interactions with the system, the BPF program creates a kind of sandbox.
We will mainly talk about using BPF to trace events on your system, for example, garbage collection, as well as tracing method calls, which I have already mentioned when I showed trace. The system has different attachment points; at the application level, it is garbage collection, object allocation, and class loading in Java applications. In addition, there are many attachment points at the kernel level, for example, receiving packets, write and read system calls. In user space, there is a monitoring program that installs a program on the BPF in the kernel, and then attaches it to events of interest to us. When these events occur, the program in the kernel is executed, and it can do one of two things. It can transfer information to the user space, and at the same time it essentially works as a trace facility. This is how my program works, it prints its output through a script in a user space. Alternatively, the program may update the in-memory data structure that performs the aggregation. Instead of transferring data to the user space for further analysis, you can perform aggregations directly in the core, get averages, maxima, minima, histograms, etc. where the tracer works, while not transmitting millions of events. This is the key difference of BPF , which makes it so valuable and gives it an advantage over perf .
When the program in the kernel has completed, your script in the userspace reads data from the buffer or from the data structure, and does with it what you need: it displays messages on the screen, draws graphs, histograms, etc. Unlike perf, files are not created anywhere unless you need them.
Why is this tool not generally accepted? First of all, because it is brand new. To use any BPF programs involved in tracing and performance monitoring , you need at least a 4.1 Linux kernel, which is only a few years old. In Ubuntu 14 or CentOS 5, it is not. For the most useful things you need an even newer core. Let's look at the example of Fedora and Ubuntu . In Ubuntu 16 LTS, you can use many features of BPF , in Ubuntu 16.10 you can use almost everything. The newest functionality added by BPF requires kernel version 4.9 , which was released just a few months ago. Therefore, many things may not work directly today, or work only on certain systems with a fairly new kernel. But the future of tracing under Linux is precisely BPF . This applies to both Java, and Python, and C ++ - any language that runs under Linux. The reason lies in the ability to execute the trace program in the kernel and perform complex actions there, such as updating the correspondence tables and histograms, instead of transferring all the data to the usespace for subsequent analysis.
Compare the old and new methods. As a rule, when using perf , data is shipped to a file, then the file is processed and analyzed.In the case of BPF, analysis and aggregation take place in the kernel, and a small correspondence table is updated. The trace tool then only needs to read from this table and display the result. Thus, there is a significant unloading of channels between the core and user space, and significantly less resources are consumed.
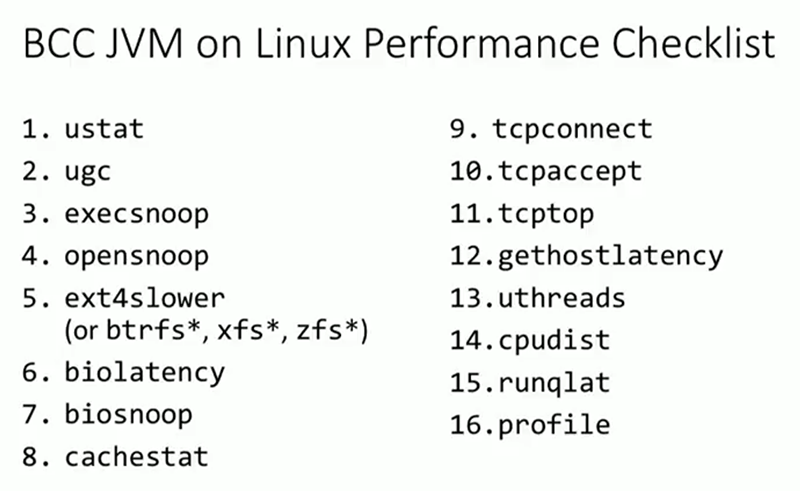
. , , BPF , . BCC . , .. , , , , - Linux. . .

BCC . — , . - , . , , , , Java, MySQL, Postgres , . , , , , BPF .
, . , , , , , , . , , IO. , TCP TCP. DNS. , . , , — . , Java.
, . , . . , , BPF.
top , 100%. , , . BCC — uthreads . , Java-, . , . , . profile , ( perf ). profile Java, , PU, . , . Java, Java-, — . , perf — , java-, — .

, . , . , . , . , . , , . , , . dd, dnf, Java stress . , , Java. Java , — Prime::isPrime , , . ? , , . isPrime , , , , isPrime . , . , , . — , , , CPU, . , , BPF , , .
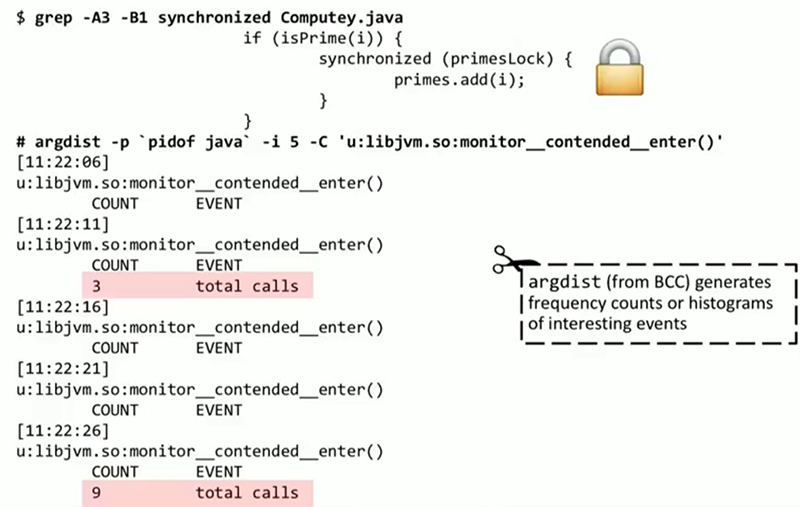
. , , : , , ( if(isPrime(i)) ) . , ? ? , Java- , ? BCC, argdist. , . , : monitor__contended__enter() , JVM. Argdist 5 , . , — 3 , 9 . - , 3 9 5 , . , , . , . , , JVM.
CPU, , Java- , , , . Java-, , MySQL. , . , , . , , 50 , .
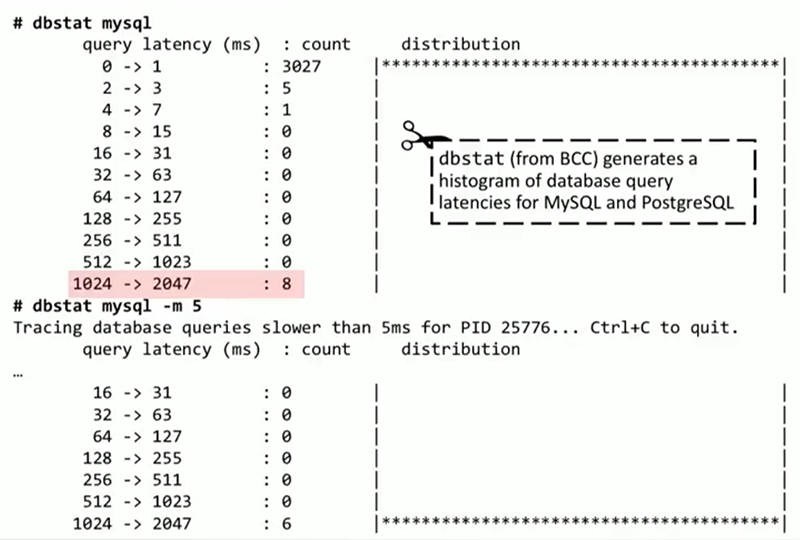
, dbstat BCC . MySQL PostgreSQL. , , . MySQL ASCII- ( , ). 3000 0 1 , 8 1 2 , . . MySQL. dbstat , , , 5 . , 2 , .
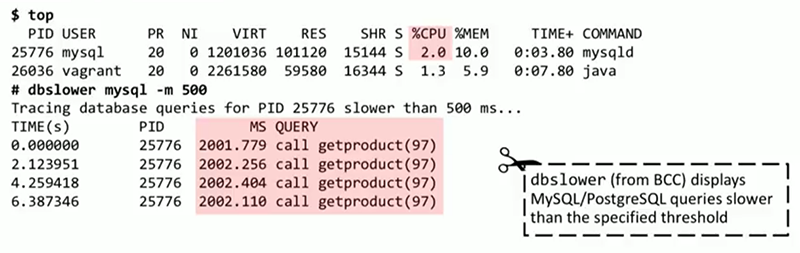
, MySQL. top , 2% , . , BCC dbslower. MySQL , — 500. dbslower , , call getproduct(97) . , ?

, trace , . MySQL query__exec__start , . trace , call getproduct(97)`` sleep(2)`. , , — sleep(2). , , .

, . Java-, . . Java , , mysqlsniff . . BPF Java , , , socket.send() . MySQL. , , . , , . , call getproduct(97) . , hibernate, beans ., JDBC, . — , Product::load , User::loadProducts , Databaseey::main .. , , . , Wireshark , , . , BPF , MySQL , , . , , — .
, . MySQL , Java. Java , BCC , .
, , . , , , .

, , . Java-, . .NET, , , . top, , , BCC ustat . Java, . 800, , , , , , . profile, , . ResponseBuilder::addLine , , .
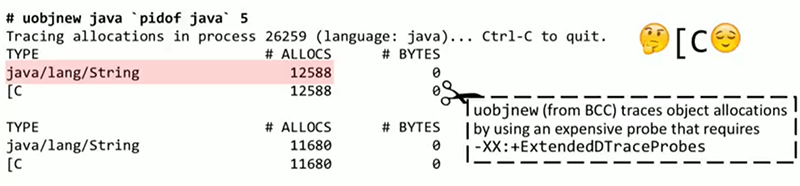
, BCC Java, Ruby — uobjnew. , ExtendedDTraceProbes . , , , , . 5 , Java. , . uobjnew , , , . , , — stackcount . object__alloc JVM, , . , , . , : _new_array_Java , ResponseBuilder::AddLine . , — JVM, SharedRuntime::dtrace_object_alloc — .
, , . , , , . -, , , .

. , , — « ». , , , , ? opensnoop, . -x . , /etc , — 2, Linux « », . , , . trace. open, «-2». Java. . , , , . , Java.
, . HTTP- . , . , , , , 1.4-2 . 6 — , - . — facebook.com, — i-dont-exist-at-all.com, . . . , , 5 .
, , DNS , . . BCC DNS. DNS . , DNS , . . , ? trace , «-2», « », .
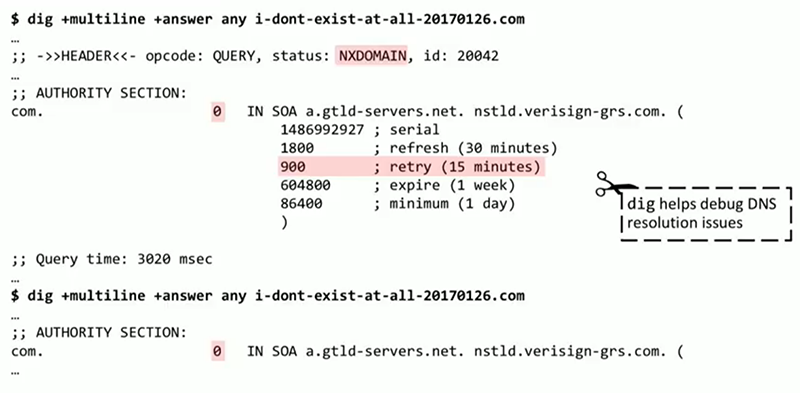
dig — , , , , BCC. DNS i-dont-exist-at-all.com dig : , , , 15 , . . . « » 0, . dig . DNS.
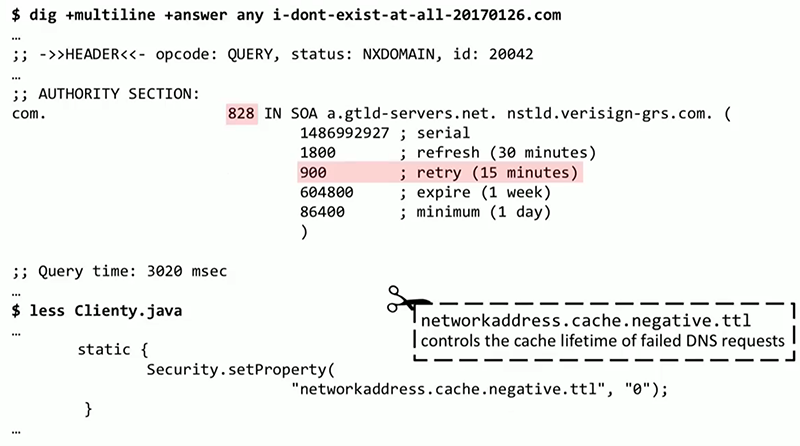
. , DNS-, , 800 - . - . , DNS 0 . , , Java DNS . , , BPF , DNS.
, , : , JVM-; BPF Linux; ; . .

Minute advertising. As you probably know, we do conferences. — JBreak 2018 JPoint 2018 . , Simon Ritter — Deputy CTO Azul Systems. c " " . ( olegchir ) . In short, come in, we are waiting for you.
')
Source: https://habr.com/ru/post/348912/
All Articles