How does Cisco monitor security on its internal network?
From the point of view of ensuring cybersecurity, we usually face only three main tasks, which, of course, are then broken down into smaller subtasks and projects, but, exaggerating a little, basically, there are only three tasks:
Whatever solutions we consider, they fit into these three tasks, which we must implement anywhere in the corporate network. It is this life cycle of dealing with threats (BEFORE DURING AFTER) and forms the basis of the activities of the information security service of Cisco. And I’ll note that since Cisco doesn’t have a perimeter concept, we try to implement the three tasks described above everywhere - in data centers, in the clouds, in the Wi-Fi segment, on employees ’mobile devices, at Internet access points and, of course in our internal network, the monitoring of which we will talk about today.
After all, we don’t have such a question about the perimeter (why we don’t have a perimeter, I’ll tell you some other time), where we put ITU, IDS, content filtering tools and many other network security tools. Why should the internal network be an exception? What, you can not get into it from the outside, bypassing the perimeter? Yes, a bunch of ways. Through unprotected own Wi-Fi or through the access point of the neighboring “Chocolate Girl”, to which the mobile devices of your employees who are used to pick up a cup of hot coffee or dine are automatically connected. Through the hacked home laptop or tablet / smartphone manual that dragged him to the office to “IT pros figure out”. Through a USB flash drive thrown to the office, on which a non-detectable malicious code is flooded. Through an encrypted channel of the client-server application, which was developed without considering security issues. Yes, through the perimeter vulnerabilities in the end (let us not assume that our ITU is absolutely invulnerable). That is, the internal network needs the same protection as the perimeter, on which many organizations unnecessarily often focus their defense efforts, completely forgetting about the truth about the weakest link.
')
I have already told you how threats are prevented in the internal Cisco network - we use the Cisco Identity Service Engine (ISE) for this, which performs the function of a distributed ITU that turns each switch or router, and we have only the last over 40 thousand, into a part of the internal access control working on dynamic policies. But differentiation and prevention alone are not enough for us. We must also monitor activity within the framework of permitted intra-connections, as well as monitor any violations of the established rules of internal access (we are all human, it is natural for all of us to make mistakes). At the perimeter, we would install an intrusion detection system (IDS) and solve this problem. It’s not easy to install IDS on the internal network, although Cisco would be happy to sell as many sensors as possible to our Cisco NGIPS, especially since we once again became the leader of this market according to Gartner. But this is often impossible (except for some places within the network such as data centers or individual segments). It is also impossible from an architectural point of view - not every switch port can have an IDS sensor, not every trunk or span port to which IDS often connects will pull traffic from all switch ports, the span port is not always free. It is also impossible from the point of view of finance - it is too expensive to buy high-performance sensors for each switch or router. Even at Cisco, despite the fact that we ourselves produce NGIPS, we cannot spend a lot of money on monitoring using our internal network's IDS - this is quite expensive. Even if you try to use splitters (tap), they will not solve all the problems either in terms of architecture or in terms of finance. In addition, if on the perimeter the security guards still somehow learned to live with IT people (networkers), then on the internal network the conflict continues to smolder. Do we have an alternative to the classic network IDS to solve the same problem?
The answer will be yes and it is called Netflow. This is a protocol that was originally developed by Cisco for the purpose of detecting problems on the network (troop troubleshooting), which then became the de facto standard for many network manufacturers who either supported Netflow in their equipment or created its clones — Cflow, sFlow, Jflow, NetStream, Rflow, etc. But since today we are talking about how the internal Cisco network is monitored, and we use our same network equipment, we will focus only on the Netflow protocol, which today has almost any normal network hardware of corporate level (from all sorts of “home”) There is no need to wait for devices to support Netflow - at home it simply does not need it and will only make the decision more expensive and expensive.
So, Netflow on network equipment, through which all traffic that requires control, passes. This means that we can try to use it not only to detect any problems in the network, but also for information security purposes. In addition, support for Netflow network equipment allows us not to build a separate, superimposed network for monitoring purposes, but allows the already used network equipment to be used for information security tasks. This, on the one hand, protects the already made investments and reduces the cost of the monitoring solution, and on the other hand, makes it simpler in terms of architecture and implementation - no need to try to properly direct the flows we need to tens or hundreds of IDS sensors, which otherwise would have been forced to put in your network. Working with Netflow gives us one more, not immediately visible advantage. In the case of installing conventional IDS, we have to solve the problem of directing traffic or its copy to the sensors of the protection system. If for some reason this does not happen (for example, due to a change in topology or lack of bandwidth at the sensor), then we absolutely will not see anything and we will think that there are no attacks in the traffic of interest to us. The sensor itself is working - only it does not receive and does not analyze the necessary traffic. With Netflow, this does not work - we see everything that flows through a network device, which can be not only a router or switch (including virtual ones), but also, for example, a firewall (for example, the Cisco ASA supports the NSEL function, Netflow Security Event Logging, which allows you to broadcast network streams as Netflow for analysis with an appropriate monitoring tool.
It's time to make a couple of comments about Netflow, which were obtained as a result of operating Netflow for security purposes on a Cisco network. First, you need to know that Netflow can be un-sampled and sampled. The differences between them are the same as if you read the complete book “from cover to cover” or scroll through it, stopping only on every tenth page. Many network devices support Netflow, but only sampled, which is not suitable for security purposes, since we see only a small part of all the traffic we need to monitor. So pay attention to which Netflow you support. Sampled for information security purposes is not suitable. Secondly, you need to know that processing Netflow, especially un-sampled, creates a load on the processor of a network device, which must be taken into account when planning a network and building a monitoring system for information security systems based on Netflow. If your switches or routers are already working at the limit of their strength and their CPU load reaches 80-90% in normal operation, then it’s worth ten times to think whether to include Netflow on them, because of which the device’s performance will definitely get even higher. There are two solutions in this situation - updating the network infrastructure (anyway, sooner or later it would have to be done) and the use of Netflow generation devices. We at Cisco used both options. In cases where monitoring Netflow was a critical task and the time came for an upgrade, we installed new switches and marchers with Netflow hardware processing that does not load the CPU. In other cases, we used a solution called FlowSensor, which passed traffic through itself (analogue of the splitter, tap) translated into Netflow, passed on for analysis by our security service.
There are several versions of the Netflow protocol, the most common of which today are the 5th and 9th. Based on the latter, an open IPFIX specification was developed. Version 5 of the protocol allows you to collect the following information about network traffic:
Version 9 supports additional fields related to IPv6, MPLS, BGP. There are also extended versions of Netflow, the same IPFIX, Flexible Netflow, which support custom fields.
At first glance, this information is superficial and reflects only what is in the headers of network sessions, but in fact, as we already saw in the story about encrypted traffic analysis (ETA) technology, in many cases it is enough to classify and recognize traffic. For example, an excessively large number of packets or bytes may characterize DoS, a large number of destination addresses within a limited time interval may mean a network scan, etc. With Netflow, you can profile nodes and track deviations from their standard behavior.
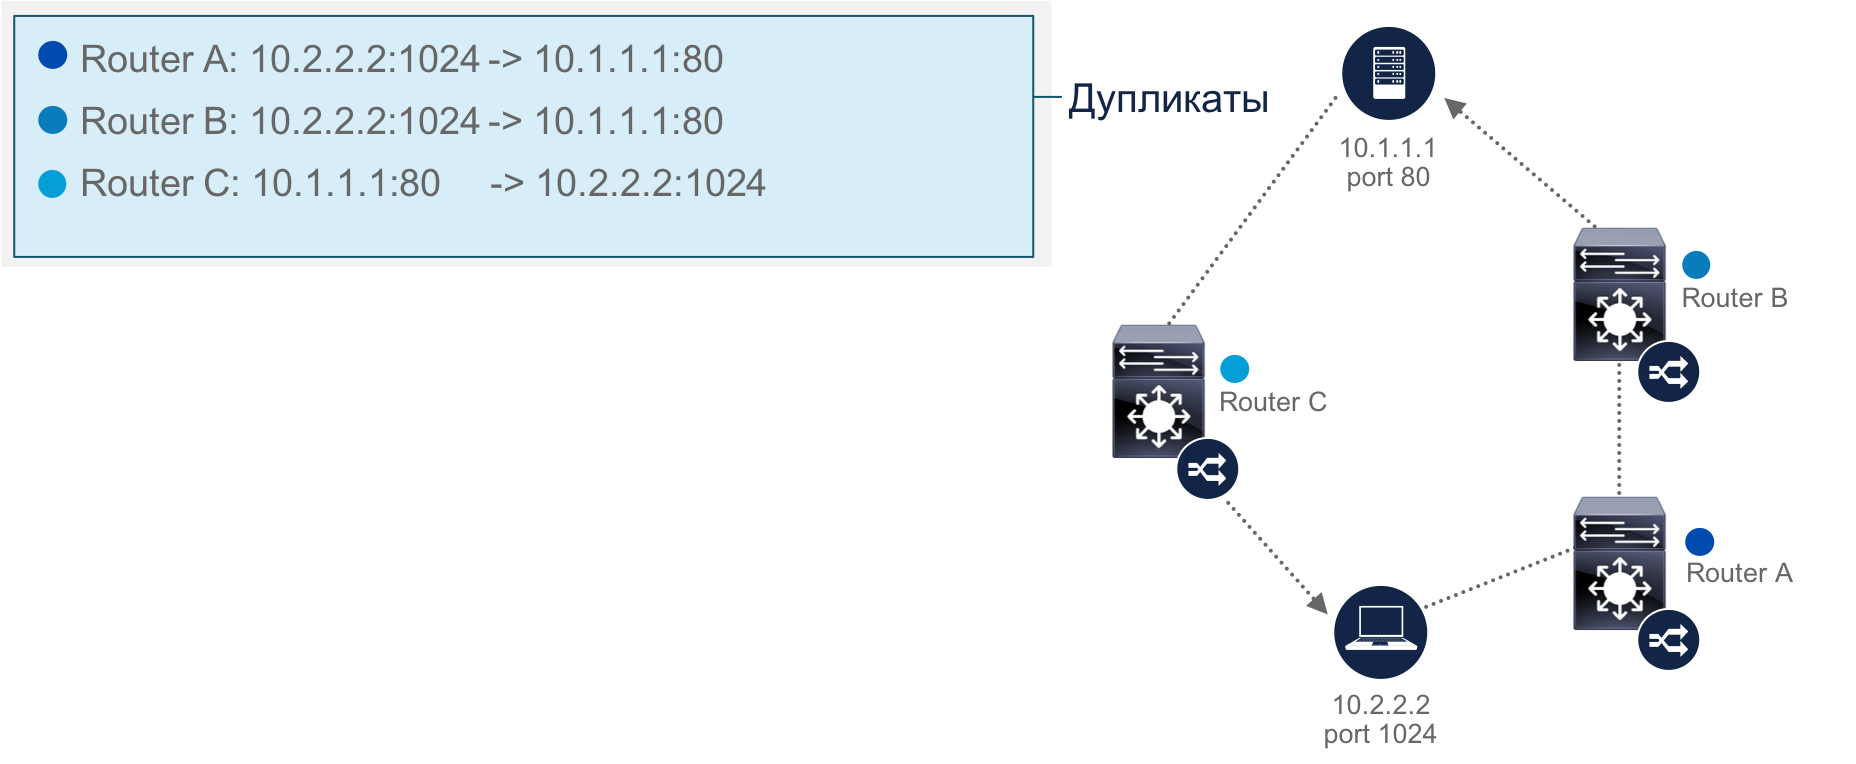
Initially, Cisco used free nfdump solutions ( https://github.com/phaag/nfdump ) and OSU FlowTools for monitoring (OSU is an abbreviation of Ohio State University), allowing you to work with Netflow - filter, sample and perform other operations on network streams. Both solutions are fast enough (they can process several dozen gigabytes of streams per day), are easy to use for those who already have experience with classic tools like tcpdump, and are flexible in filtering. But these tools have problems that can be broken down into three parts. Firstly, these are the shortcomings of the utilities themselves, which did not allow, for example, to aggregate the flows normally, which often leads to their duplication (imagine that the same flow passes through 5 network devices — the utilities will also see them and write them 5 times). In addition, nfdump and Flow Tools did not allow to monitor the loss of flows, which led to a sense of false security (paraphrasing the classic phrase from the movie “DMB”, “you think you see the flow, but not really”). In a small network, this is not so critical, but in such a distributed one as in Cisco, it began to create great difficulties as the implementation of the monitoring system expanded at new sites. Secondly, any open source project has difficulties associated with supporting, adding new features, expanding the number of supported versions of Netflow, etc. Finally, working with nfdump and OSU Flow Tools required not only high qualifications from the staff, but also considerable efforts to automate typical and routine tasks related to incident investigation and response.
For example, to detect infected internal machines that communicate with command servers, you need to create and maintain a relevant list in the Cisco ACL format, and then submit it to the input of flow-filter utilities, which will apply it to collected Netflow streams.
It is clear that in order to work effectively, you need to keep up to date a multitude of previously created lists - attacking, C & C servers, internal nodes, segmented by various criteria, etc. In this case, the last list itself will constantly change due to the variability of the dynamic infrastructure of Cisco.
Another problem with the use of nfdump and OSU Flow Tools is the inability to recognize who initiated a particular connection (this is important during an investigation), since the flows are unidirectional. We have to carry out additional work in order to understand who was the first in client-server connections. Finally, we stumbled upon another subtlety associated with the work of these utilities. They record only completed streams, which can lead to the inability to quickly track attacks that occur in real time. For example, the attacker has already performed a network scan, node compromise and penetration, but neither nfdump nor Flow Tools is aware of this, since the network flow has not been fixed by them.
After gaining experience with nfdump and OSU Flow Tools and as we move to IPv6 and Netflow version 9, we began to look for a tool that lacks the flaws we have encountered. It was Lancope's Stealthwatch solution, which we later acquired and it became part of Cisco. Stealthwatch is built according to the “sensor - collector - analyzer” architecture, which is classical for any analyzer.
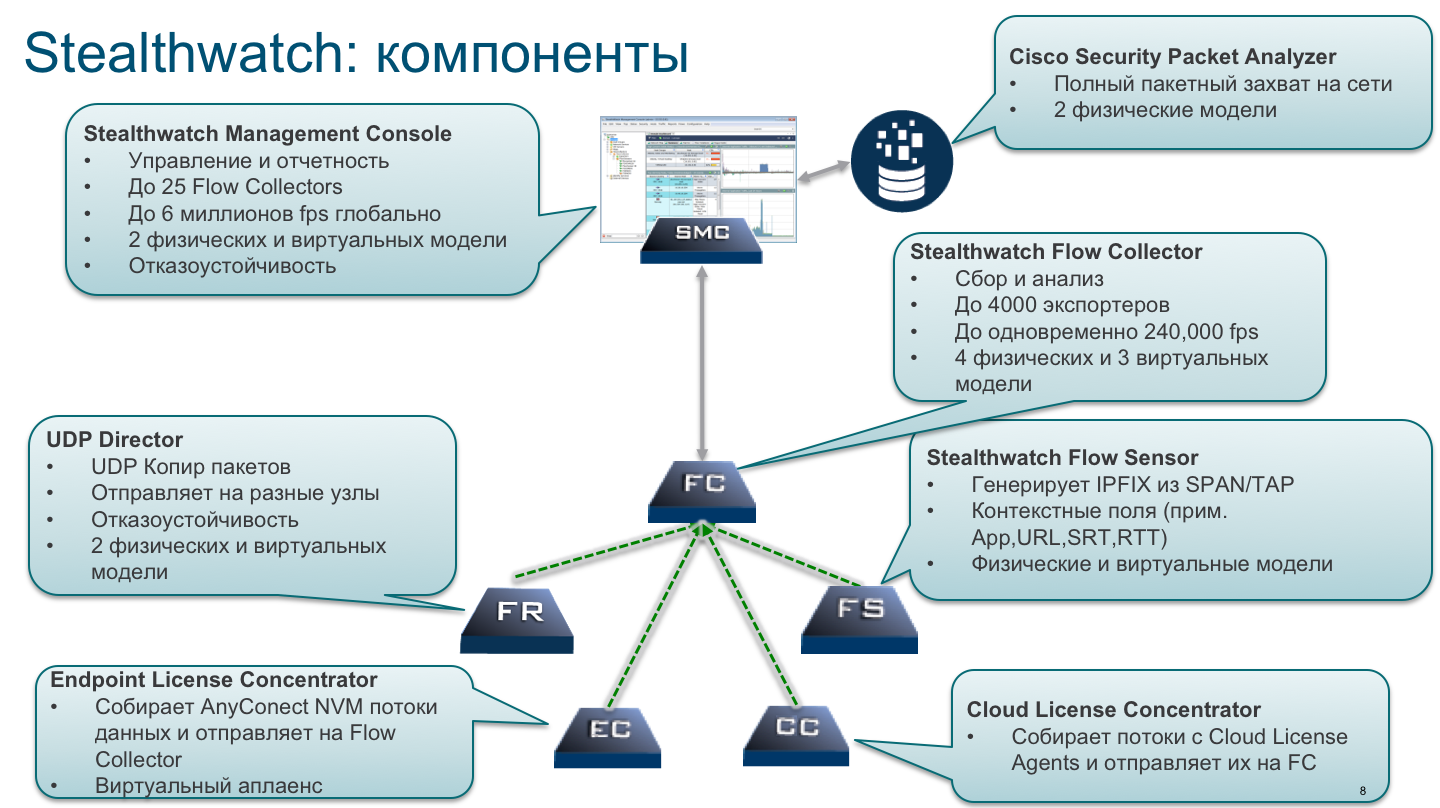
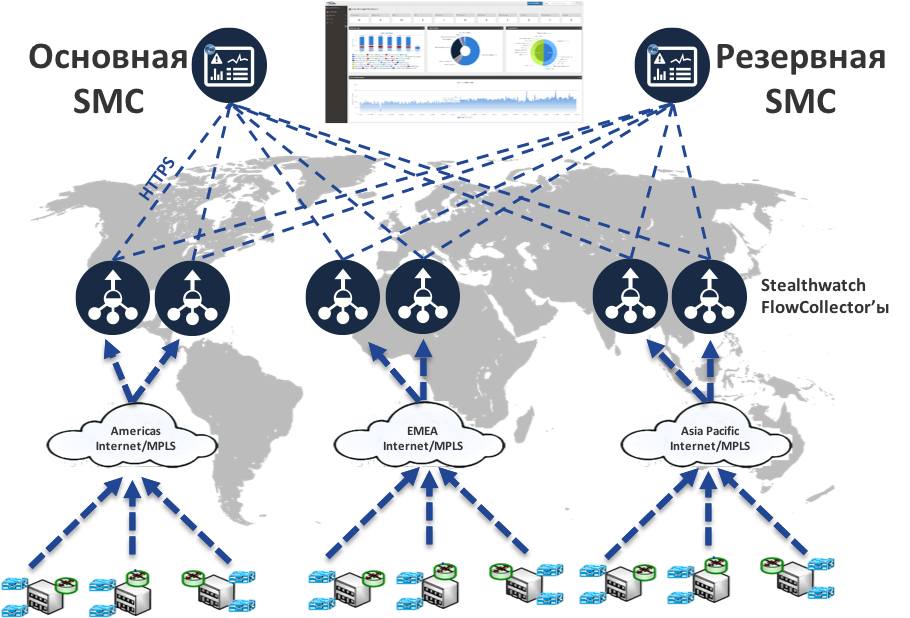
As sensors, we use our network infrastructure, which passes all internal network traffic through itself, translates it into Netflow and transmits it to collectors for analysis. As I wrote above, the network equipment does not always support Netflow or is able to process it effectively. For this task, we use separate hardware or virtual FlowSensors (we have 13 of them altogether). Considering the geographically distributed infrastructure of Cisco, we reduce not all of one flow to one or two collectors, but a whole distributed cluster of 21 FlowCollectors that process about 20 billion Netflow flows every day in search of malicious activity in our corporate backbone and data centers. And we have only two consoles - they are accessed by Cisco incident response staff in accordance with their roles
Perhaps the main obstacle to the effective use of open source monitoring tools Netflow in our network (yes, in general) was their lack of normal analytics. They have flexible filtering and sampling tools, but without a person they are not able to make a decision about the presence or absence of a problem in network flows. Stealthwatch was deprived of this drawback - its key advantage was the presence of a built-in database of algorithms that allowed Netflow to be assessed and recognize various security breaches - network scanning, DoS, distribution of malicious code, information leakage, etc.

Key scenarios in which we use Stealthwatch (in fact there are more):

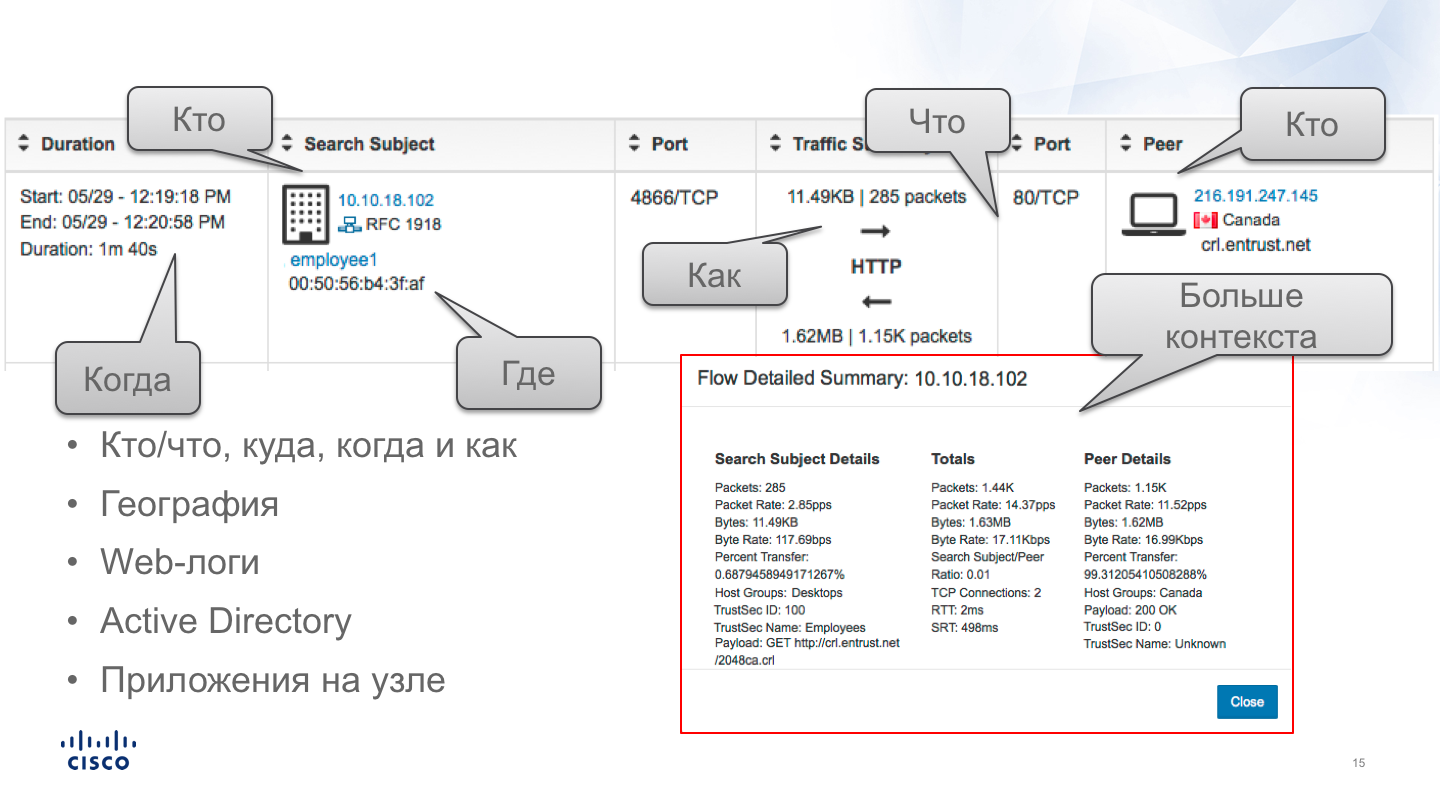
Netflow is an ideal source of information during incident investigation, which contains all the necessary information about who carried out what, when, and what kind of actions. At the same time, all this information is stored in a database, and the response service staff can make the necessary requests to it, filtering and sampling according to the required fields, and quickly finding answers to their questions. Integration with Cisco ISE provides information not only with reference to the IP addresses of the nodes participating in the incident, but also with reference to accounts of company users in Active Directory. The latter possibility is not only convenient, but also significantly reduces the time to match the user's name with his dynamic IP address, which he had at the moment of interest. Reducing time is a critical success factor in incident investigation.
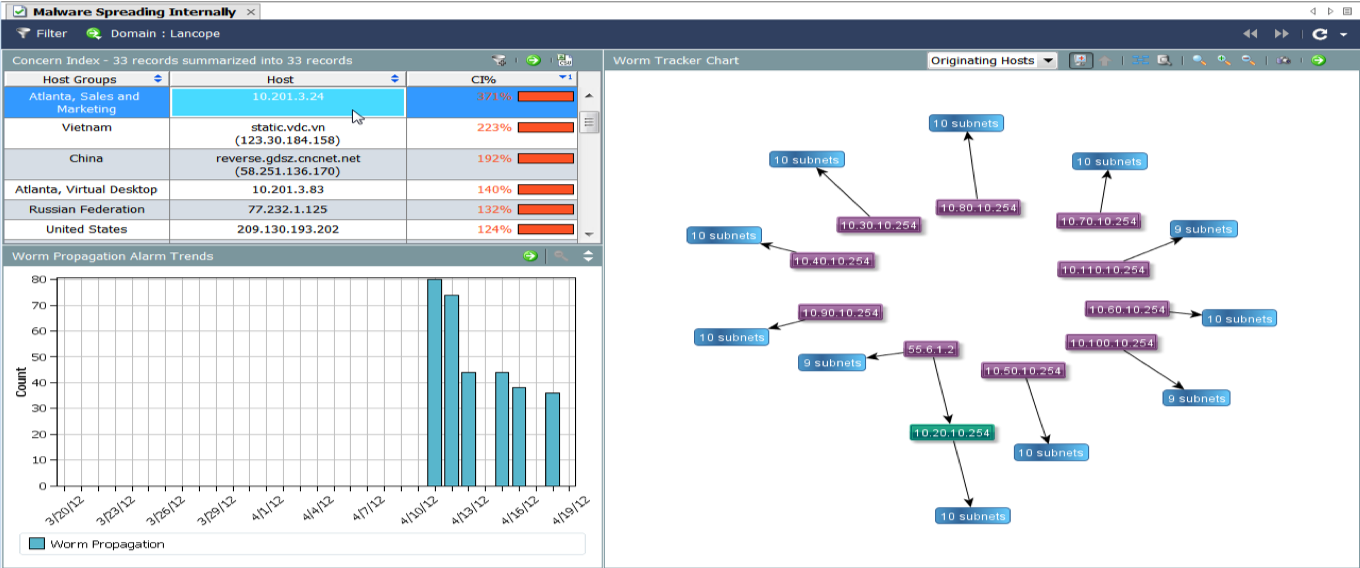
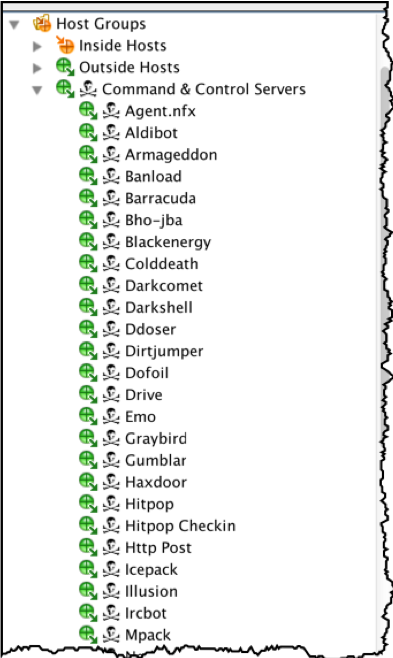
The second case, which shows the power of Stealthwatch, is the detection of interaction with command servers of botnets and malware. It would seem that this can be done on the perimeter, but let's remember what this note began with. You can attack a user today in a bunch of different ways and not always through the perimeter. What if the cryptographer made his way inside the network through unprotected Wi-Fi and through it leaks information or receives updates for malicious code? This can only be fixed by monitoring internal network traffic and Stealthwatch is irreplaceable here. Previously, we performed this task using nfdump, but it had one limitation - we had to manually update the list of IP addresses of command servers, collecting it from different sources. In the case of Stealthwatch, this problem is solved automatically - it regularly loads updated compromise indicators containing information about the management servers. The usefulness of this feature is that it keeps track of the obsolescence of addresses from the list and removes them as needed. In the case of nfdump, you had to do it manually, which took precious time.
Detection of denial of service attacks is another popular use case that we use on our network. This is not to say that such incidents occur regularly, but it happens. “Floods”, “storms”, “avalanches” of requests for various network and application protocols are quite easily detected using Stealthwatch.
Network Traffic Analysis class solutions, which include Stealthwatch, do not have DLP functionality and are not able to monitor the content of correspondence using various protocols. However, they are ways to deal with information leaks, which uses a slightly different principle. Considering that within the framework of Netflow, you can track the amount of information transmitted, we can, for each node or user, set some average values of the amount of information using different protocols that the user can download or upload to the Internet. For example, for the HTTP protocol, this figure will be 100 MB per day.

Accordingly, the excess of this value will be considered an anomaly, and a significant excess, for example, 5 times or more, a clear violation of the information security policy. Uploading large amounts of data to cloud storage can mean that a user is trying to steal confidential information. Of course, I knowingly use the word “may”, as this may be a sign of quite legal activity, for example, the user sends a new software distribution or a set of documents or video training through the cloud. In any case, triggering a trigger on exceeding data thresholds should be a reason to conduct an investigation.

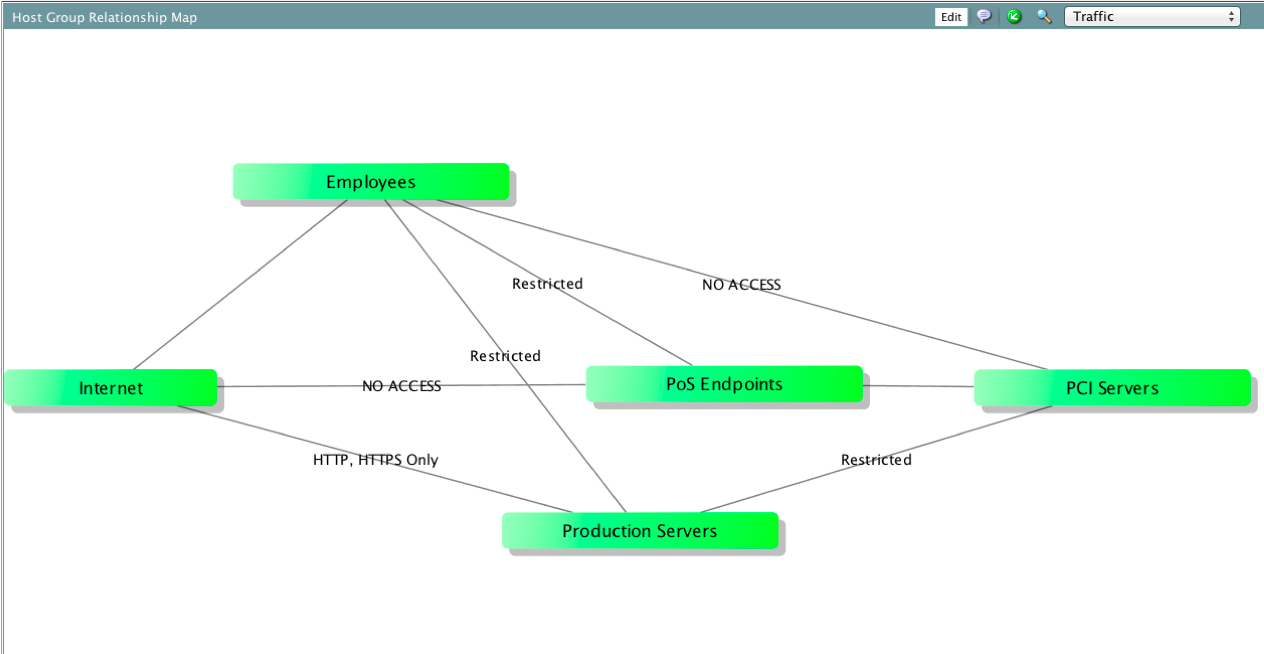
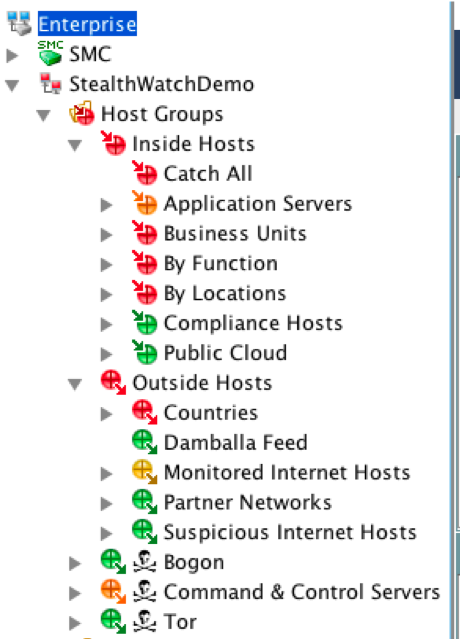
Another scenario that we actively use in our network with respect to Stealthwatch is to check the configuration of access control rules for tracking unauthorized traffic between segments. Segmentation is one of the most useful tools in the arsenal of information security services, which allows you to significantly reduce the attack area, locate problems, quickly conduct investigations, etc. In our network, segmentation is actively used on the basis of network equipment, and is managed by Cisco ISE. With the help of Stealthwatch, we check the correctness of the segmentation settings and see traffic that should not appear in this or that segment.
The same feature allows you to check the correctness of firewall settings that are on the perimeter and, possibly, allow some unauthorized traffic to pass through. In essence, the Stealthwatch in this use case turns into an additional tool for controlling the actions of administrators.
Stealthwatch is a solution that, although it can be used by networkers and IT specialists, is intended for security personnel. At Cisco, they are handled by the Cisco CSIRT incident response service. We collect data from 180 key network devices installed in data centers, large corporate hubs and in the DMZ, receiving approximately 180,000 flows per second.
In one of the last notes, I already wrote about the presence of an API in our products. This API is also found in Stealthwatch and is very actively used by our incident response service. In particular, it is through the API that we update information about the nodes included in certain groups.
It is through the API that we update information about new malicious sites, interaction with which is monitored using Stealthwatch. Using the API, we integrate Stealthwatch with the Threat Intelligence CRiTS platform we use for open source. This allows us, when receiving data on new indicators of compromise, to distribute this information on all security tools integrated with CRiTS through the API.
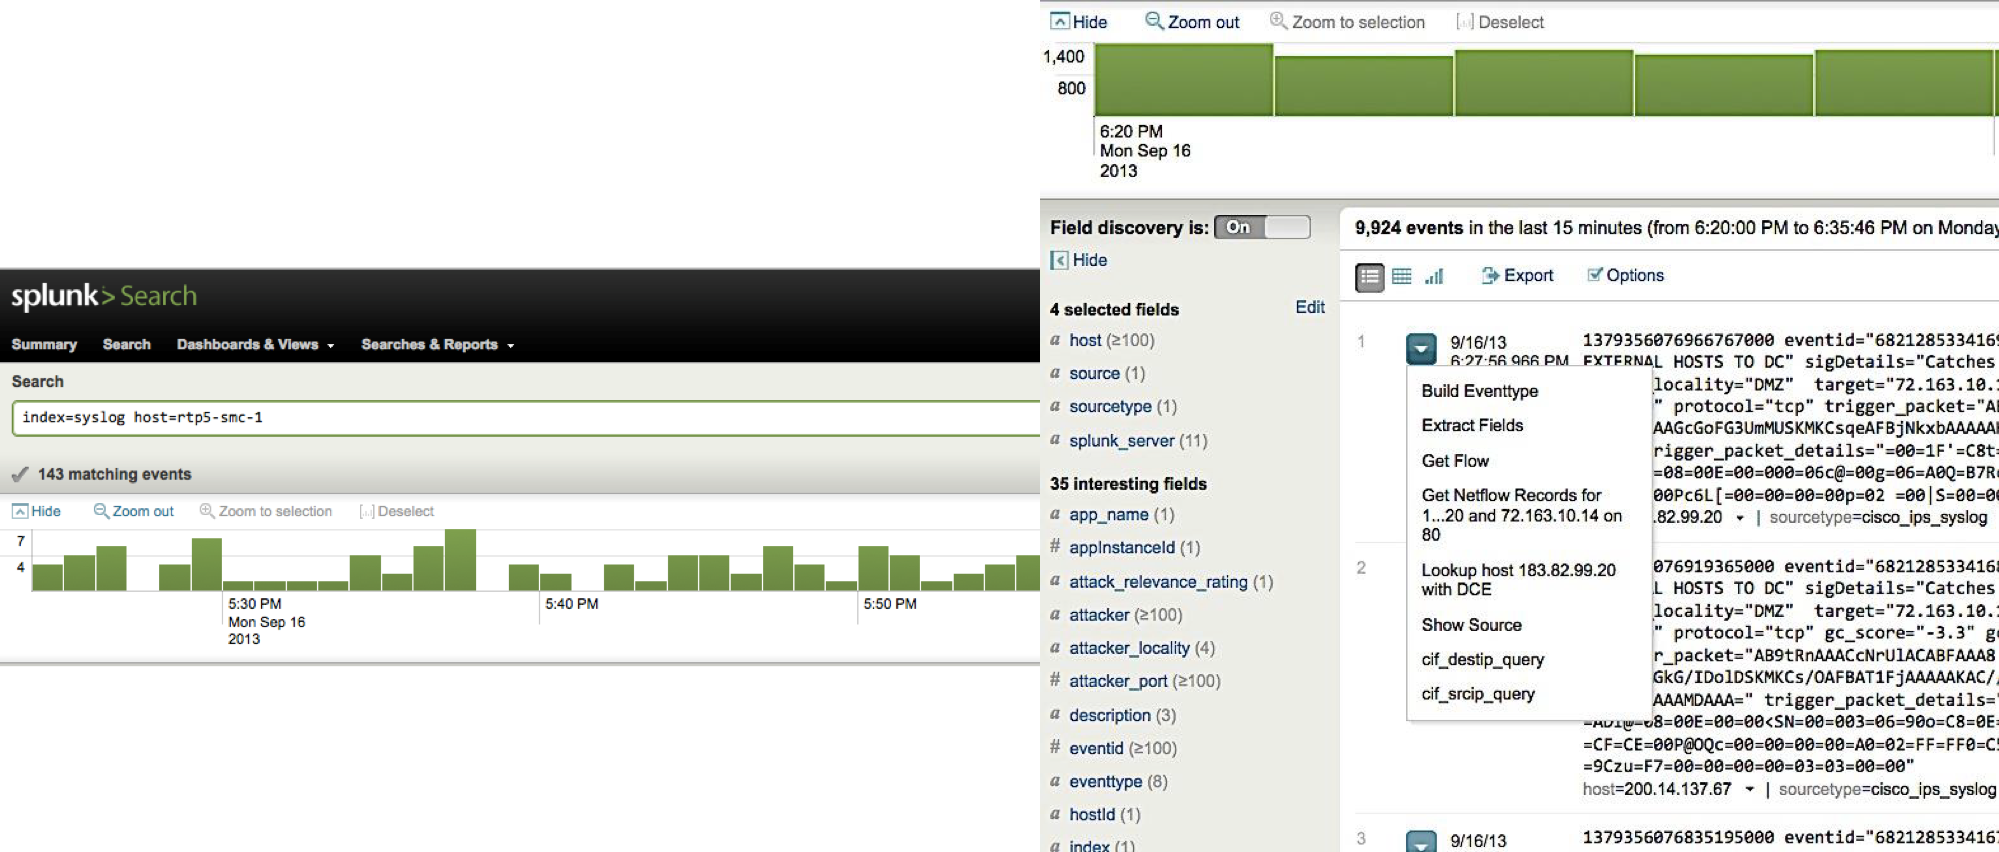
The API also allows you to collect from Stealthwatch the events and streams we need to send them to Splunk, which is the main monitoring tool at Cisco, including for conducting more detailed investigations.
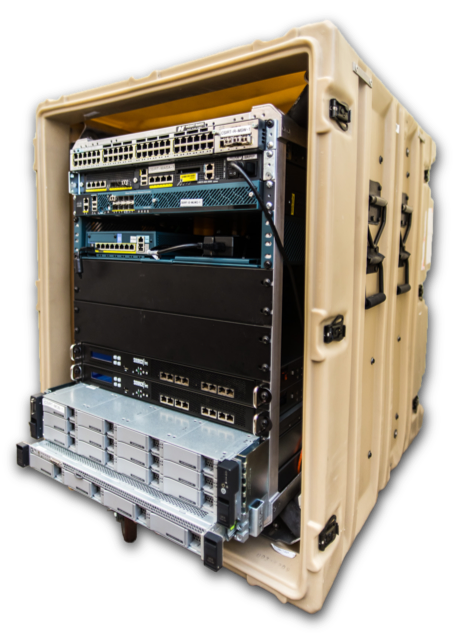
An interesting experience that I haven’t met anywhere else is the concept of a mobile SOC (Security Operations Center), which we use to monitor IS at remote sites, companies we buy, new factories, partners or when conducting investigations at sites that are not connected to central monitoring system. Mobile SOC is a transported rack with IB equipment, which includes not only the Stealthwatch, but also the Netflow Generation Appliance, Splunk, Firepower, Web Security Appliance, etc.
We are not satisfied with what has already been achieved and we plan to actively develop the use of Stealthwatch in our infrastructure. Among the priority plans:
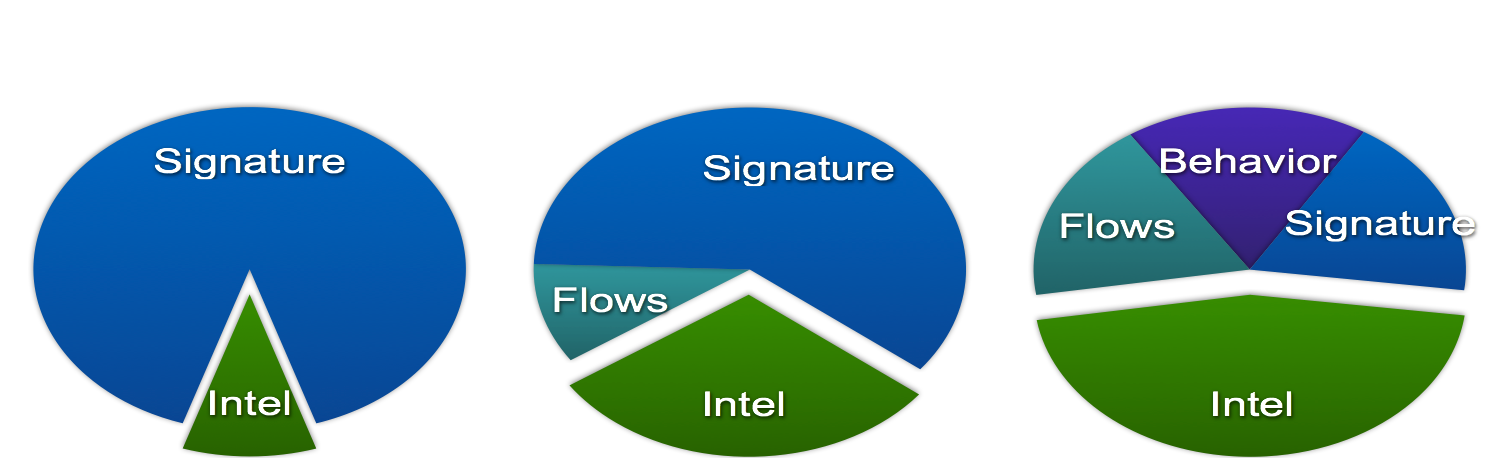
In general, we must admit that the analysis of Netflow using Stealthwatch helps our information security service to detect more incidents than the usual set of security tools used on the perimeter of the corporate network. You can track the dynamics of changes in the sources of data on incidents that occur in our country. If earlier it was predominantly signatures of attacks from IDS, then today this source accounts for only one fifth of all incidents. Another fifth accounts for behavioral analysis, 40% for indicators of compromise. Detection of the remaining 20% of incidents is based on Netflow.
- Stealthwatch's Cisco Success Story (Eng.)
- a story about the use of Stealthwatch in Cisco by the head of CSIRT (video, eng.)
- The Stealthwatch page on Cisco
- threat prevention
- threat detection
- threat response.
Whatever solutions we consider, they fit into these three tasks, which we must implement anywhere in the corporate network. It is this life cycle of dealing with threats (BEFORE DURING AFTER) and forms the basis of the activities of the information security service of Cisco. And I’ll note that since Cisco doesn’t have a perimeter concept, we try to implement the three tasks described above everywhere - in data centers, in the clouds, in the Wi-Fi segment, on employees ’mobile devices, at Internet access points and, of course in our internal network, the monitoring of which we will talk about today.
Why do I need to monitor the internal network?
After all, we don’t have such a question about the perimeter (why we don’t have a perimeter, I’ll tell you some other time), where we put ITU, IDS, content filtering tools and many other network security tools. Why should the internal network be an exception? What, you can not get into it from the outside, bypassing the perimeter? Yes, a bunch of ways. Through unprotected own Wi-Fi or through the access point of the neighboring “Chocolate Girl”, to which the mobile devices of your employees who are used to pick up a cup of hot coffee or dine are automatically connected. Through the hacked home laptop or tablet / smartphone manual that dragged him to the office to “IT pros figure out”. Through a USB flash drive thrown to the office, on which a non-detectable malicious code is flooded. Through an encrypted channel of the client-server application, which was developed without considering security issues. Yes, through the perimeter vulnerabilities in the end (let us not assume that our ITU is absolutely invulnerable). That is, the internal network needs the same protection as the perimeter, on which many organizations unnecessarily often focus their defense efforts, completely forgetting about the truth about the weakest link.
')
Is IDS not enough?
I have already told you how threats are prevented in the internal Cisco network - we use the Cisco Identity Service Engine (ISE) for this, which performs the function of a distributed ITU that turns each switch or router, and we have only the last over 40 thousand, into a part of the internal access control working on dynamic policies. But differentiation and prevention alone are not enough for us. We must also monitor activity within the framework of permitted intra-connections, as well as monitor any violations of the established rules of internal access (we are all human, it is natural for all of us to make mistakes). At the perimeter, we would install an intrusion detection system (IDS) and solve this problem. It’s not easy to install IDS on the internal network, although Cisco would be happy to sell as many sensors as possible to our Cisco NGIPS, especially since we once again became the leader of this market according to Gartner. But this is often impossible (except for some places within the network such as data centers or individual segments). It is also impossible from an architectural point of view - not every switch port can have an IDS sensor, not every trunk or span port to which IDS often connects will pull traffic from all switch ports, the span port is not always free. It is also impossible from the point of view of finance - it is too expensive to buy high-performance sensors for each switch or router. Even at Cisco, despite the fact that we ourselves produce NGIPS, we cannot spend a lot of money on monitoring using our internal network's IDS - this is quite expensive. Even if you try to use splitters (tap), they will not solve all the problems either in terms of architecture or in terms of finance. In addition, if on the perimeter the security guards still somehow learned to live with IT people (networkers), then on the internal network the conflict continues to smolder. Do we have an alternative to the classic network IDS to solve the same problem?
How to monitor the internal network without IDS?
The answer will be yes and it is called Netflow. This is a protocol that was originally developed by Cisco for the purpose of detecting problems on the network (troop troubleshooting), which then became the de facto standard for many network manufacturers who either supported Netflow in their equipment or created its clones — Cflow, sFlow, Jflow, NetStream, Rflow, etc. But since today we are talking about how the internal Cisco network is monitored, and we use our same network equipment, we will focus only on the Netflow protocol, which today has almost any normal network hardware of corporate level (from all sorts of “home”) There is no need to wait for devices to support Netflow - at home it simply does not need it and will only make the decision more expensive and expensive.
So, Netflow on network equipment, through which all traffic that requires control, passes. This means that we can try to use it not only to detect any problems in the network, but also for information security purposes. In addition, support for Netflow network equipment allows us not to build a separate, superimposed network for monitoring purposes, but allows the already used network equipment to be used for information security tasks. This, on the one hand, protects the already made investments and reduces the cost of the monitoring solution, and on the other hand, makes it simpler in terms of architecture and implementation - no need to try to properly direct the flows we need to tens or hundreds of IDS sensors, which otherwise would have been forced to put in your network. Working with Netflow gives us one more, not immediately visible advantage. In the case of installing conventional IDS, we have to solve the problem of directing traffic or its copy to the sensors of the protection system. If for some reason this does not happen (for example, due to a change in topology or lack of bandwidth at the sensor), then we absolutely will not see anything and we will think that there are no attacks in the traffic of interest to us. The sensor itself is working - only it does not receive and does not analyze the necessary traffic. With Netflow, this does not work - we see everything that flows through a network device, which can be not only a router or switch (including virtual ones), but also, for example, a firewall (for example, the Cisco ASA supports the NSEL function, Netflow Security Event Logging, which allows you to broadcast network streams as Netflow for analysis with an appropriate monitoring tool.
It's time to make a couple of comments about Netflow, which were obtained as a result of operating Netflow for security purposes on a Cisco network. First, you need to know that Netflow can be un-sampled and sampled. The differences between them are the same as if you read the complete book “from cover to cover” or scroll through it, stopping only on every tenth page. Many network devices support Netflow, but only sampled, which is not suitable for security purposes, since we see only a small part of all the traffic we need to monitor. So pay attention to which Netflow you support. Sampled for information security purposes is not suitable. Secondly, you need to know that processing Netflow, especially un-sampled, creates a load on the processor of a network device, which must be taken into account when planning a network and building a monitoring system for information security systems based on Netflow. If your switches or routers are already working at the limit of their strength and their CPU load reaches 80-90% in normal operation, then it’s worth ten times to think whether to include Netflow on them, because of which the device’s performance will definitely get even higher. There are two solutions in this situation - updating the network infrastructure (anyway, sooner or later it would have to be done) and the use of Netflow generation devices. We at Cisco used both options. In cases where monitoring Netflow was a critical task and the time came for an upgrade, we installed new switches and marchers with Netflow hardware processing that does not load the CPU. In other cases, we used a solution called FlowSensor, which passed traffic through itself (analogue of the splitter, tap) translated into Netflow, passed on for analysis by our security service.
What can Netflow tell us?
There are several versions of the Netflow protocol, the most common of which today are the 5th and 9th. Based on the latter, an open IPFIX specification was developed. Version 5 of the protocol allows you to collect the following information about network traffic:
- Source address
- Destination Address
- Source port for UDP and TCP
- Destination port for UDP and TCP
- Message Type and Code for ICMP
- IP protocol number
- Network interface (ifindex SNMP parameter)
- Type of Service Value
- Timing options
- Size of bytes and packets transmitted
- TCP flag values
- Route information
- Information about autonomous systems.
Version 9 supports additional fields related to IPv6, MPLS, BGP. There are also extended versions of Netflow, the same IPFIX, Flexible Netflow, which support custom fields.
At first glance, this information is superficial and reflects only what is in the headers of network sessions, but in fact, as we already saw in the story about encrypted traffic analysis (ETA) technology, in many cases it is enough to classify and recognize traffic. For example, an excessively large number of packets or bytes may characterize DoS, a large number of destination addresses within a limited time interval may mean a network scan, etc. With Netflow, you can profile nodes and track deviations from their standard behavior.
How did we monitor our network before?
Initially, Cisco used free nfdump solutions ( https://github.com/phaag/nfdump ) and OSU FlowTools for monitoring (OSU is an abbreviation of Ohio State University), allowing you to work with Netflow - filter, sample and perform other operations on network streams. Both solutions are fast enough (they can process several dozen gigabytes of streams per day), are easy to use for those who already have experience with classic tools like tcpdump, and are flexible in filtering. But these tools have problems that can be broken down into three parts. Firstly, these are the shortcomings of the utilities themselves, which did not allow, for example, to aggregate the flows normally, which often leads to their duplication (imagine that the same flow passes through 5 network devices — the utilities will also see them and write them 5 times). In addition, nfdump and Flow Tools did not allow to monitor the loss of flows, which led to a sense of false security (paraphrasing the classic phrase from the movie “DMB”, “you think you see the flow, but not really”). In a small network, this is not so critical, but in such a distributed one as in Cisco, it began to create great difficulties as the implementation of the monitoring system expanded at new sites. Secondly, any open source project has difficulties associated with supporting, adding new features, expanding the number of supported versions of Netflow, etc. Finally, working with nfdump and OSU Flow Tools required not only high qualifications from the staff, but also considerable efforts to automate typical and routine tasks related to incident investigation and response.
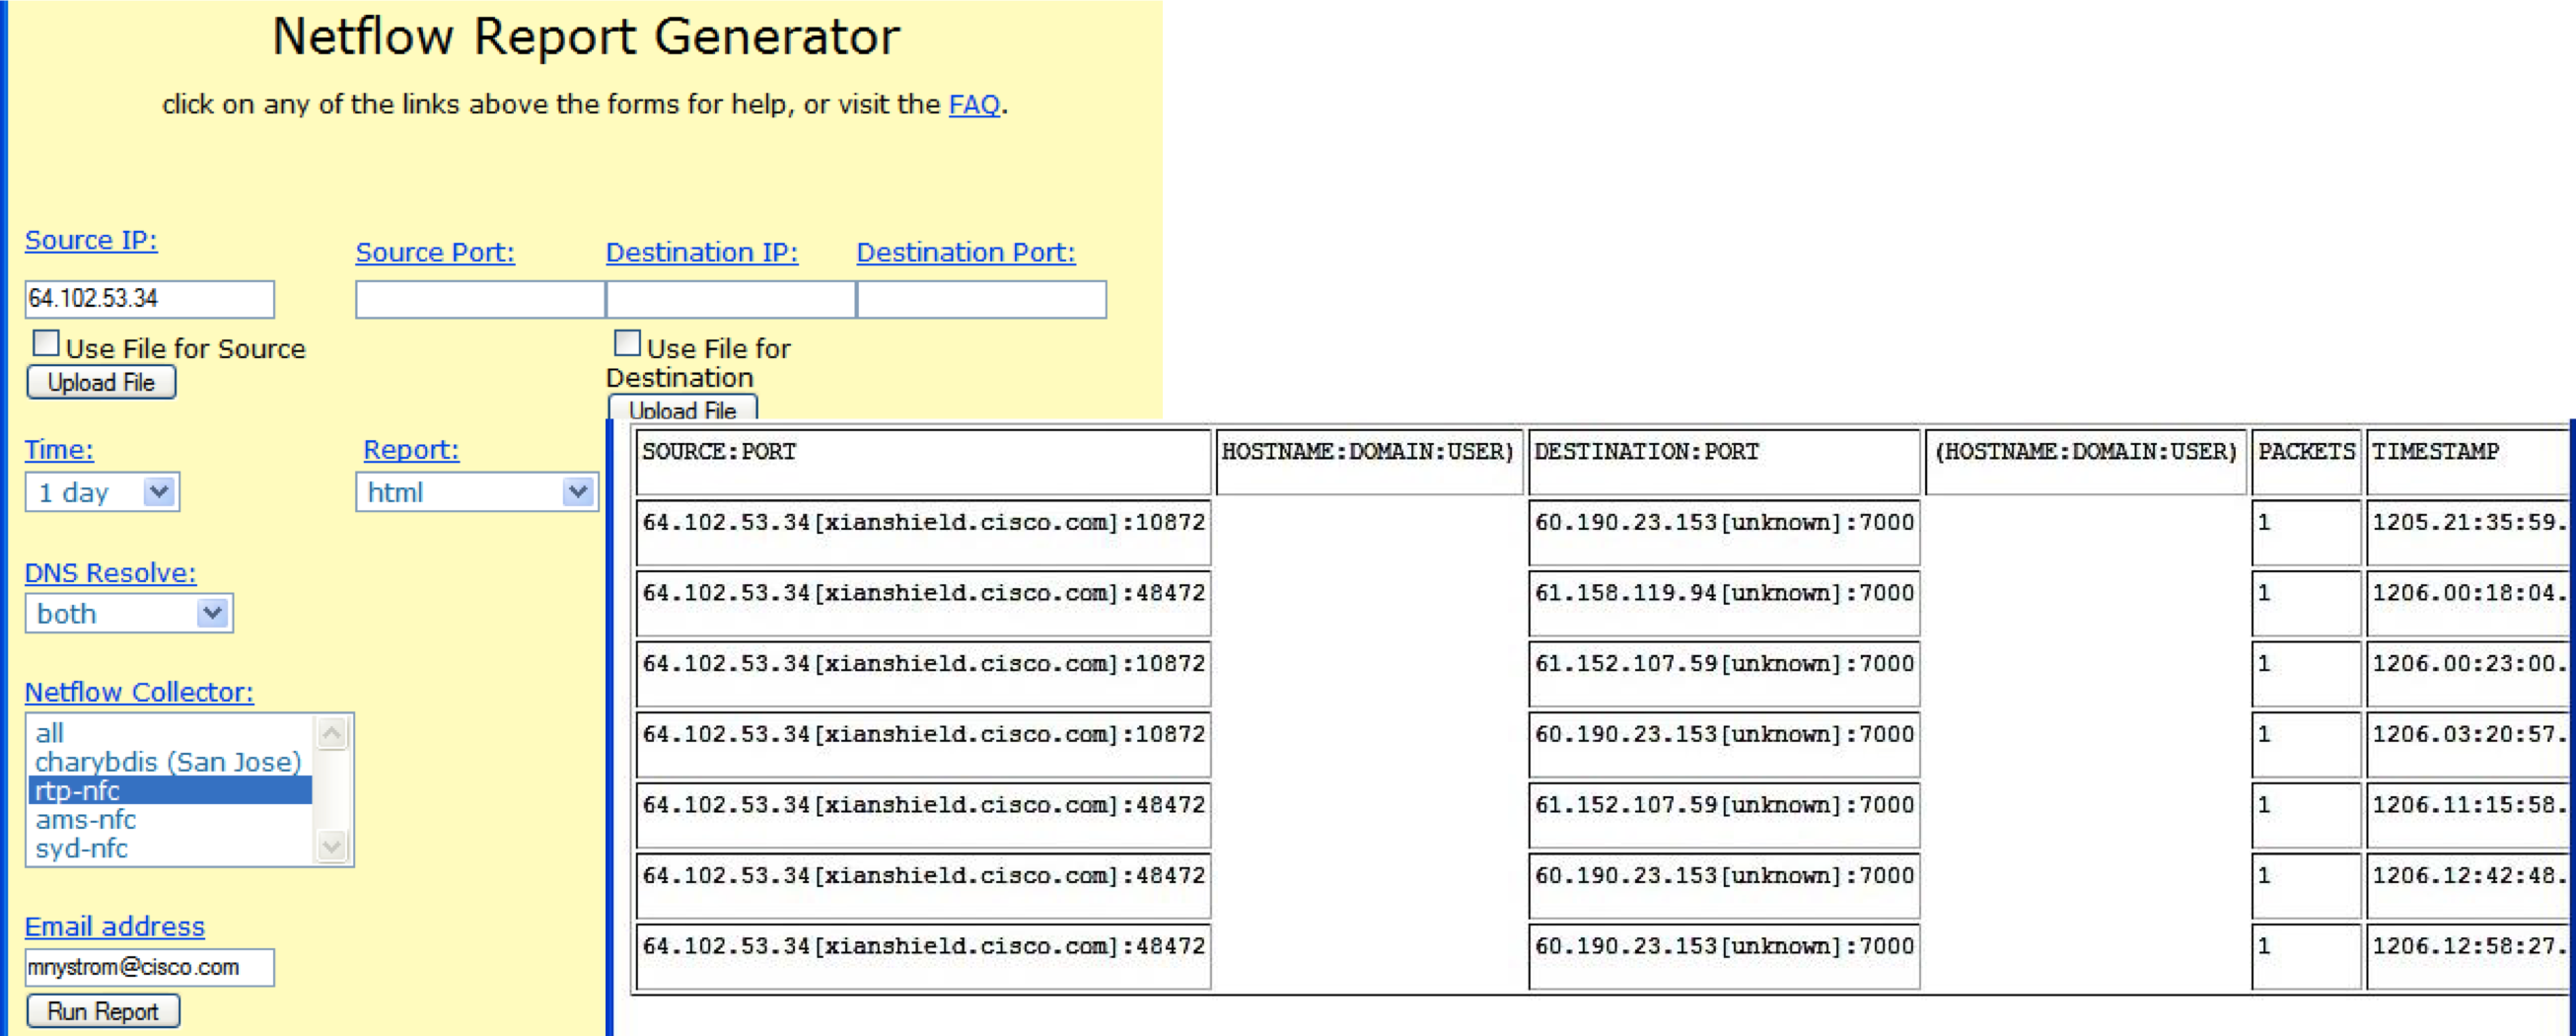
For example, to detect infected internal machines that communicate with command servers, you need to create and maintain a relevant list in the Cisco ACL format, and then submit it to the input of flow-filter utilities, which will apply it to collected Netflow streams.
[mynfchost]$ head bot.acl ip access-list standard bot permit host 69.50.180.3 ip access-list standard bot permit host 66.182.153.176 [mynfchost]$ flow-cat /var/local/flows/data/2007-02-12/ft* | flow-filter -S bot.acl Start End Sif SrcIPaddress SrcP DIf DstIPaddress DstP 0213.08:39:49.911 0213.08:40:34.519 58 10.10.71.100 8343 98 69.50.180.3 31337 0213.08:40:33.590 0213.08:40:42.294 98 69.50.180.3 31337 58 10.10.71.100 83 It is clear that in order to work effectively, you need to keep up to date a multitude of previously created lists - attacking, C & C servers, internal nodes, segmented by various criteria, etc. In this case, the last list itself will constantly change due to the variability of the dynamic infrastructure of Cisco.
Another problem with the use of nfdump and OSU Flow Tools is the inability to recognize who initiated a particular connection (this is important during an investigation), since the flows are unidirectional. We have to carry out additional work in order to understand who was the first in client-server connections. Finally, we stumbled upon another subtlety associated with the work of these utilities. They record only completed streams, which can lead to the inability to quickly track attacks that occur in real time. For example, the attacker has already performed a network scan, node compromise and penetration, but neither nfdump nor Flow Tools is aware of this, since the network flow has not been fixed by them.
What do we use now?
After gaining experience with nfdump and OSU Flow Tools and as we move to IPv6 and Netflow version 9, we began to look for a tool that lacks the flaws we have encountered. It was Lancope's Stealthwatch solution, which we later acquired and it became part of Cisco. Stealthwatch is built according to the “sensor - collector - analyzer” architecture, which is classical for any analyzer.
As sensors, we use our network infrastructure, which passes all internal network traffic through itself, translates it into Netflow and transmits it to collectors for analysis. As I wrote above, the network equipment does not always support Netflow or is able to process it effectively. For this task, we use separate hardware or virtual FlowSensors (we have 13 of them altogether). Considering the geographically distributed infrastructure of Cisco, we reduce not all of one flow to one or two collectors, but a whole distributed cluster of 21 FlowCollectors that process about 20 billion Netflow flows every day in search of malicious activity in our corporate backbone and data centers. And we have only two consoles - they are accessed by Cisco incident response staff in accordance with their roles
Use case
Perhaps the main obstacle to the effective use of open source monitoring tools Netflow in our network (yes, in general) was their lack of normal analytics. They have flexible filtering and sampling tools, but without a person they are not able to make a decision about the presence or absence of a problem in network flows. Stealthwatch was deprived of this drawback - its key advantage was the presence of a built-in database of algorithms that allowed Netflow to be assessed and recognize various security breaches - network scanning, DoS, distribution of malicious code, information leakage, etc.
Key scenarios in which we use Stealthwatch (in fact there are more):
- investigation
- detection of C & C interactions
- detection of DoS attacks
- data leak detection
- checking the settings of the rules of access control.
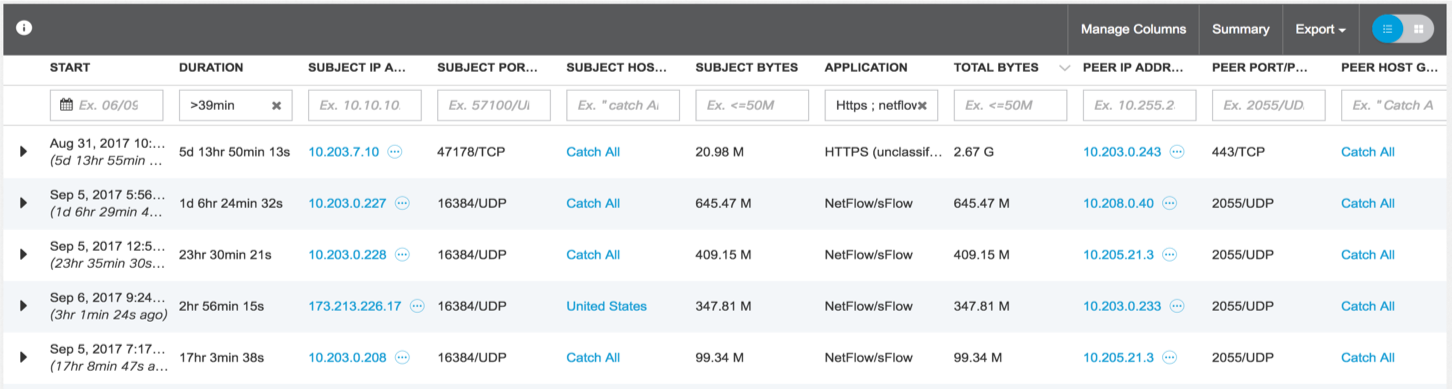
Netflow is an ideal source of information during incident investigation, which contains all the necessary information about who carried out what, when, and what kind of actions. At the same time, all this information is stored in a database, and the response service staff can make the necessary requests to it, filtering and sampling according to the required fields, and quickly finding answers to their questions. Integration with Cisco ISE provides information not only with reference to the IP addresses of the nodes participating in the incident, but also with reference to accounts of company users in Active Directory. The latter possibility is not only convenient, but also significantly reduces the time to match the user's name with his dynamic IP address, which he had at the moment of interest. Reducing time is a critical success factor in incident investigation.
The second case, which shows the power of Stealthwatch, is the detection of interaction with command servers of botnets and malware. It would seem that this can be done on the perimeter, but let's remember what this note began with. You can attack a user today in a bunch of different ways and not always through the perimeter. What if the cryptographer made his way inside the network through unprotected Wi-Fi and through it leaks information or receives updates for malicious code? This can only be fixed by monitoring internal network traffic and Stealthwatch is irreplaceable here. Previously, we performed this task using nfdump, but it had one limitation - we had to manually update the list of IP addresses of command servers, collecting it from different sources. In the case of Stealthwatch, this problem is solved automatically - it regularly loads updated compromise indicators containing information about the management servers. The usefulness of this feature is that it keeps track of the obsolescence of addresses from the list and removes them as needed. In the case of nfdump, you had to do it manually, which took precious time.
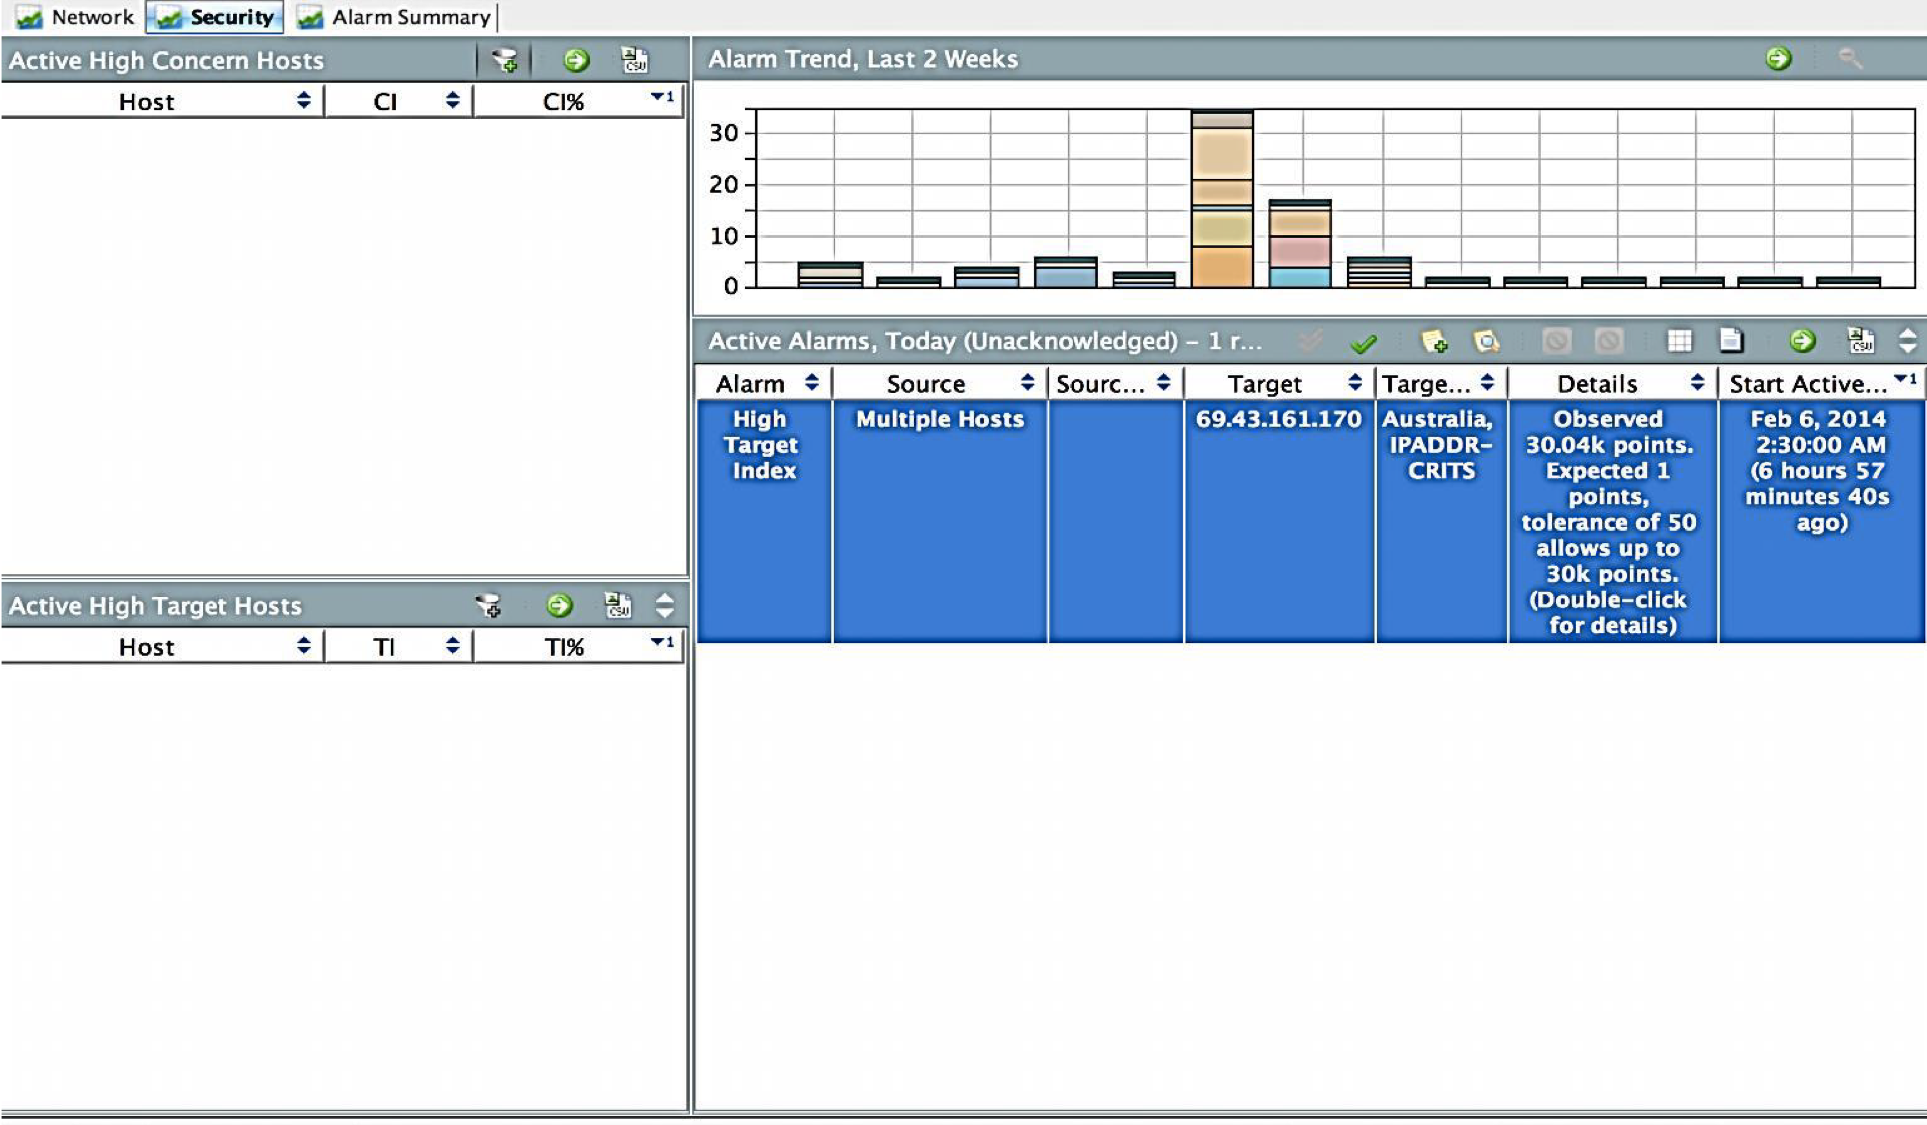
Detection of denial of service attacks is another popular use case that we use on our network. This is not to say that such incidents occur regularly, but it happens. “Floods”, “storms”, “avalanches” of requests for various network and application protocols are quite easily detected using Stealthwatch.
Network Traffic Analysis class solutions, which include Stealthwatch, do not have DLP functionality and are not able to monitor the content of correspondence using various protocols. However, they are ways to deal with information leaks, which uses a slightly different principle. Considering that within the framework of Netflow, you can track the amount of information transmitted, we can, for each node or user, set some average values of the amount of information using different protocols that the user can download or upload to the Internet. For example, for the HTTP protocol, this figure will be 100 MB per day.
Accordingly, the excess of this value will be considered an anomaly, and a significant excess, for example, 5 times or more, a clear violation of the information security policy. Uploading large amounts of data to cloud storage can mean that a user is trying to steal confidential information. Of course, I knowingly use the word “may”, as this may be a sign of quite legal activity, for example, the user sends a new software distribution or a set of documents or video training through the cloud. In any case, triggering a trigger on exceeding data thresholds should be a reason to conduct an investigation.
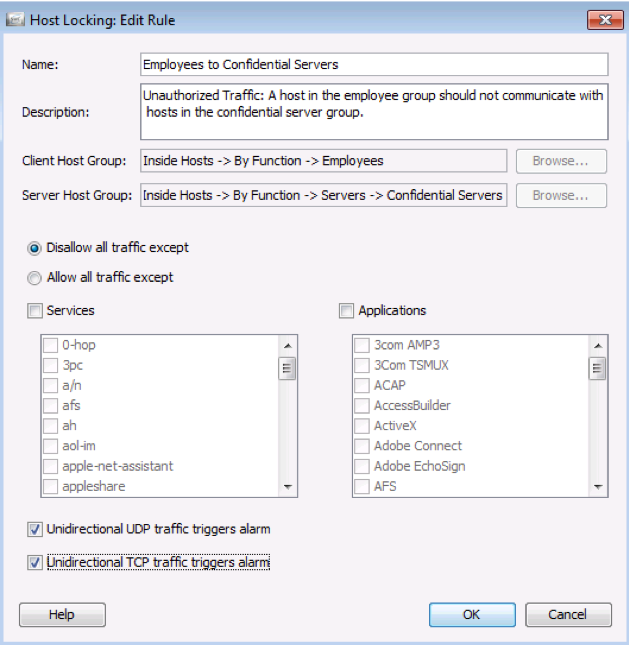
Another scenario that we actively use in our network with respect to Stealthwatch is to check the configuration of access control rules for tracking unauthorized traffic between segments. Segmentation is one of the most useful tools in the arsenal of information security services, which allows you to significantly reduce the attack area, locate problems, quickly conduct investigations, etc. In our network, segmentation is actively used on the basis of network equipment, and is managed by Cisco ISE. With the help of Stealthwatch, we check the correctness of the segmentation settings and see traffic that should not appear in this or that segment.
The same feature allows you to check the correctness of firewall settings that are on the perimeter and, possibly, allow some unauthorized traffic to pass through. In essence, the Stealthwatch in this use case turns into an additional tool for controlling the actions of administrators.
Who uses Stealthwatch where?
Stealthwatch is a solution that, although it can be used by networkers and IT specialists, is intended for security personnel. At Cisco, they are handled by the Cisco CSIRT incident response service. We collect data from 180 key network devices installed in data centers, large corporate hubs and in the DMZ, receiving approximately 180,000 flows per second.
In one of the last notes, I already wrote about the presence of an API in our products. This API is also found in Stealthwatch and is very actively used by our incident response service. In particular, it is through the API that we update information about the nodes included in certain groups.
It is through the API that we update information about new malicious sites, interaction with which is monitored using Stealthwatch. Using the API, we integrate Stealthwatch with the Threat Intelligence CRiTS platform we use for open source. This allows us, when receiving data on new indicators of compromise, to distribute this information on all security tools integrated with CRiTS through the API.
The API also allows you to collect from Stealthwatch the events and streams we need to send them to Splunk, which is the main monitoring tool at Cisco, including for conducting more detailed investigations.
An interesting experience that I haven’t met anywhere else is the concept of a mobile SOC (Security Operations Center), which we use to monitor IS at remote sites, companies we buy, new factories, partners or when conducting investigations at sites that are not connected to central monitoring system. Mobile SOC is a transported rack with IB equipment, which includes not only the Stealthwatch, but also the Netflow Generation Appliance, Splunk, Firepower, Web Security Appliance, etc.
Development plans
We are not satisfied with what has already been achieved and we plan to actively develop the use of Stealthwatch in our infrastructure. Among the priority plans:
- Continuing integration with ISE not only to obtain contextual information about the nodes and users involved in the incident, but also to implement the blocking function. In the future, through the ISE, a combination of Stealthwatch at the network level and AMP4E at the PC level should be implemented, which will allow to localize IS problems more quickly.
- As you move to the new version of Stealthwatch, Encrypted Traffic Analytics functions will automatically appear, allowing you to detect malicious code in encrypted traffic.
- Implementing Stealthwatch Cloud to monitor IaaS and PaaS cloud platforms that are actively used by Cisco.
- Integration with AnyConnect, which is implemented by every Cisco employee on his laptop, smartphone or laptop, in order to obtain data on the activity of users and applications in Netflow format and the correlation of this information with Netflow at the network level.
In general, we must admit that the analysis of Netflow using Stealthwatch helps our information security service to detect more incidents than the usual set of security tools used on the perimeter of the corporate network. You can track the dynamics of changes in the sources of data on incidents that occur in our country. If earlier it was predominantly signatures of attacks from IDS, then today this source accounts for only one fifth of all incidents. Another fifth accounts for behavioral analysis, 40% for indicators of compromise. Detection of the remaining 20% of incidents is based on Netflow.
Additional Information:
- Stealthwatch's Cisco Success Story (Eng.)
- a story about the use of Stealthwatch in Cisco by the head of CSIRT (video, eng.)
- The Stealthwatch page on Cisco
Source: https://habr.com/ru/post/348532/
All Articles