PowerAR - combine PowerBI and ARKit on the tabletop
Hi, Habr! Remember the recent Apple conference at which ARKit was presented? Oh, stop-stop, it's a Microsoft blog. Although, why not. After all, our partners decided to experiment and combine the new framework from Apple with the capabilities of the Microsoft PowerBi service. More under the cut!

I give the word to the author
')
ArKit technology harmoniously inserts virtual objects into the world around us, creating augmented reality and allowing you to interact with the world around in completely new ways.
Opportunities:
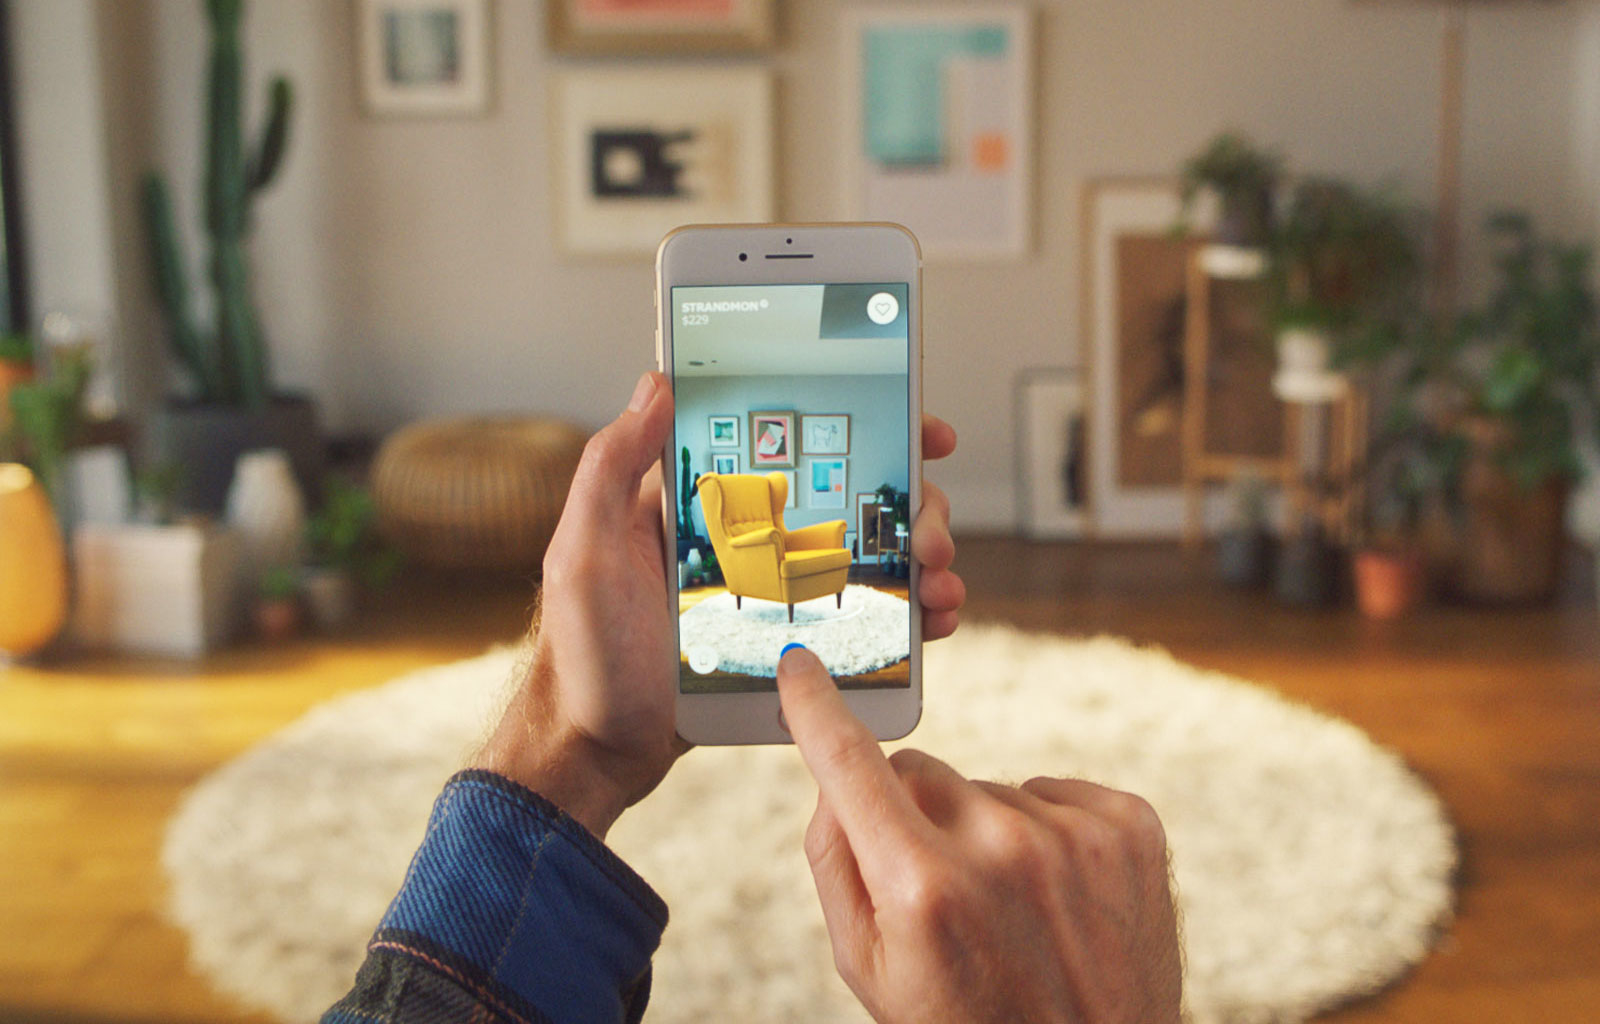
An excellent example of the implementation of this technology is the jointly created mobile application IKEA and Apple Place.
First of all, it is an opportunity to look at dozens of graphs from any angle. In fact, we have a new view of visibility. Also, these charts allow you to make beautiful covers for annual reports to investors, combining them in a photo along with company documents, without resorting to creating similar 3D layouts in photo editors.
In general, this application still serves as a concept that allows users to touch the future, in which augmented reality will more and more closely integrate with the real world.
It was decided to create a project on Swift 4. Some of our clients use the CSV format for transmitting data to PowerBI, which we decided to take as the basis for pulling data into the real world.
Sample lead visualization data:
Once a day, data is downloaded from Google Analytics and / or Ya.Metrika by API, collected into a CSV file and become available for download by our application by key. The application accesses the server, unloads the updated file, reads its contents and synchronizes data from it with those already accumulated in the smartphone. The initial download of the application pulls out all the CSV reports for the last 30 days.
Next comes the ARKit. The launch of the application is accompanied by the start of the session of the ARSession object, and then generates 3D models of the columns, calculating their height, based on the data from the CSV file.
ARKit, using computer vision, determines the surface and, in case of detection of the plane, allows you to place the data collected by the company in the form of 3D columns.
First, the definition of the planes. Now there is still a large percentage of the probability that the surface is not recognized. It only remains to wait for the increased accuracy of the work of the ARKit itself and to advise using animation in such applications in case of successful recognition of the table surface. You can create such a successful recognition indicator as follows:
Secondly, the interface. With applications using the camera, it is important to find a compromise between the number of elements on the screen and the intuitive control. In PowerAR, it was decided to use transparent buttons with a blur effect and leave only the addition / deletion of graphs, as well as the launch of settings.
Finally, optimization. Even the simplest application with ARKit consumes 50% of the CPU of the iPhone 7, which causes it to heat up and increase the discharge rate. The team spent almost 40% of the total development time in order to maximize the use of smartphone resources, especially on the A9 processor using 100 rendered columns, where all the resources available to the application initially went to this.
At the moment, the application is already available as a demo version on the App Store and requires iOS 11 installed. In the future, it is planned to add connection functions for external data sources for uploading (the beta version still has a preloaded data set) and expand the list of chart types for visualization. We are also finishing the testing of the iPad version of the application, which will further reveal the potential of viewing charts in the real world.
 Andrey Baranchikov is a leading developer of A-Teams . Since 2010, he has been developing iOS / Android applications and backends (Spring / JEE), starting with developing server software for streaming video processing from video surveillance cameras. One of the first in Russia released applications for Apple Watch and Apple TV.
Please note that now we are collecting applications for the international student competition Imagine Cup 2018. The winner can win $ 100K.
On the eve of the competition, we are conducting a series of hackathons where you can find a team or mentor, talk with experts and present your project to them. The closest of them will be devoted to the development of MR / VR and will be held February 9 - 10 in Moscow with the support of AVRA and TemoCentre. Join now .
I give the word to the author
')
Briefly about ARKit technology
ArKit technology harmoniously inserts virtual objects into the world around us, creating augmented reality and allowing you to interact with the world around in completely new ways.
Opportunities:
- tracking the position and facial expressions of faces, allowing you to impose any effects and transfer to 3D;
- use camera sensor and motion sensor to accurately track objects in the world using Visual Inertial Odometry (VIO);
- analysis of the image in the camera device on the horizontal and vertical surfaces (walls, ceiling) for placing on them virtual 3D objects;
- determining the degree of illumination of an object and applying it to a virtual object.
An excellent example of the implementation of this technology is the jointly created mobile application IKEA and Apple Place.
What will users of the application
First of all, it is an opportunity to look at dozens of graphs from any angle. In fact, we have a new view of visibility. Also, these charts allow you to make beautiful covers for annual reports to investors, combining them in a photo along with company documents, without resorting to creating similar 3D layouts in photo editors.
In general, this application still serves as a concept that allows users to touch the future, in which augmented reality will more and more closely integrate with the real world.
In particular, the creation of such an application was inspired by the concept from Meta.
Project start
It was decided to create a project on Swift 4. Some of our clients use the CSV format for transmitting data to PowerBI, which we decided to take as the basis for pulling data into the real world.
Sample lead visualization data:
Media,,,, Yandex/CPC,82,70,20,172 Google/CPC,73,50,33,156 Yandex/Organic,67,45,28,140 Google/Organic,85,65,17,167 Youtube,54,42,24,120 Vk.com,33,58,20,111 Once a day, data is downloaded from Google Analytics and / or Ya.Metrika by API, collected into a CSV file and become available for download by our application by key. The application accesses the server, unloads the updated file, reads its contents and synchronizes data from it with those already accumulated in the smartphone. The initial download of the application pulls out all the CSV reports for the last 30 days.
func generateNumbers(fromDataWithIndex index: Int) -> [[Double]]? { let resourceName = String(format: "PowerBI_CSV", index) guard let dataPath = Bundle.main.path(forResource: resourceName, ofType: "csv") else { print(String(format: "Could Not Load Data %@", resourceName)) return nil } var data = [[Double]]() if let dataString = try? String(contentsOfFile: dataPath) { let lines = dataString.components(separatedBy: "\n") let headerEntries = lines[0].components(separatedBy: ",") for line in lines[1...] { let lineEntries = line.components(separatedBy: ",") if lineEntries.count == headerEntries.count { data.append(lineEntries[1...].map({ Double($0) ?? 0.0 })) } } } return data } Next comes the ARKit. The launch of the application is accompanied by the start of the session of the ARSession object, and then generates 3D models of the columns, calculating their height, based on the data from the CSV file.
var session: ARSession { return sceneView.session } override func viewDidLoad() { super.viewDidLoad() sceneView.delegate = self sceneView.scene = SCNScene() sceneView.showsStatistics = false sceneView.antialiasingMode = .multisampling4X sceneView.automaticallyUpdatesLighting = false sceneView.contentScaleFactor = 1.0 sceneView.preferredFramesPerSecond = 60 DispatchQueue.main.async { self.screenCenter = self.sceneView.bounds.mid } if let camera = sceneView.pointOfView?.camera { camera.wantsHDR = true camera.wantsExposureAdaptation = true camera.exposureOffset = -1 camera.minimumExposure = -1 } } ARKit, using computer vision, determines the surface and, in case of detection of the plane, allows you to place the data collected by the company in the form of 3D columns.
The difficulties that have arisen, and the solutions that are found
First, the definition of the planes. Now there is still a large percentage of the probability that the surface is not recognized. It only remains to wait for the increased accuracy of the work of the ARKit itself and to advise using animation in such applications in case of successful recognition of the table surface. You can create such a successful recognition indicator as follows:
/* s1 s2 _ _ s3 | | s4 s5 | | s6 - - s7 s8 */ let sl: Float = 0.5 let st = focusSquareThickness let c: Float = focusSquareThickness / 2 let s1 = FocusSquareSegment(name: "s1", width: sl, thickness: st, color: focusSquareColor) let s2 = FocusSquareSegment(name: "s2", width: sl, thickness: st, color: focusSquareColor) let s3 = FocusSquareSegment(name: "s3", width: sl, thickness: st, color: focusSquareColor, vertical: true) let s4 = FocusSquareSegment(name: "s4", width: sl, thickness: st, color: focusSquareColor, vertical: true) let s5 = FocusSquareSegment(name: "s5", width: sl, thickness: st, color: focusSquareColor, vertical: true) let s6 = FocusSquareSegment(name: "s6", width: sl, thickness: st, color: focusSquareColor, vertical: true) let s7 = FocusSquareSegment(name: "s7", width: sl, thickness: st, color: focusSquareColor) let s8 = FocusSquareSegment(name: "s8", width: sl, thickness: st, color: focusSquareColor) s1.position += SCNVector3Make(-(sl / 2 - c), -(sl - c), 0) s2.position += SCNVector3Make(sl / 2 - c, -(sl - c), 0) s3.position += SCNVector3Make(-sl, -sl / 2, 0) s4.position += SCNVector3Make(sl, -sl / 2, 0) s5.position += SCNVector3Make(-sl, sl / 2, 0) s6.position += SCNVector3Make(sl, sl / 2, 0) s7.position += SCNVector3Make(-(sl / 2 - c), sl - c, 0) s8.position += SCNVector3Make(sl / 2 - c, sl - c, 0) Secondly, the interface. With applications using the camera, it is important to find a compromise between the number of elements on the screen and the intuitive control. In PowerAR, it was decided to use transparent buttons with a blur effect and leave only the addition / deletion of graphs, as well as the launch of settings.
@IBOutlet weak var settingsButton: UIButton! let blurSettings = UIVisualEffectView(effect: UIBlurEffect(style: UIBlurEffectStyle.light)) blurSettings.frame = settingsButton.bounds blurSettings.isUserInteractionEnabled = false settingsButton.insertSubview(blurSettings, at: 0) settingsButton.layer.cornerRadius = 15.0 settingsButton.clipsToBounds = true Finally, optimization. Even the simplest application with ARKit consumes 50% of the CPU of the iPhone 7, which causes it to heat up and increase the discharge rate. The team spent almost 40% of the total development time in order to maximize the use of smartphone resources, especially on the A9 processor using 100 rendered columns, where all the resources available to the application initially went to this.
Total
At the moment, the application is already available as a demo version on the App Store and requires iOS 11 installed. In the future, it is planned to add connection functions for external data sources for uploading (the beta version still has a preloaded data set) and expand the list of chart types for visualization. We are also finishing the testing of the iPad version of the application, which will further reveal the potential of viewing charts in the real world.
about the author
Andrey Baranchikov is a leading developer of A-Teams . Since 2010, he has been developing iOS / Android applications and backends (Spring / JEE), starting with developing server software for streaming video processing from video surveillance cameras. One of the first in Russia released applications for Apple Watch and Apple TV.Mixed Reality Imagine Hack
Please note that now we are collecting applications for the international student competition Imagine Cup 2018. The winner can win $ 100K.
On the eve of the competition, we are conducting a series of hackathons where you can find a team or mentor, talk with experts and present your project to them. The closest of them will be devoted to the development of MR / VR and will be held February 9 - 10 in Moscow with the support of AVRA and TemoCentre. Join now .
Source: https://habr.com/ru/post/348522/
All Articles