pdbe is an assistant to the built-in python debugger and debugging process
Hi, Habrahabr! In this article I’ll share my own debugging experience of a large unfamiliar system, but from the actual written tool - pdbe . From the very beginning of the project he will help to understand the flow of code execution in the project. If you're wondering what is hidden under the hood and what features you can use - please under the cat.
What is pdbe
pdbe is an assistant to the built-in Python debugger pdb , allows you to insert breakpoint (stop the program for subsequent debugging) for each function in any file in your project, into all files in a specified directory or into all files that are hidden in all directories (recursively bypasses all directories in search of files).
In the arsenal of pdbe, other interesting features are hidden that will make its use (and therefore debug, maybe even more) more pleasant and convenient.
Motivation
There are different situations in development, when you have to study already written code that has been supported for several years - at work, open source solutions and frameworks. It's hard to know where to start and how it works.
')
For myself, I discovered pdbe - the ability to insert a breakpoint into each function of a project, start a project, provoke server processing (for example, refresh a page, call a library function, open sockets) and start debugging a project from the very beginning of the process to the end of the request processing, stopping at each functions for its study.
There are other options - you already know the project, but debugging the code is still difficult, because it is ideal to remember how everything inside works hard. Then you can “ask” pdbe to insert breakpoints only in a separate project application.
Installation
Everything is simple here, the package is written in Python, so you can install using pip.
$ pip3 install pdbe How to use
To make it easier to understand the principles of operation, suppose that we have the following code in all the python files of the project, as an example of which you will see the working capacity of pdbe .
def first_function(): ... def second_function(): ... def third_function(): ... Main features
Import breakpoints as import pdb; pdb.set_trace () to the specified file (for the file the --file flag).
$ pdbe --file project/file_flag.py 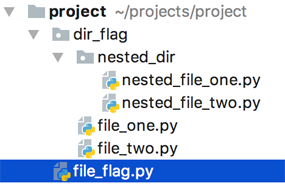
( Illustration of the debugging coverage of the following files on the example of the project )
As a result, we get the following.
def first_function(): import pdb; pdb.set_trace() ... def second_function(): import pdb; pdb.set_trace() ... def third_function(): import pdb; pdb.set_trace() ... To return the file to its original state, use the additional flag --clear . All commands of this kind have the ability to clear files from breakpoint.
$ pdbe --file project/file_flag.py --clear As mentioned above, it is sometimes necessary to debug a part of an application (a folder in which there are several files), then you should use the --dir flag .
$ pdbe --dir project/dir_flag 
( Illustration of the debugging coverage of the following files on the example of the project )
As a result, all files in the specified directory will have the expression import pdb; pdb.set_trace () under each function existing in them.
The same principle applies to the directory in which subfolders with files can be hidden (the --ew flag is an abbreviation of the word everywhere ).
$ pdbe --ew project In this case, all the attached files will have breakpoints inside.
If you are already in the project, you can use a dot instead of a folder.
$ pdbe --ew . 
( Illustration of the debugging coverage of the following files on the example of the project )
Advanced level
You can save the state (the actual state of the files) of your debug. This is when you ask to remember where your breakpoints are now, so that in the future, when you remove them from there, return to them again with just one or two pdbe commands. Let's discuss on an example.
def first_function(): ... def second_function(): ... def third_function(): ... As you already know, the pdbe --file path / to / file.py command will turn the file into the following.
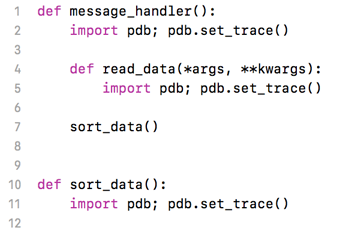
def first_function(): import pdb; pdb.set_trace() ... def second_function(): import pdb; pdb.set_trace() ... def third_function(): import pdb; pdb.set_trace() ... Remember that we have added breakpoints to this file and give this debug state a name. For example, if a file contains message processing logic, you can write like this.
$ pdbe --commit 'Message handler debug' Then, as soon as you need to check the code at the user level, clear the file so that the debugging mode does not turn on.
$ pdbe --file path/to/file.py --clear As a result.
def first_function(): ... def second_function(): ... def third_function(): ... After a few hours, days or tickets, you need to debug the same logic again. Surely, and breakpoints to put in the same places, and indeed it would be good to bring the whole thing into an abstraction, to make it easier to work.
We look at our comm logs.
$ pdbe --log Result:
commit | add336b6a204bb7b3abe76c296b67f92 date | 23:17:00 29-01-2018 message | Message handler debug commit | 4401cbeae73aece0216de9f4874451b6 date | 23:11:22 29-01-2018 message | Users REST API get view We remember by the date and / or the message of commits, what exactly we need. We use the commit hash to restore the state of our debugging at that time.
$ pdbe --checkout add336b6a204bb7b3abe76c296b67f92 In the end, everything was back at the time of the commit.
def first_function(): import pdb; pdb.set_trace() ... def second_function(): import pdb; pdb.set_trace() ... def third_function(): import pdb; pdb.set_trace() ... What is planned to add
- Insert logger `a. Sometimes you just need to follow the order of execution of applications.
- An additional feature in which you can feed the name of a function, class or any other object, and get a diagram of relations with the object throughout the project.
Thank you for taking the time to post. If you are interested in pdbe , visit the project 's Github page . If you have any feedback or suggestions, write to private messages.
Source: https://habr.com/ru/post/348376/
All Articles