Testing the performance of hyperconvergent systems and SDS do it yourself
- Navigator, devices!
- 36!
- What is 36?
- And what about the devices?
Something like today looks like most synthetic storage systems tests. Why is that?
Until relatively recently, most storage systems were flat with uniform access. What does this mean?
')
The total available disk space was collected from disks with the same characteristics. For example 300 discs 15k. And the performance was the same throughout the space. With the advent of multi-level storage technology, storage systems have become non-planar - performance varies within a single disk space. Moreover, it is not just different, but also unpredictable, depending on the algorithms and capabilities of a specific storage system model.
And everything would be not so interesting, if hyper-convergent systems with data localization did not appear. In addition to the unevenness of the disk space itself, unevenness in access to it also appears - depending on whether the local disks of the node contain one of the copies of the data or need to access it via the network.
Habitual synthetic tests sharply give a blunder, the numbers from these loads have lost practical meaning. The only way to seriously assess whether the system is suitable is a pilot installation with the transfer of the product. But what to do if the transfer of the product does not give good security or it is just too long / laborious. Is there a way to evaluate?
Let us pretend that we are a productive load, and load the entire hyperconvergent cluster. Feel free to cross out “100% random across the entire volume” - this test will not show anything except the performance of the lowest disks. Those. 150-300 IOPS per node (2-4 SATA).
What is required for this?
1. At least 1 machine with a node load generator.
2. Load profiles, close to the product.
For bulk loads such as VDI, it is necessary to create a representative number of machines. Ideally, of course, complete, but since most of the demo systems are 3-4 nodes, 3000-4000 VMs cannot be run on them.
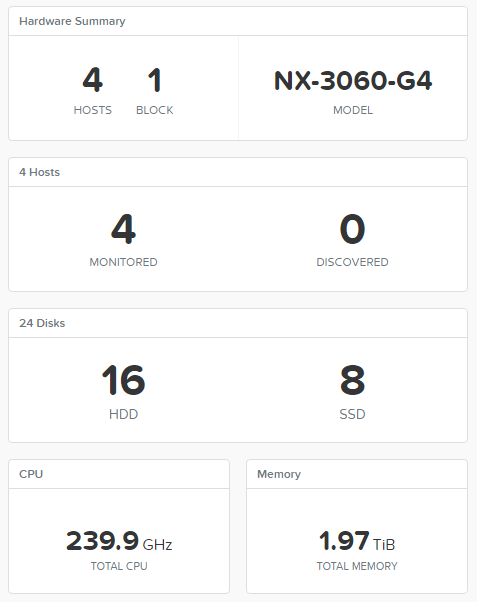
In my tenacious paws, the Nutanix NX-3460G4 cluster appeared, but the test is applicable to any platform available on the market. Moreover, the same tests can be carried out for classic storage systems, the technology does not change.
As a load generator, I took FIO running CentOS 7. Load profiles from Nutanix XRay 2.2 . Why CentOS? There was a distribution kit at hand, you can use any other Linux to taste.
We make several VM templates for a different type of load.
1. Control FIO - 1 vCPU, 2GB RAM, 20GB OS
2. DB - 1 vCPU, 2GB RAM, 20GB OS, 2 * 2 GB Log, 4 * 28 GB Data
3. VDI - 1 vCPU, 2GB RAM, 20GB OS, 10 GB Data
We create the managing director of FIO. We put CentOS in the minimum installation on a 20GB disk, the rest do not touch.
After a minimal installation of CentOS, we install FIO
# yum install wget
# wget dl.fedoraproject.org/pub/epel/testing/7/x86_64/Packages/f/fio-3.1-1.el7.x86_64.rpm
# yum install fio-3.1-1.el7.x86_64.rpm
Repeat the same for load pattern machines. And prescribe FIO to autoload on them.
Create the file /etc/systemd/system/fio.service
# systemctl daemon-reload
# systemctl enable fio.service
# systemctl start fio.service
# firewall-cmd --zone = public --permanent --add-port = 8765 / tcp
The infrastructure is ready. Now you need a load.
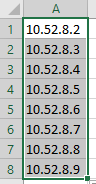
Create a list of FIO servers.
10.52.8.2 - 10.52.9.146
Convenient to use for this Excel.
We load this list on the controlling machine. On it we load config files of FIO with load.
fio-vdi.cfg
Run FIO in to check the correctness of the settings and the initial warm-up of the disks.
On the control VM
# fio --client <fio.template.ip> vdi.cfg
After 2-3 minutes, you can press Ctrl-C, otherwise FIO will work out a full cycle from the config - 2 hours.
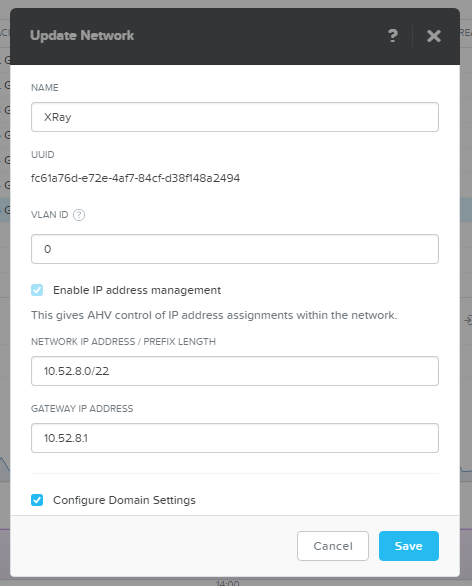
Now we will prepare a platform for the mass deployment of VDI loads. I created a completely non-intersecting network with IPAM - the AHV hypervisor intercepts DHCP and issues addresses itself.
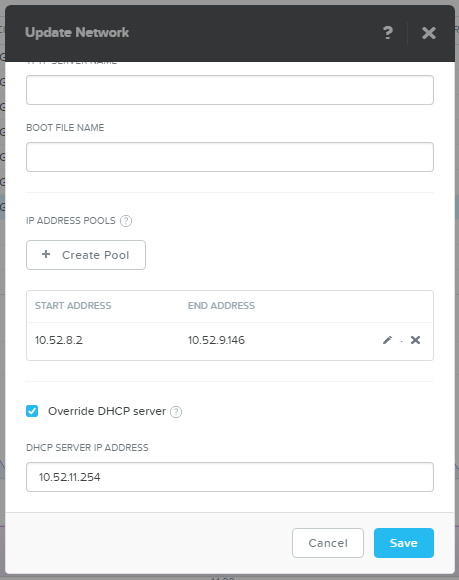
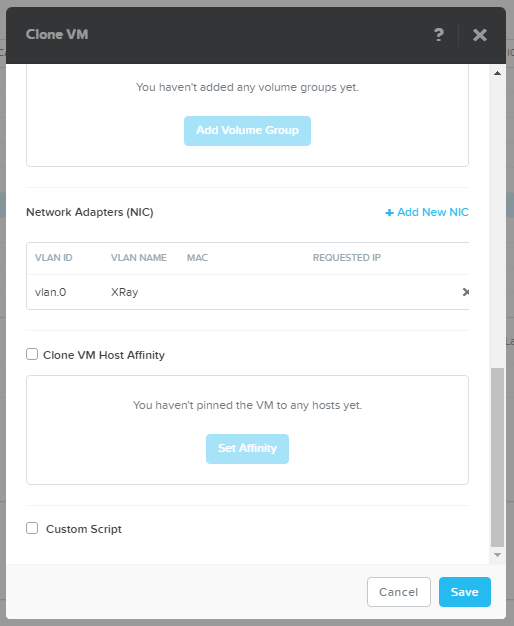
Since AHV does not issue addresses in order, we will make a pool of exactly the size of the planned load - 400 VM (100 per host).
We create load 400 VDI machines.
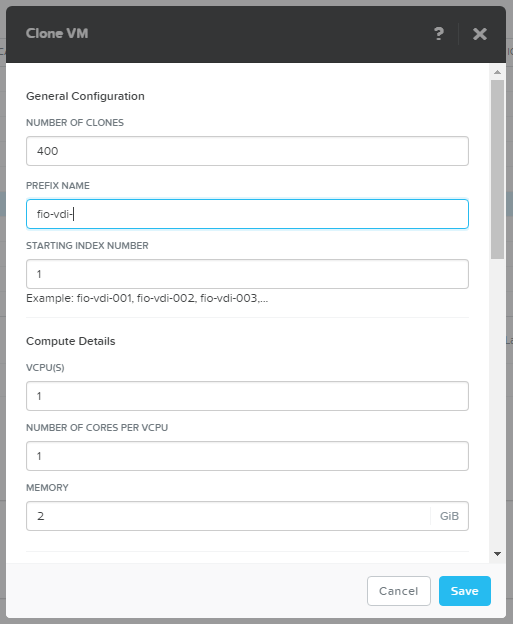
In principle, only the creation of 400 machines at once is an interesting test of any system.
How did the middle-aged Nutanix cluster do it?

2 minutes. It seems to me an excellent result.
Now turn on the machine.
On Nutanix CVM
# acli vm.on fio-vdi- *
Well, now is the time to cut in full gas!
With managing FIO
# fio --client vdi.list vdi.cfg
This is how your storage system will feel like under 400 VM with average office VDI load.
The article also shows the profiles for the average OLTP and DSS databases. Of course, there are not 400 of them, but 6-8 pieces can be launched and tried. For example, for 8 OLTP and 2 DSS we need 10 machines from those that have 6 additional disks each.
From two terminals at once
1. # fio --client oltp.list fio-oltp.cfg
2. # fio --client dss.list fio-dss.cfg
It would seem that everything is going well. Each system shows itself well, and nothing portends trouble. Let's do it yourself!
Now we observe how under load the system will be rebuilt and how it will change the indicators. Pay special attention to the "smart" systems that delay rebuilding and restoring fault tolerance for an hour or more. No, well, what about that? What if it's nothing terrible, think a knot flew. But on the tests beautiful numbers will remain. If not read what is fine print in the depths of the documentation.
Nutanix starts the recovery process automatically, 30 seconds after CVM is unavailable. Even if it is a legitimate operation, like restarting when updating.
With the help of such a simple guide, you can try - and is the system offered by the vendor / integrator suitable for you?
Well, or of course, you can simply download Nutanix XRay, which will do all this automatically with beautiful graphics for the Nutanix AHV and VMware platforms! :)
Special thanks for the help r0g3r
- 36!
- What is 36?
- And what about the devices?
Something like today looks like most synthetic storage systems tests. Why is that?
Until relatively recently, most storage systems were flat with uniform access. What does this mean?
')
The total available disk space was collected from disks with the same characteristics. For example 300 discs 15k. And the performance was the same throughout the space. With the advent of multi-level storage technology, storage systems have become non-planar - performance varies within a single disk space. Moreover, it is not just different, but also unpredictable, depending on the algorithms and capabilities of a specific storage system model.
And everything would be not so interesting, if hyper-convergent systems with data localization did not appear. In addition to the unevenness of the disk space itself, unevenness in access to it also appears - depending on whether the local disks of the node contain one of the copies of the data or need to access it via the network.
Habitual synthetic tests sharply give a blunder, the numbers from these loads have lost practical meaning. The only way to seriously assess whether the system is suitable is a pilot installation with the transfer of the product. But what to do if the transfer of the product does not give good security or it is just too long / laborious. Is there a way to evaluate?
Let us pretend that we are a productive load, and load the entire hyperconvergent cluster. Feel free to cross out “100% random across the entire volume” - this test will not show anything except the performance of the lowest disks. Those. 150-300 IOPS per node (2-4 SATA).
What is required for this?
1. At least 1 machine with a node load generator.
2. Load profiles, close to the product.
For bulk loads such as VDI, it is necessary to create a representative number of machines. Ideally, of course, complete, but since most of the demo systems are 3-4 nodes, 3000-4000 VMs cannot be run on them.
In my tenacious paws, the Nutanix NX-3460G4 cluster appeared, but the test is applicable to any platform available on the market. Moreover, the same tests can be carried out for classic storage systems, the technology does not change.
As a load generator, I took FIO running CentOS 7. Load profiles from Nutanix XRay 2.2 . Why CentOS? There was a distribution kit at hand, you can use any other Linux to taste.
We make several VM templates for a different type of load.
1. Control FIO - 1 vCPU, 2GB RAM, 20GB OS
2. DB - 1 vCPU, 2GB RAM, 20GB OS, 2 * 2 GB Log, 4 * 28 GB Data
3. VDI - 1 vCPU, 2GB RAM, 20GB OS, 10 GB Data
We create the managing director of FIO. We put CentOS in the minimum installation on a 20GB disk, the rest do not touch.
After a minimal installation of CentOS, we install FIO
# yum install wget
# wget dl.fedoraproject.org/pub/epel/testing/7/x86_64/Packages/f/fio-3.1-1.el7.x86_64.rpm
# yum install fio-3.1-1.el7.x86_64.rpm
Repeat the same for load pattern machines. And prescribe FIO to autoload on them.
Create the file /etc/systemd/system/fio.service
[Unit] Description=FIO server After=network.target [Service] Type=simple ExecStart=/usr/bin/fio --server Restart=on-failure RestartSec=5 [Install] WantedBy=multi-user.target # systemctl daemon-reload
# systemctl enable fio.service
# systemctl start fio.service
# firewall-cmd --zone = public --permanent --add-port = 8765 / tcp
The infrastructure is ready. Now you need a load.
Create a list of FIO servers.
10.52.8.2 - 10.52.9.146
Convenient to use for this Excel.
We load this list on the controlling machine. On it we load config files of FIO with load.
fio-vdi.cfg
[global] ioengine=libaio direct=1 norandommap time_based group_reporting disk_util=0 continue_on_error=all rate_process=poisson runtime=3600 [vdi-read] filename=/dev/sdb bssplit=8k/90:32k/10,8k/90:32k/10 size=8G rw=randread rate_iops=13 iodepth=8 percentage_random=80 [vdi-write] filename=/dev/sdb bs=32k size=2G offset=8G rw=randwrite rate_iops=10 percentage_random=20</code> <b>fio-oltp.cfg</b> <code>[global] ioengine=libaio direct=1 time_based norandommap group_reporting disk_util=0 continue_on_error=all rate_process=poisson runtime=10000 [db-oltp1] bssplit=8k/90:32k/10,8k/90:32k/10 size=28G filename=/dev/sdd rw=randrw iodepth=8 rate_iops=500,500 [db-oltp2] bssplit=8k/90:32k/10,8k/90:32k/10 size=28G filename=/dev/sde rw=randrw iodepth=8 rate_iops=500,500 [db-oltp3] bssplit=8k/90:32k/10,8k/90:32k/10 size=28G filename=/dev/sdf rw=randrw iodepth=8 rate_iops=500,500 [db-oltp4] bssplit=8k/90:32k/10,8k/90:32k/10 size=28G filename=/dev/sdg rw=randrw iodepth=8 rate_iops=500,500 [db-log1] bs=32k size=2G filename=/dev/sdb rw=randwrite percentage_random=10 iodepth=1 iodepth_batch=1 rate_iops=100 [db-log2] bs=32k size=2G filename=/dev/sdc rw=randwrite percentage_random=10 iodepth=1 iodepth_batch=1 rate_iops=100 Run FIO in to check the correctness of the settings and the initial warm-up of the disks.
On the control VM
# fio --client <fio.template.ip> vdi.cfg
After 2-3 minutes, you can press Ctrl-C, otherwise FIO will work out a full cycle from the config - 2 hours.
Now we will prepare a platform for the mass deployment of VDI loads. I created a completely non-intersecting network with IPAM - the AHV hypervisor intercepts DHCP and issues addresses itself.
Since AHV does not issue addresses in order, we will make a pool of exactly the size of the planned load - 400 VM (100 per host).
We create load 400 VDI machines.
In principle, only the creation of 400 machines at once is an interesting test of any system.
How did the middle-aged Nutanix cluster do it?
2 minutes. It seems to me an excellent result.
Now turn on the machine.
On Nutanix CVM
# acli vm.on fio-vdi- *
Well, now is the time to cut in full gas!
With managing FIO
# fio --client vdi.list vdi.cfg
This is how your storage system will feel like under 400 VM with average office VDI load.
The article also shows the profiles for the average OLTP and DSS databases. Of course, there are not 400 of them, but 6-8 pieces can be launched and tried. For example, for 8 OLTP and 2 DSS we need 10 machines from those that have 6 additional disks each.
From two terminals at once
1. # fio --client oltp.list fio-oltp.cfg
2. # fio --client dss.list fio-dss.cfg
It would seem that everything is going well. Each system shows itself well, and nothing portends trouble. Let's do it yourself!
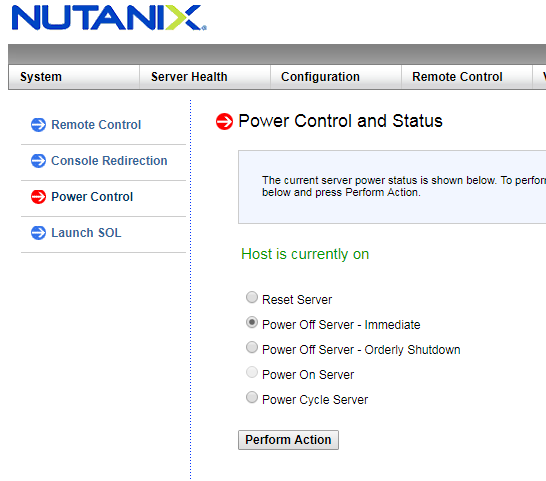
Now we observe how under load the system will be rebuilt and how it will change the indicators. Pay special attention to the "smart" systems that delay rebuilding and restoring fault tolerance for an hour or more. No, well, what about that? What if it's nothing terrible, think a knot flew. But on the tests beautiful numbers will remain. If not read what is fine print in the depths of the documentation.
Nutanix starts the recovery process automatically, 30 seconds after CVM is unavailable. Even if it is a legitimate operation, like restarting when updating.
With the help of such a simple guide, you can try - and is the system offered by the vendor / integrator suitable for you?
Well, or of course, you can simply download Nutanix XRay, which will do all this automatically with beautiful graphics for the Nutanix AHV and VMware platforms! :)
Special thanks for the help r0g3r
Source: https://habr.com/ru/post/348182/
All Articles