How to add your meter to PRTG. And briefly about sensor formats with examples on powershell
Why not add performance indicators from 1C (and anything else at all) to the monitoring system? As we studied, it turned out that you can derive from scripts, batch files, VB scripts, executable files, via SSH, direct execution of sql queries and a whole bunch of ways. In order not to get a huge sheet in this article there will be only a minimum of what you need to screw the counters to PRTG with examples on powershell.
In fact, everything is very simple.
In PRTG, there are several types of sensors added manually, let's call them “simple sensor” and “complex sensor” .
A simple sensor returns only one number and a message to the system;
The number must be a 64-bit integer or fractional, the message after the colon is not more than 2000 characters long.
The message after the colon is the line that appears in the header on a color field.

It is possible to designate a counter to do so.
In this case, you will change the message in the Last Message field but the color will not change. How to change the background color below in the exit codes .
From the program or script, to interact you only need to give out the text and that's it. I usually suppress the output of any messages, and throw out only the line. Below is an example:
To get the right kind of dashboard, and not just digital values, you need to return the exit codes from the script. We can then transfer not just numbers but also color sensors by colors.
All you need to do to PRTG displayed in the right color is to return the parameter at the output, in powershell this is done by the command at the output.
The PRTG has the following codes.
In principle, this is all you need to know about simple sensors to get started.
A complex sensor must throw out the data in a certain format, because There can be many channels on a single graph, scaling of values, a caption to them, etc. The XML or JSON format is used . The output for XML should be something like this.
In the search, the part responsible for the output will look like this:
I'm not even trying to make an Out-String , just a direct output, that's all. We remember about the rake, each variable must contain only one value and nothing else, otherwise you will get the wrong conclusion, it’s better to clearly see the type.
For JSON, it should look something like this:
Now let's see the most important tags (all tags are case-sensitive) .
Now an example of the script that makes the data output in the PRTG format. We assume that 1C-ka uploads every N minutes data into a text file on disk, the contents of a text file data.txt with source data:
Then the script will look like this:
The script is ready, how the sensor is arranged is clear to us, now let's tie it all up and launch it.
On the server with PRTG there is a directory "C: \ Program Files (x86) \ PRTG Network Monitor \ Custom Sensors" in it we are interested in 2 directories:
We throw our script into the EXEXML directory.
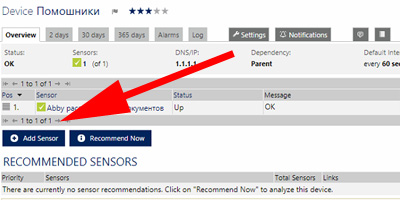
Next, as usual we add the sensor:
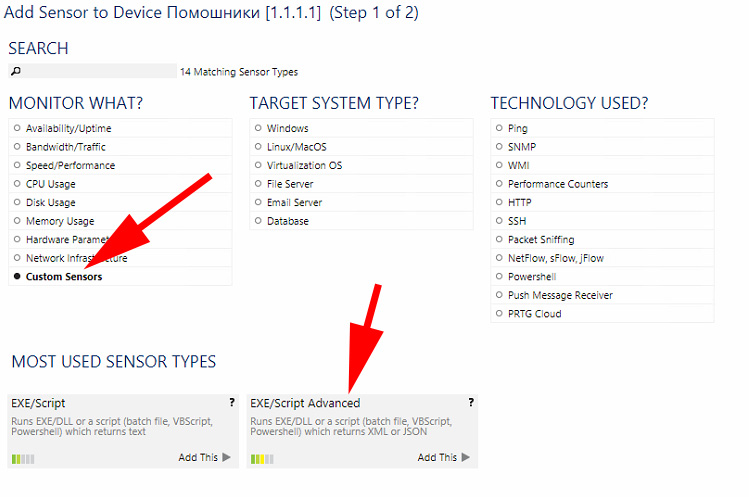
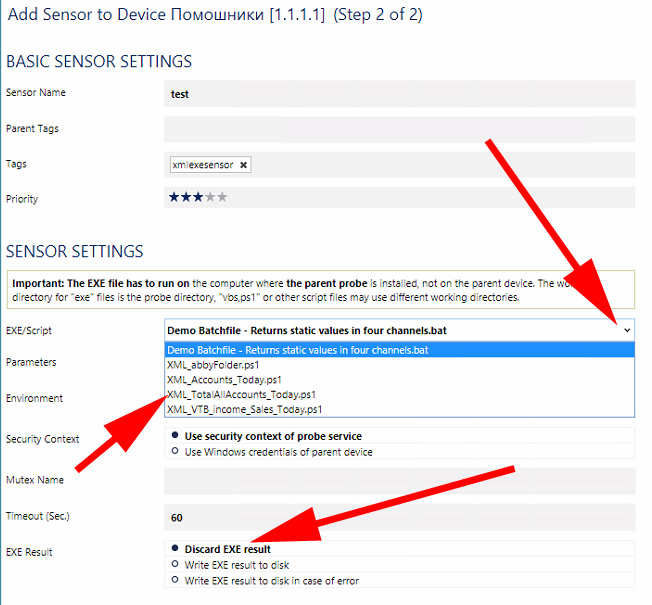
We indicate that the sensor will be custom, of the exe \ script advanced type :
We change the name to understand, click the arrow and see the scripts from the EXEXML directory. Attention, there is a lower value - Discard EXE result , this means that PRTG by executing the script will reset its output, for debugging you can switch it to position - write to disk , the result will be in the C: \ ProgramData \ Paessler \ PRTG Network Monitor \ Logs directory \ sensor name .
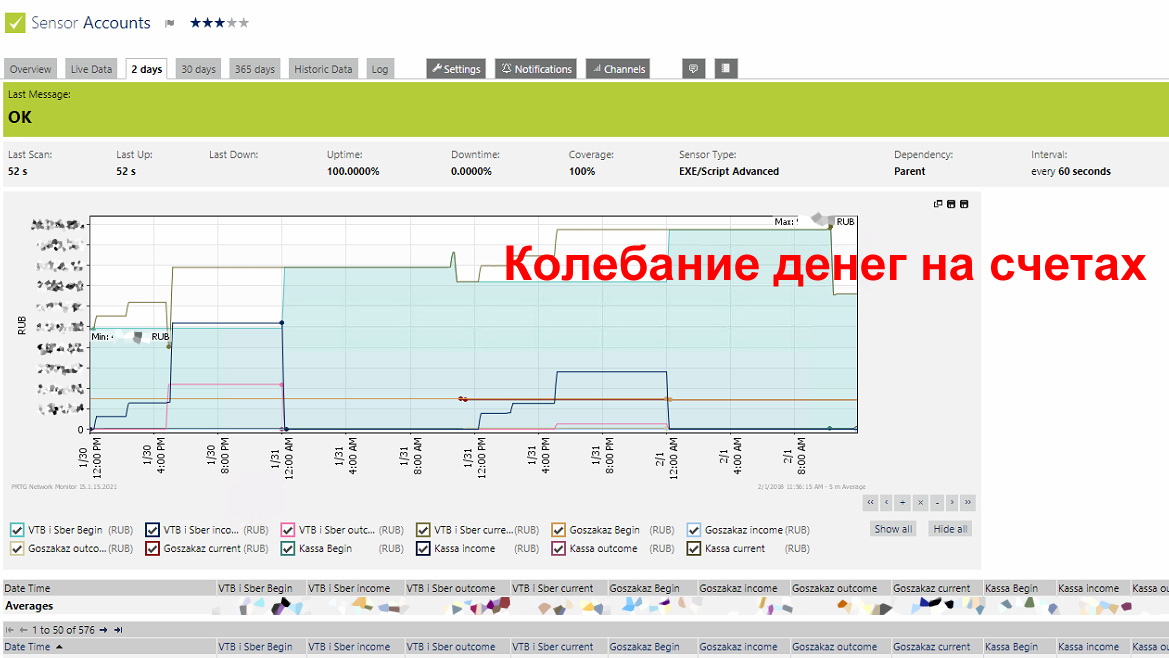
According to the results we get what we need.
Related Links:
In fact, everything is very simple.
There is a little magic to make PowerShell counters in PRTGafter the counter is created it may turn out that it does not give out numbers, although everything is fine in the console or during manual start. And the fact is that PRTG runs scripts from under "itself", it can:
')
- not have access rights
- running scripts in the system may be prohibited
- Script launch in x86 version may be prohibited, and in x64 allowed
You need to start with the last two points. You can check the script startup policy with the commandGet-ExecutionPolicy
If she returned Restricted, then you need to allow running scripts on this system by running the command from the administrative console.Set-ExecutionPolicy Unrestricted
For those who want security - sign scripts even with a local certificate and install the AllSigned policy.
After installing the script launch policy, make sure that everything is correct, for those who have a 32-bit version of PowerShell, install the policy in it, too, since PRTG can try to run your script from the 32-bit version. (More precisely, it will do so if there is a PowerShell x86 version), the launch policies are different, and if you install it in 64-bit, you can forget that in 32 it remains. Just run under the admin Powershell x86 and make the same settings in it.
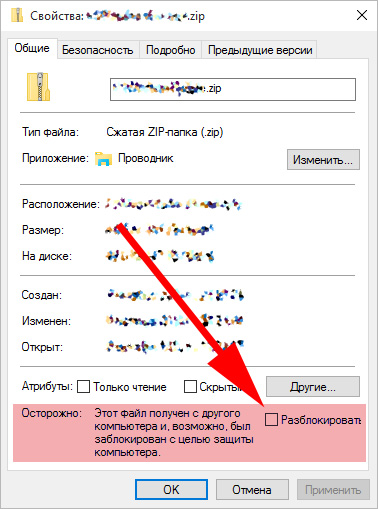
The problem of rights is solved more simply - we set the rights to everyone and if it works, it means that it is not enough. If the script has an alternative ntfs in the properties, then it should be removed
First, a little theory about how the sensors are arranged.
In PRTG, there are several types of sensors added manually, let's call them “simple sensor” and “complex sensor” .
1. Simple sensor
A simple sensor returns only one number and a message to the system;
12345:Ok # , 12345 :Ok The number must be a 64-bit integer or fractional, the message after the colon is not more than 2000 characters long.
The message after the colon is the line that appears in the header on a color field.
It is possible to designate a counter to do so.
1000 :To low 2000 :Ok 5000 :To high In this case, you will change the message in the Last Message field but the color will not change. How to change the background color below in the exit codes .
From the program or script, to interact you only need to give out the text and that's it. I usually suppress the output of any messages, and throw out only the line. Below is an example:
# 1 30 # $FileName = 'C:\PRTG\sales_today.txt' # $ErrorActionPreference = 'SilentlyContinue' if ((Test-Path $FileName) -eq $false) { Write-Host "0 :Error" } else { $Val = Get-Content $FileName | select -First 1 # , # ( ) $Val = [string]$Val + ":Ok" Write-Host $Val # $Val # exit 0 } exit codes - paint the sensors on the panel
To get the right kind of dashboard, and not just digital values, you need to return the exit codes from the script. We can then transfer not just numbers but also color sensors by colors.
All you need to do to PRTG displayed in the right color is to return the parameter at the output, in powershell this is done by the command at the output.
# exit 0 The PRTG has the following codes.
| Value | Description |
|---|---|
| 0 | all is well. The sensor in dashborde is colored green. The last message is highlighted in green.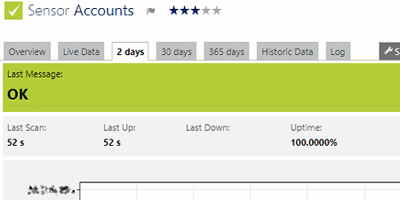 |
| one | Attention. The sensor is painted yellow. The last message is tinted yellowish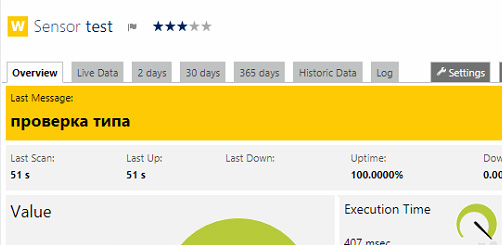 |
| 2 | System error. The sensor is painted red. The last message is highlighted in red. The message is logged to the alert.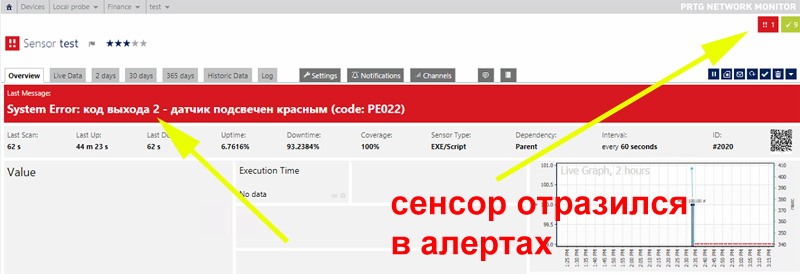 |
| 3 | Protocol error (for example, web server returns 404). The sensor is painted red. The last message is red. Alert is highlighted. Protocol Error string added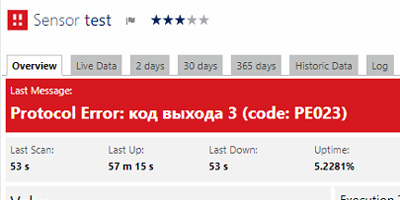 |
| four | The sensor is painted red. The last message is red. Alert is registered. Before the message appears Content Error |
In principle, this is all you need to know about simple sensors to get started.
2. Complicated sensor
A complex sensor must throw out the data in a certain format, because There can be many channels on a single graph, scaling of values, a caption to them, etc. The XML or JSON format is used . The output for XML should be something like this.
<prtg> <result> <channel> </channel> <value>100</value> </result> <result> <channel> </channel> <value>200</value> </result> </prtg> In the search, the part responsible for the output will look like this:
"<prtg>" "<result>" "<channel>Total all accounts</channel>" "<value>$TotalAllAccountsBeg</value>" "<CustomUnit>RUB</CustomUnit>" "</result>" "<result>" "<channel>Total all accounts income</channel>" "<value>$TotalAllAccountsIncome</value>" "<CustomUnit>RUB</CustomUnit>" "</result>" "<result>" "<channel>Total all account outcome</channel>" "<value>$TotalAllAccountsOutcome</value>" "<CustomUnit>RUB</CustomUnit>" "</result>" "</prtg>" I'm not even trying to make an Out-String , just a direct output, that's all. We remember about the rake, each variable must contain only one value and nothing else, otherwise you will get the wrong conclusion, it’s better to clearly see the type.
For JSON, it should look something like this:
{ "prtg": { "result": [ { "channel": " ", "value": "100" }, { "channel": " ", "value": "20" } ] } } Now let's see the most important tags (all tags are case-sensitive) .
<Channel>Full list of tags here .
required
The channel name displayed in the user interface must be unique for each sensor in one sensor. There must not be 2 identical channel names.
value: any string
<Value>
required
integer or fractional value. If the PRTG cannot recognize it, it will display 0. Therefore, just check the output format, whether you output it correctly
value: integer or fractional
<CustomUnit>
not
if selected, this line is displayed below the numbers
for example RUB
value: any string, better short
<Unit>
not obligatory
If you want a built-in unit of measurement, you need to specify one of the built-in units. PRTG can understand time and scale some values (bytes - megabytes)
value:
BytesBandwidth
Bytes memory
Bytesdisk
Temperature
Percent
Timeresponse
Timeseconds
Custom
Count
CPU (*)
Bytesfile
Speeddisk
Speednet
Timehours
Working example issuing xml for PRTG
Now an example of the script that makes the data output in the PRTG format. We assume that 1C-ka uploads every N minutes data into a text file on disk, the contents of a text file data.txt with source data:
: 10 000 000,06 : 8 000 000,93 : 0 : 0 : 8 000 000,93 : 2 000 000,4 : 0 : 0 : 2 000 000,4 : 30 000,04 : 20 000,11 : 0 : 50 000,15 Then the script will look like this:
$FileName = 'C:\PRTG\data.txt' # $ErrorActionPreference = 'SilentlyContinue' # .. 1- # , function Get-Data{ Param( [parameter(Mandatory=$true)] [String] $SourceString ) $str = '' $str = $SourceString.Split(':') $str = $str[1] $str = $str.split(',') $str = $str[0] $str = $str -replace '\s','' return $str } if ((Test-Path $FileName) -eq $false) { exit 3 } $File = Get-Content $FileName | Select-String ":" $SalesToday = Get-Data $File $File = Get-Content $FileName | Select-String " :" $AccVTBBeg = Get-Data $File $File = Get-Content $FileName | Select-String " :" $AccVTBincome = Get-Data $File $File = Get-Content $FileName | Select-String " :" $AccVTBoutcome = Get-Data $File $File = Get-Content $FileName | Select-String " :" $AccVTBCurr = Get-Data $File $File = Get-Content $FileName | Select-String " :" $AccGosBeg = Get-Data $File $File = Get-Content $FileName | Select-String " :" $AccGosincome = Get-Data $File $File = Get-Content $FileName | Select-String " :" $AccGosoutcome = Get-Data $File $File = Get-Content $FileName | Select-String " :" $AccGosCurr = Get-Data $File $File = Get-Content $FileName | Select-String " :" $AccKassaBeg = Get-Data $File $File = Get-Content $FileName | Select-String " :" $AccKassaincome = Get-Data $File $File = Get-Content $FileName | Select-String " :" $AccKassaoutcome = Get-Data $File $File = Get-Content $FileName | Select-String " :" $AccKassaCurr = Get-Data $File $TotalAllAccountsBeg = [int]$AccVTBBeg + [int]$AccGosBeg + [int]$AccKassaBeg $TotalAllAccountsIncome = [int]$AccVTBincome + [int]$AccGosincome + [int]$AccKassaincome $TotalAllAccountsOutcome = [int]$AccVTBoutcome + [int]$AccGosoutcome + [int]$AccKassaoutcome $TotalAllAccountsCurr = [int]$AccVTBCurr + [int]$AccGosCurr + [int]$AccKassaCurr "<prtg>" "<result>" "<channel>Total all accounts</channel>" "<value>$TotalAllAccountsBeg</value>" "<CustomUnit>RUB</CustomUnit>" "</result>" "<result>" "<channel>Total all accounts income</channel>" "<value>$TotalAllAccountsIncome</value>" "<CustomUnit>RUB</CustomUnit>" "</result>" "<result>" "<channel>Total all account outcome</channel>" "<value>$TotalAllAccountsOutcome</value>" "<CustomUnit>RUB</CustomUnit>" "</result>" "<result>" "<channel>Total all account current</channel>" "<value>$TotalAllAccountsCurr</value>" "<CustomUnit>RUB</CustomUnit>" "</result>" "</prtg>" The script is ready, how the sensor is arranged is clear to us, now let's tie it all up and launch it.
Now fasten custom sensors to PRTG
On the server with PRTG there is a directory "C: \ Program Files (x86) \ PRTG Network Monitor \ Custom Sensors" in it we are interested in 2 directories:
- Exe for simple sensors
- EXEXML for complex sensors.
We throw our script into the EXEXML directory.
Next, as usual we add the sensor:
We indicate that the sensor will be custom, of the exe \ script advanced type :
We change the name to understand, click the arrow and see the scripts from the EXEXML directory. Attention, there is a lower value - Discard EXE result , this means that PRTG by executing the script will reset its output, for debugging you can switch it to position - write to disk , the result will be in the C: \ ProgramData \ Paessler \ PRTG Network Monitor \ Logs directory \ sensor name .
According to the results we get what we need.
Related Links:
Source: https://habr.com/ru/post/348088/
All Articles