How we adapted the ELK stack to monitor and analyze errors in Java and .NET projects
The patient comes to the doctor and complains of abdominal pain. “Urgently for surgery! - the doctor answers. - Now we will cut you, dig and try to sew as it was.
When users swore at the system, calling programmers villains, we picked up the event log and watched what went wrong. And then switched to ELK. Now we monitor errors in the moment, without slowing down the work of services.
In this article, we will describe how we adapt and apply the ELK stack on Java and .Net projects and find errors online without opening or using minimally invasive methods. Yes, we figured out and realized that it is not very important whether Microsoft made this decision or Open Source - everything can be customized to fit your needs.

What projects are we talking about?
Hard and thorough: the realities of Java
Our Java product is a federal ticketing system. It should work smoothly, freezing and suspension of work is unacceptable. And in the event of a failure, you need to quickly and accurately understand the reason, because it is the loss of the client's live money.
Here ELK works as an online monitoring and work tool for our support service. We log the “raw” data so that when the customer contacts the technical support we know what data we are discussing, what was the encryption key, etc.
Retrospective error analysis on .Net projects
.Net projects are mainly sales and customer support services. It is used by more than 20 thousand people. Too much, but the load is not as big as in Java.
We log errors and information that show the dynamics of business operations. For example, how many users registered on the site. And when we see that there were no registrations for two days, it is immediately clear that something happened there. Or vice versa - they sold a million tickets and sent a letter to the director about it, pleased the person.
How we work with ELK
Logging: Serilog + ELK
On .Net-projects we also mainly use Serilog, since it has ample opportunities for pouring data. There is no point in using beats or Logstash, since Serilog is able to log structuredly: such and such a user logged into the system at a certain time. And you can also customize values for the necessary pieces of information: API, time, etc. And when he starts writing logs in Elastic, it will not be a string, but a property of the object by which you can search. That is, we pass Filebeat and Logstash, eliminating double work.
Durable mode
We use the Serilog mode called Durable mode - it guarantees the delivery of messages, even if Elastic is lying for a while. It works in the same way as Filebeat plus Logstash - first it puts everything into a file, then it tries to urgently deliver to Elastic, if this fails, then Serilog periodically tries until Elastic rises. You can configure how often he will contact Elastic.
Here you can read the instructions for setting up.
Log Containers
on Java projects we write a lot of logs - up to 5 GB per day. These files are beaten into pieces of 5 MB so that they take up less space and make them easier to store. ELK is stored and raised in the Docker-containers on our computers - it turns out a virtual machine, just a lighter one that someone has already configured before you.
On .NET projects, the logs are not as big as on Java projects, so there we beat files not by size, but by day. And then we analyze the logs, highlighting the types of errors.

Zabbix monitoring
Each entry has a Trace ID, and the browser measures the start and end times of the operation - we log this data on the server, and then monitor it via Zabbix.
Kibana / Grafana
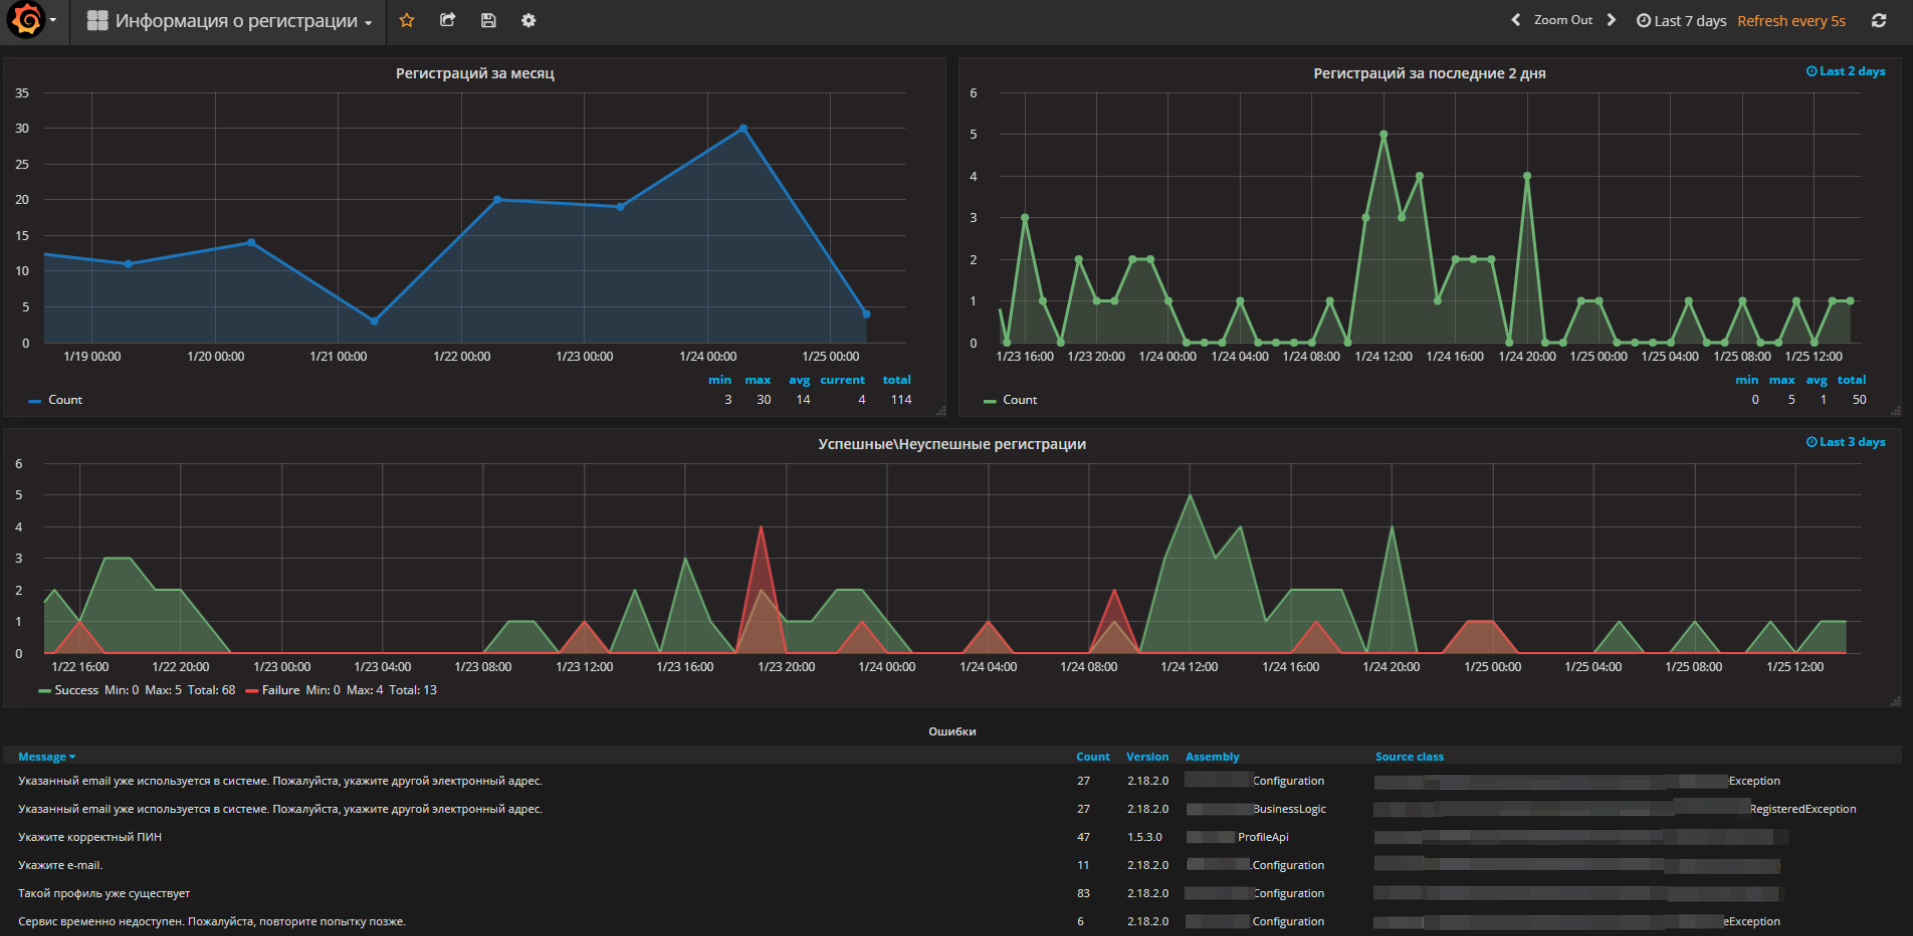
Kibana use for daily monitoring errors. In Kibana, you can do a search in the logs. We use this function on the server and on the test servers. We also have Grafana - she has better visualization, all our projects are shown on one dashboard. Here we can see all the data. Red marks all errors - this is a reason to get into Kibana and see the details. We see where the error is, its place in the code, when it arose, the conditions of the environment. We have one ID that binds all systems together and can trace the complete path of the error.
If the error is unknown, we begin to understand more closely. For example, we recently laid out on a single business process. Testing by the customer went well, but we looked into the logs and saw that there was a mistake. We immediately corrected it, and no one noticed.
For example, on this screenshot you can see the number of registrations on one project:
Error analysis
Every day we get all errors from ELK, we define new ones among them, we classify them, and at the same time we give a human-friendly name.
We observe the dynamics of already classified errors, catch bursts and understand the causes. Technical support engineer gets the task to eliminate the causes. In a day, thousands and tens of thousands of lines need to be analyzed in the logs, and even more on Java projects. Many mistakes are repeated every minute.
We started, like many with a visual review of all the logs. But they quickly realized that with our volumes it was impossible to live like this. And set up an Excel spreadsheet with macros that can take data from Kibana for a day, select errors from them and distribute them into existing categories.
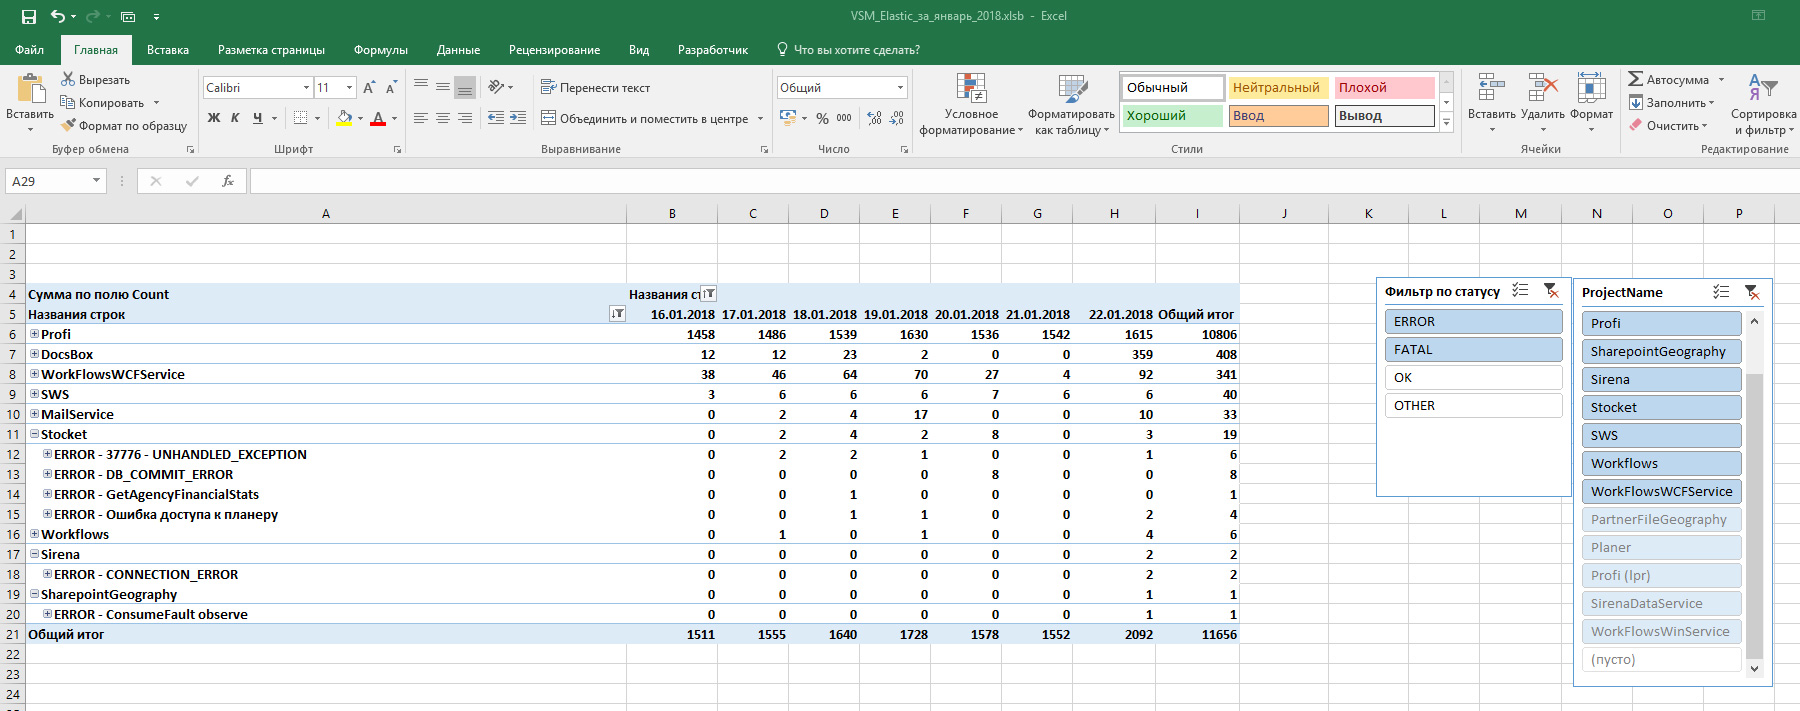
As a result, Excel produces a report, where for each error there is information, how many times a day this error occurred. We receive new errors in a separate list, and we can quickly analyze them first - is there a critical one or not.
In Kibana we go to look at the detailed information on each new error.
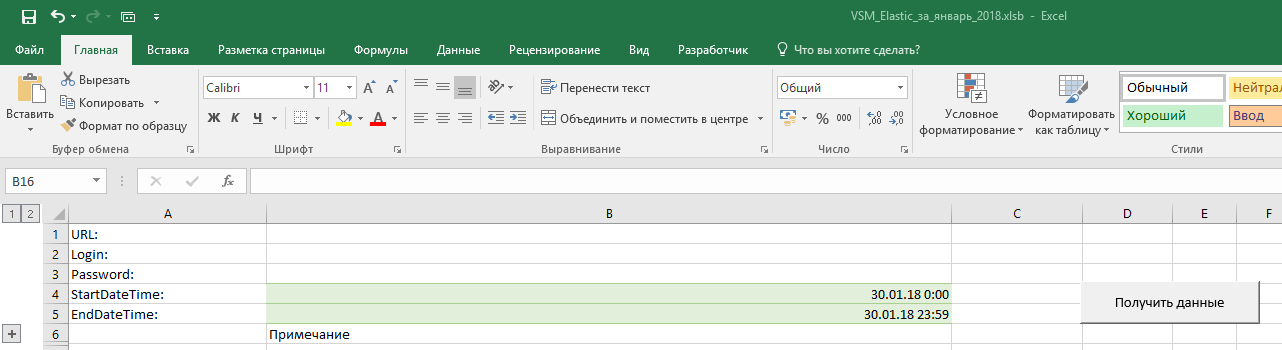
What file allows to do:
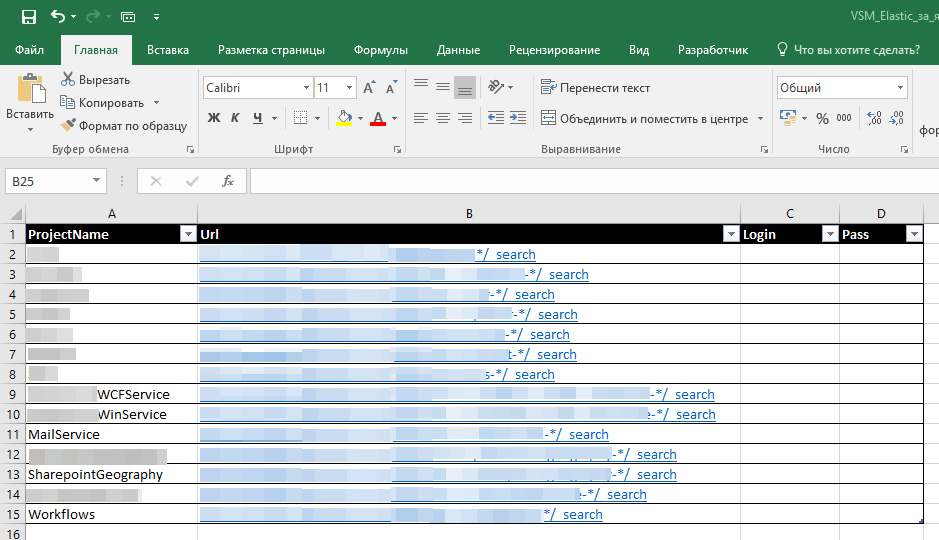
- Receive from Elasticsearch in one table the necessary messages on the necessary projects for the necessary period. To do this, specify the source data in the settings.
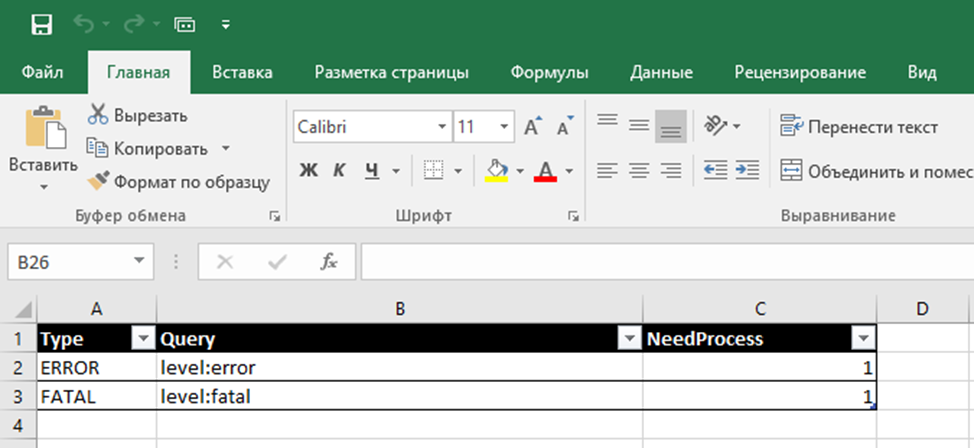
- Assign "names" to errors. Using regular expressions, a search pattern is defined and a human-readable notation is assigned to it. Then all matching errors in the source table are labeled with this name.
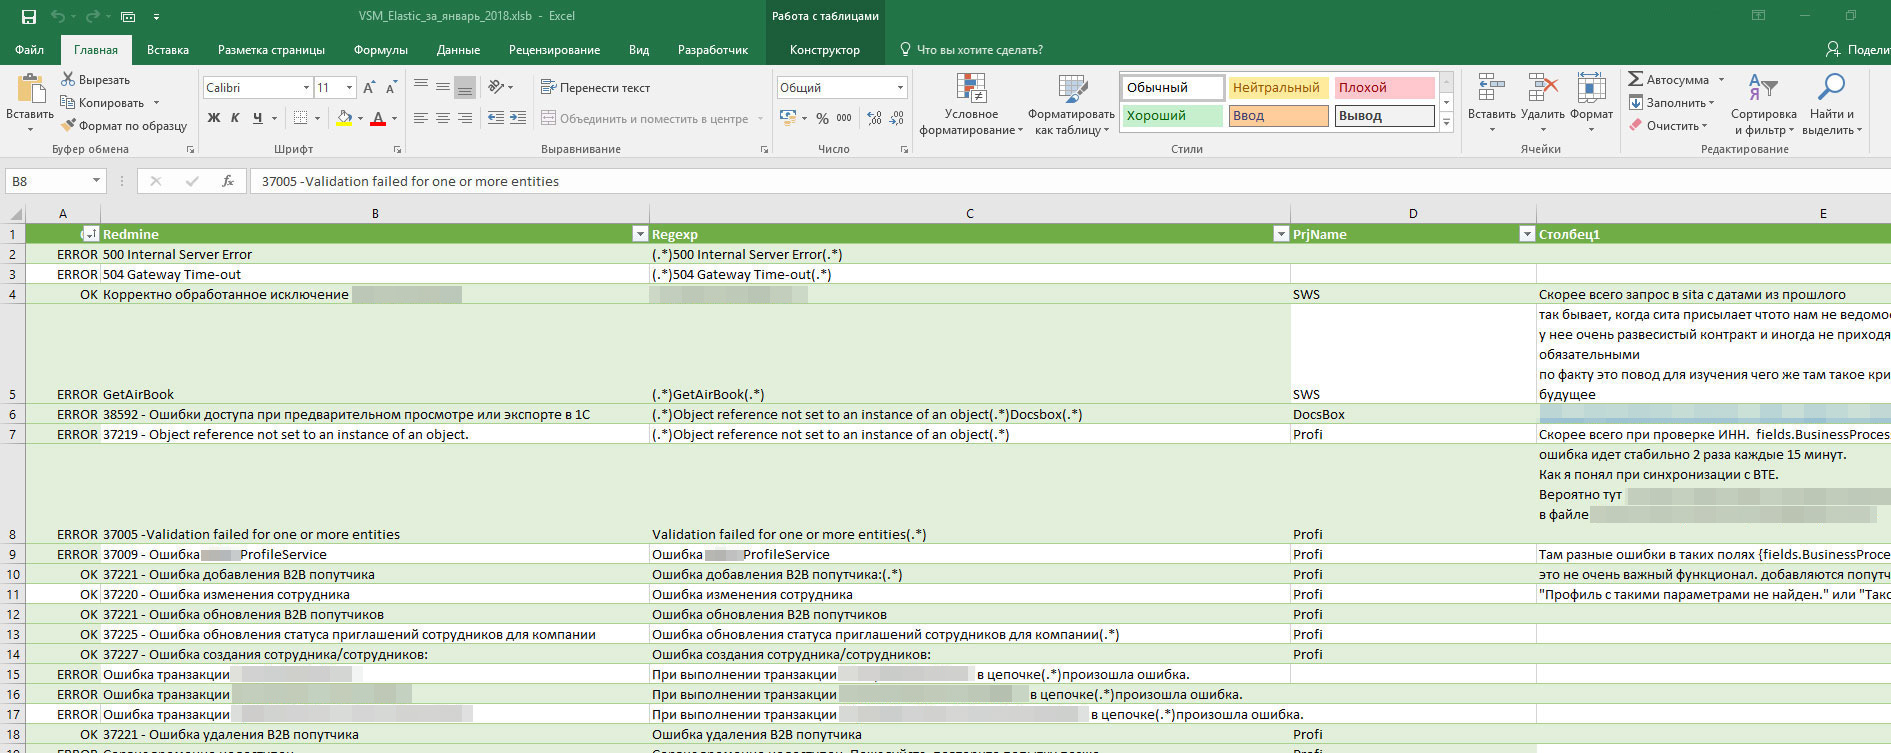
- The categories OK and ERROR are also assigned, indicating whether to pay attention to the message or not. By these types can be filtered. OTHER - shows the total number of messages on the project (not only errors, but simply informational). And task numbers in TFS are assigned if they are already running.
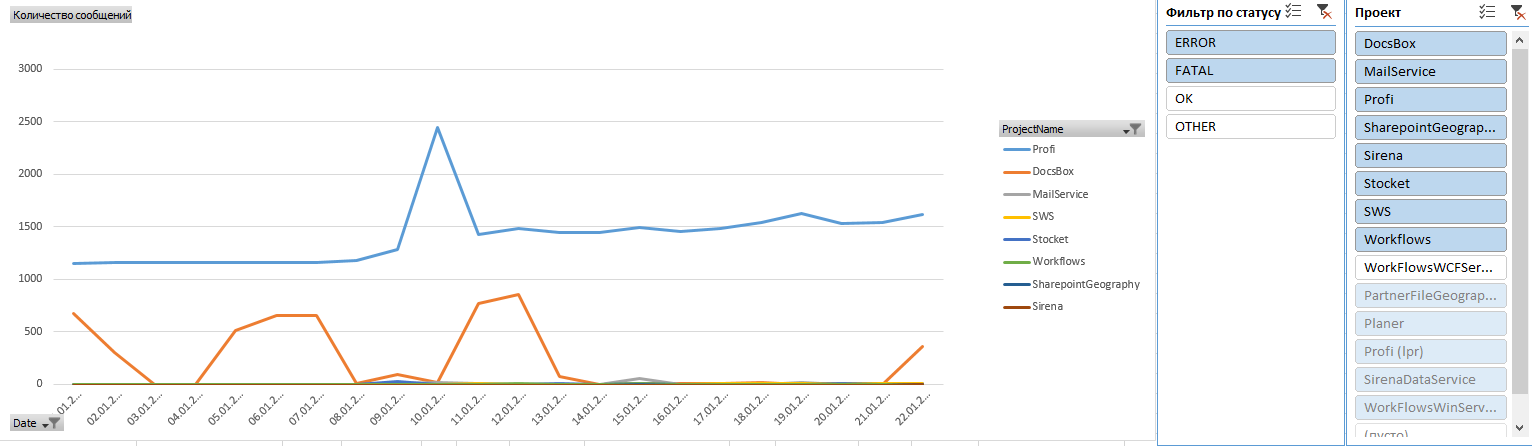
- Build a graph for more convenient analysis with the ability to filter.
Let us examine, on the example of one of the projects, fresh errors in the last couple of days:
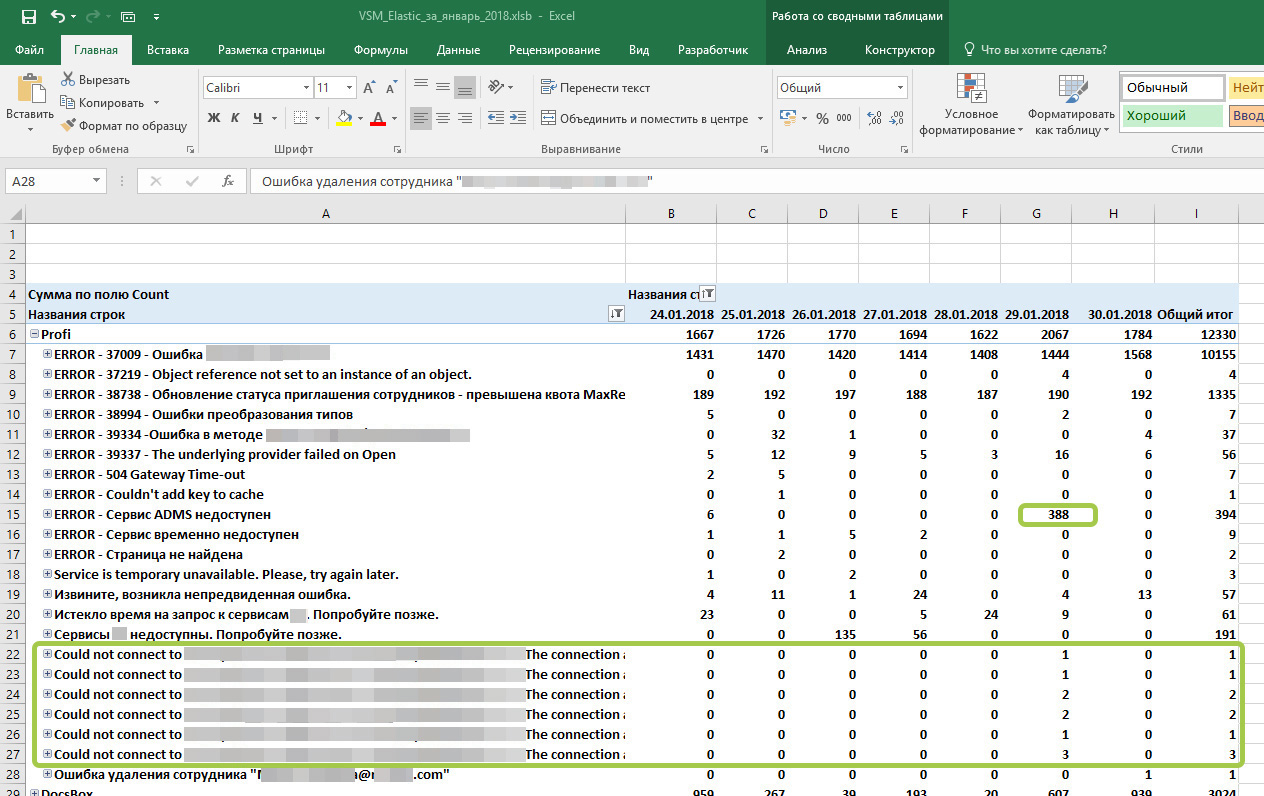
What we see:
1) errors in the upper part that are assigned task numbers are not critical, are waiting for a decision by the developers, they are assigned task numbers from TFS.
2) the error "ADMS service unavailable" appeared 388 times a day - for several hours the service was unavailable, which we saw when contacting Kibana for clarification.
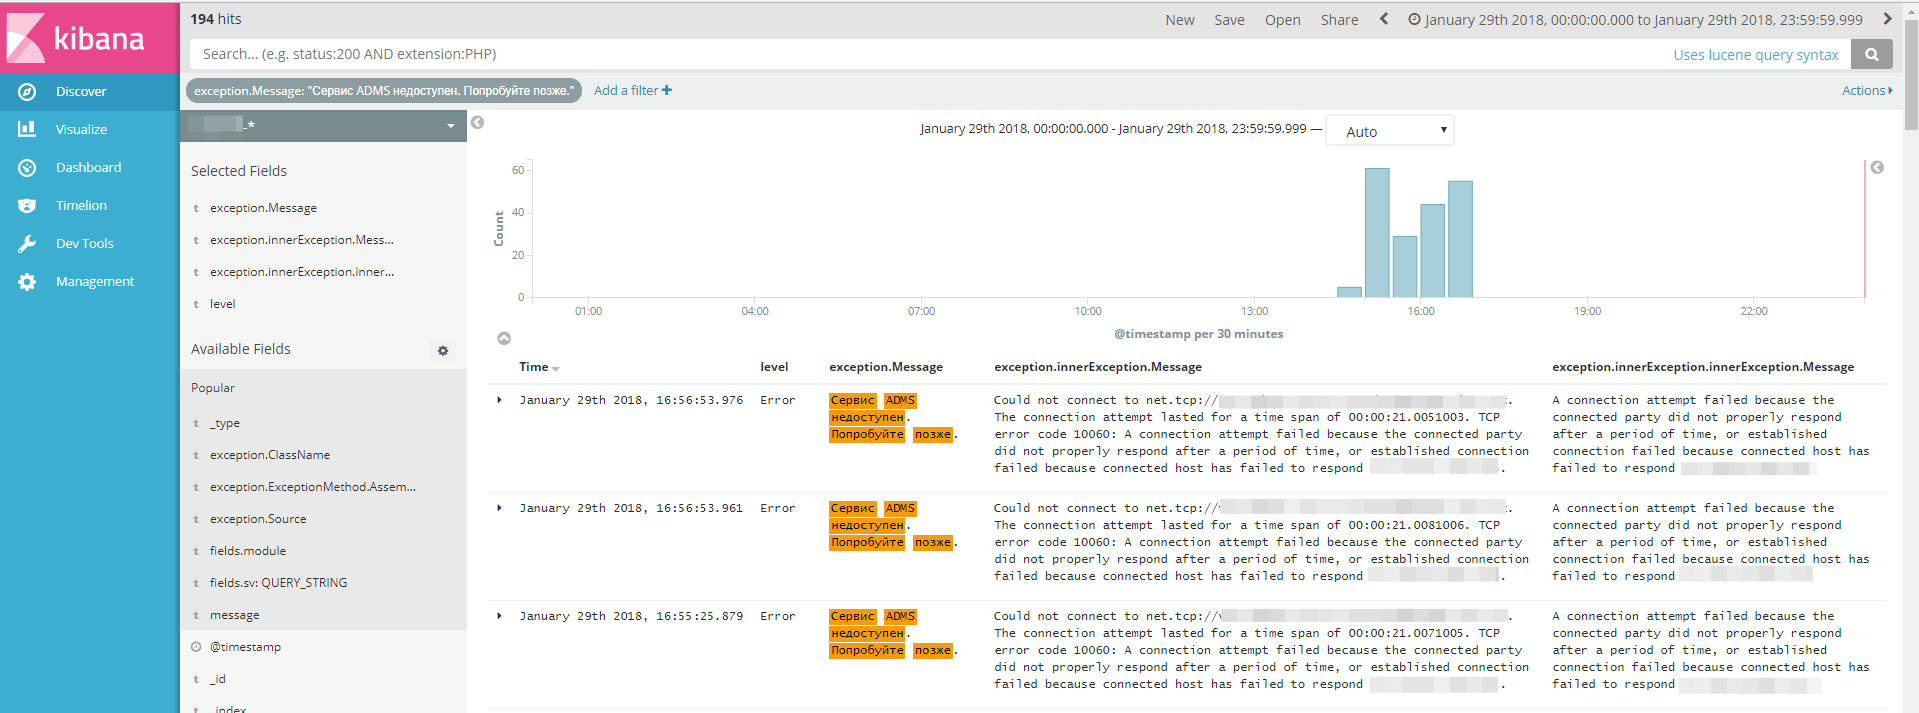
3) a new type of error “Could not connect to ...” appeared - it is connected with the previous one, just logged in one more place.
We are going to “investigate” these two types of errors in order to find out the causes, the likelihood of recurrence and ways to prevent them in the future. They will be given a generic term so that these errors are “curled” into one line.
What are planning to improve
Now we are working on a separate system, which itself will select all the errors from Elasticsearch according to the schedule, notify the operator about the new ones and notify about the bursts of errors. It will run faster than an Excel file that is constantly growing. This system will allow you to build a graph with different discreteness, and not just a day. The operator will still analyze new errors, give them names and react to unforeseen situations.
PS Now, thanks to ELK, the doctor himself notices that the patient is unwell, can quickly make a diagnosis and hand a useful pill, and leave the surgery for the most extreme cases.
')
Source: https://habr.com/ru/post/348054/
All Articles