Measurements as a way to openness
Today we all live in the world of "like." Such services of IP transit, DDoS neutralization, in general, almost any digital service can be found similar. That is a fact - there are many service providers in the market. And when comparing the services offered by them among themselves, a potential client often has a small circle of possibilities. As a result, the consumer is forced to compare exclusively the marketing materials of different companies, that is, in fact, their own interpretations of companies about their own services. This, at least, is strange and far from an objective comparison, even in such a simple ratio as "price / quality".
For a long time this situation did not exist any alternative. Yes, there are analytical agencies comparing and analyzing market offers; again - how accessible are they and are we ready to trust them completely? Market share, the financial condition of the company and other “business metrics” may not say anything about the quality of the service and the service. At the moment we live in a world of brand comparison, and not the quality of the services they offer. In our opinion, this is a rather bad symptom for the market.
However, the situation is changing, and recently there have been opportunities to nevertheless carry out a quantitative and qualitative assessment of the desired service before it is purchased for free. And one of the best of these mechanisms is RIPE Atlas .
Atlas is a set of samples (probe - "probe", in the key network architecture - "sensor"), that is, some points to which you can send a task. Samples are located around the world, several hundred are within the state borders of the Russian Federation. There are two types of samples: large (anchors) are located in networks of telecom operators and data centers, and small ones, the size of a flash drive, can be put anywhere - even on a home router.
')
RIPE Atlas samples provide an excellent opportunity for qualitative research, analysis and comparison of networks. Independent of comparable services. RIPE Atlas did a great job on this service and provided a public API with a basic set of commands, such as ping, traceroute, HTTP get. However, like any API, it cannot by itself be an end product, and until recently there were no ready-made mechanisms to quickly conduct a qualitative assessment of various services. The Qrator.Radar team developed a measurement visualization tool, which includes several typical experiments, primarily several options for visualizing network delays (latency) and visualizing DNS issuance. Additionally, an emergency check mechanism for the availability of a given service was implemented, which is often needed by teams of network engineers.
As a demonstration of the capabilities of this toolkit, we made a comparison, taking (anonymized) four fairly large service providers for protection against DDoS attacks. We compared them primarily for delays. Why is it important to compare DDoS-mitigation services on this basis?
Historically, services to neutralize DDoS-attacks were created as services or equipment, which was included in the work immediately at the time of the attack. However, for many high-risk and high-margin services, the constant on-off of such a service or equipment still leads to temporary unavailability. As a result, in order to avoid downtime, services are gradually moving from the inclusion model under attack to the model of constant and continuous traffic filtering. But this imposes on the services that provide filtering services, additional requirements for low latency. According to a recent Akamai study , people's satisfaction decreases in proportion to the drop in the quality of the video being watched and the presence of problems with buffering, which are inextricably linked to network delays. Ping is extremely critical for online games and players, making it impossible to compete in the event of high delays. Network delays even affect how we search for information on the Internet and make related decisions. Milliseconds have a huge, sometimes invisible, effect.
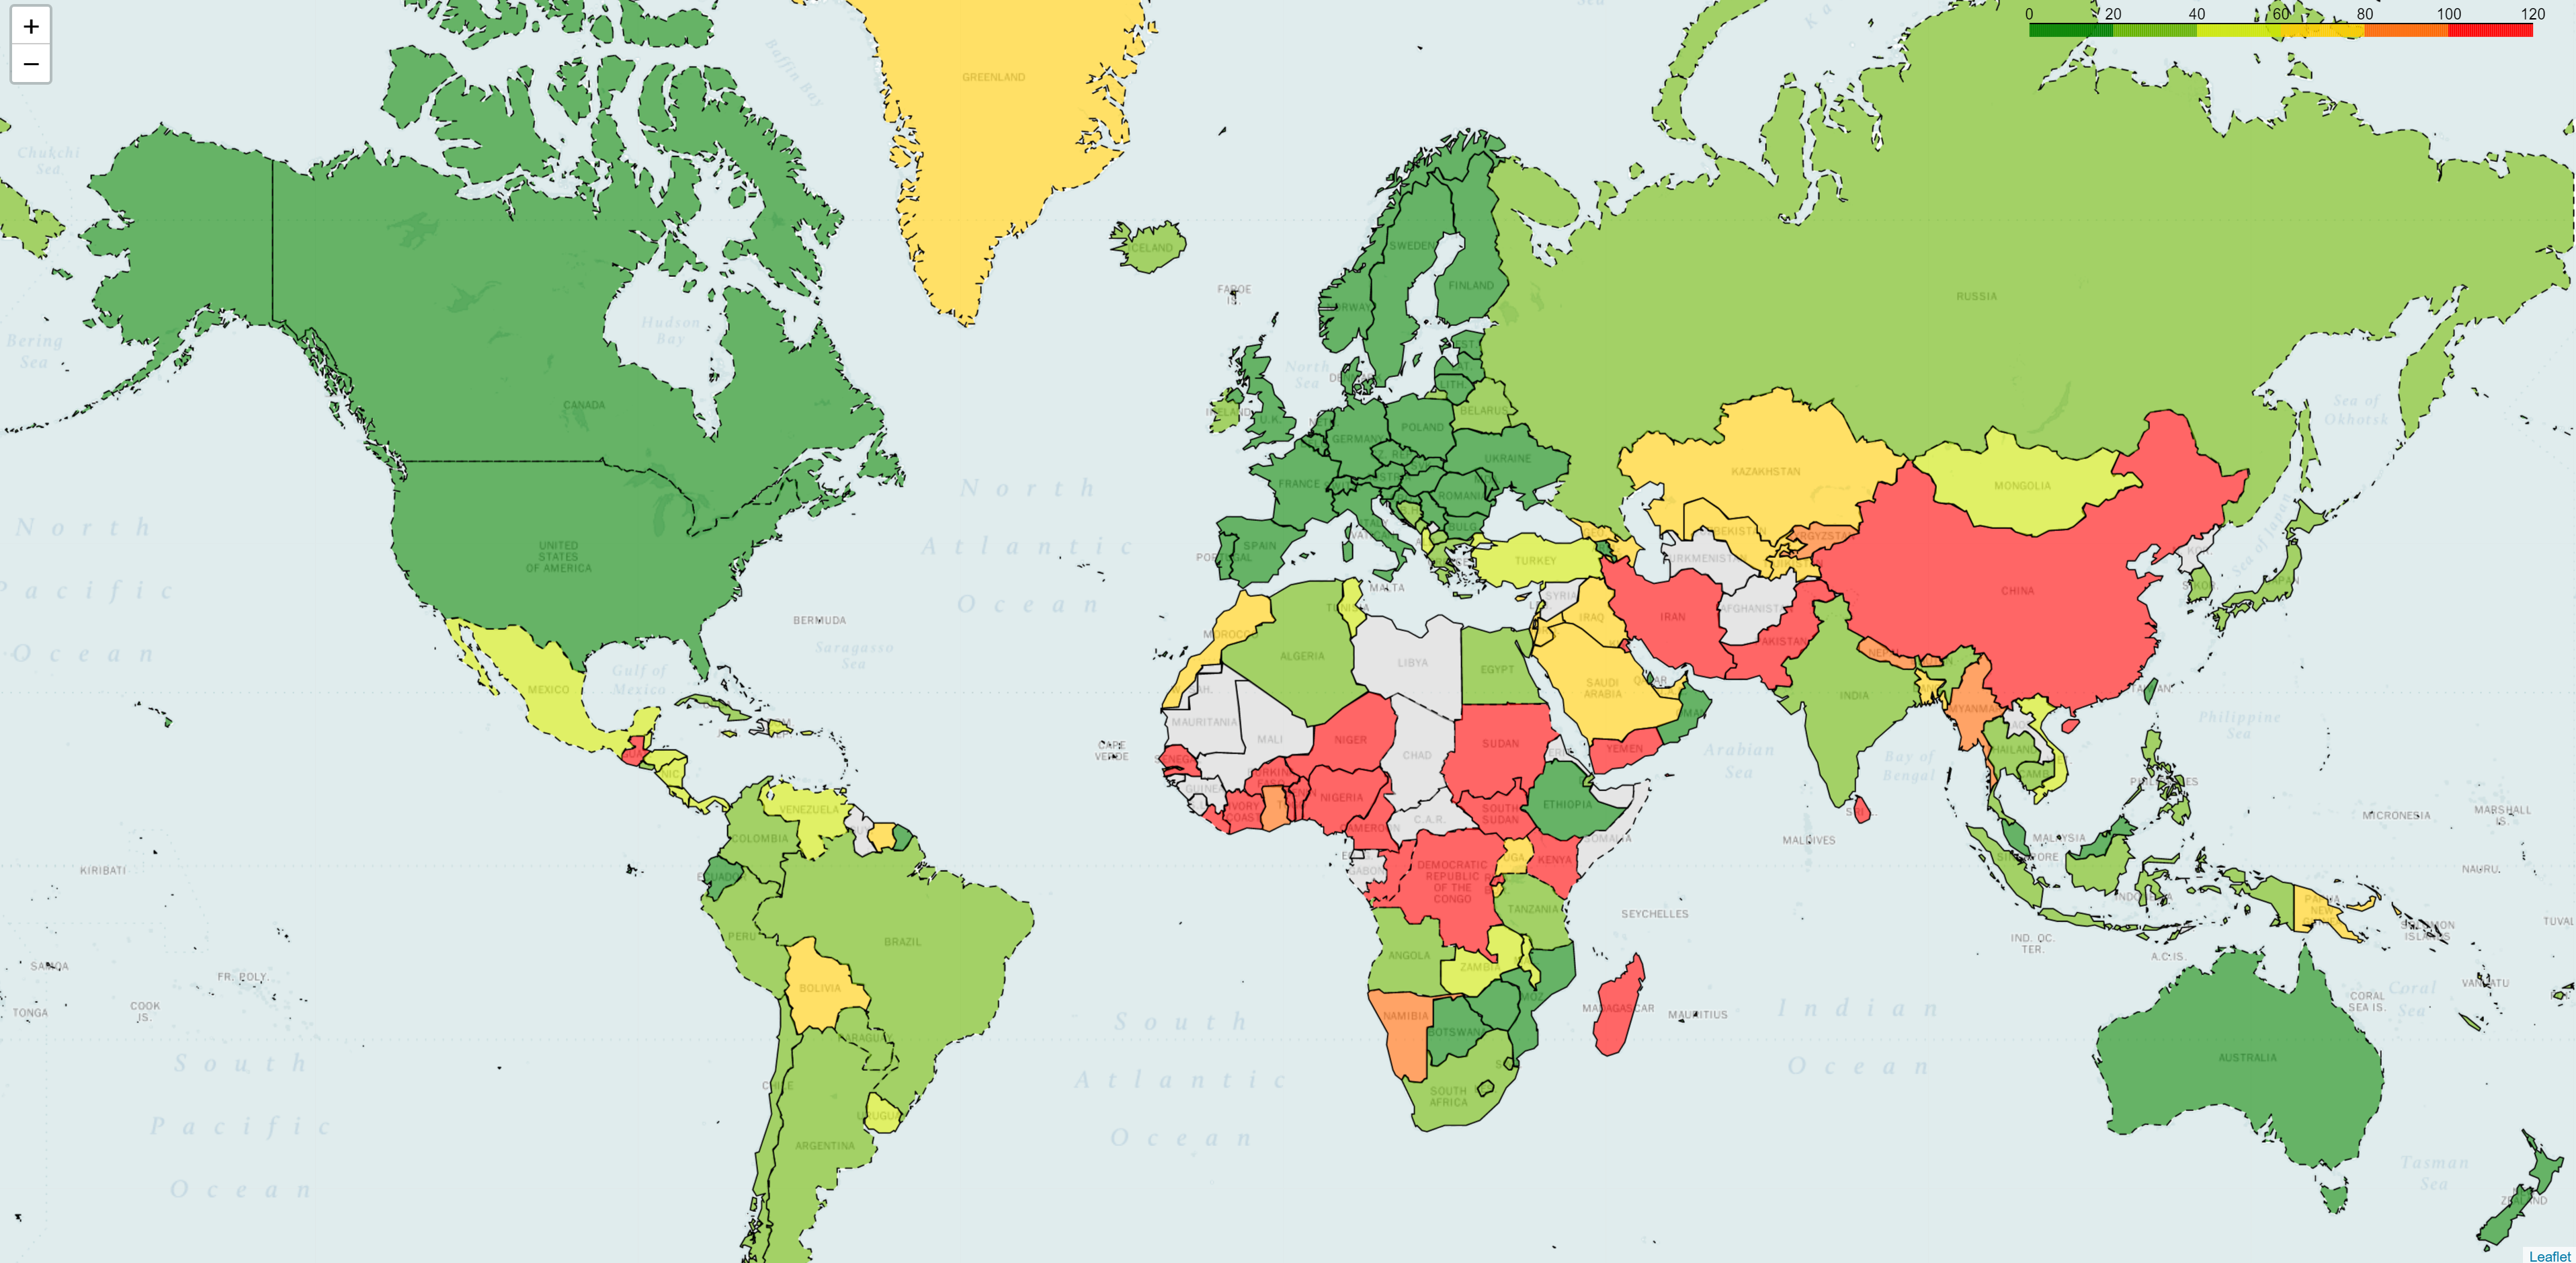
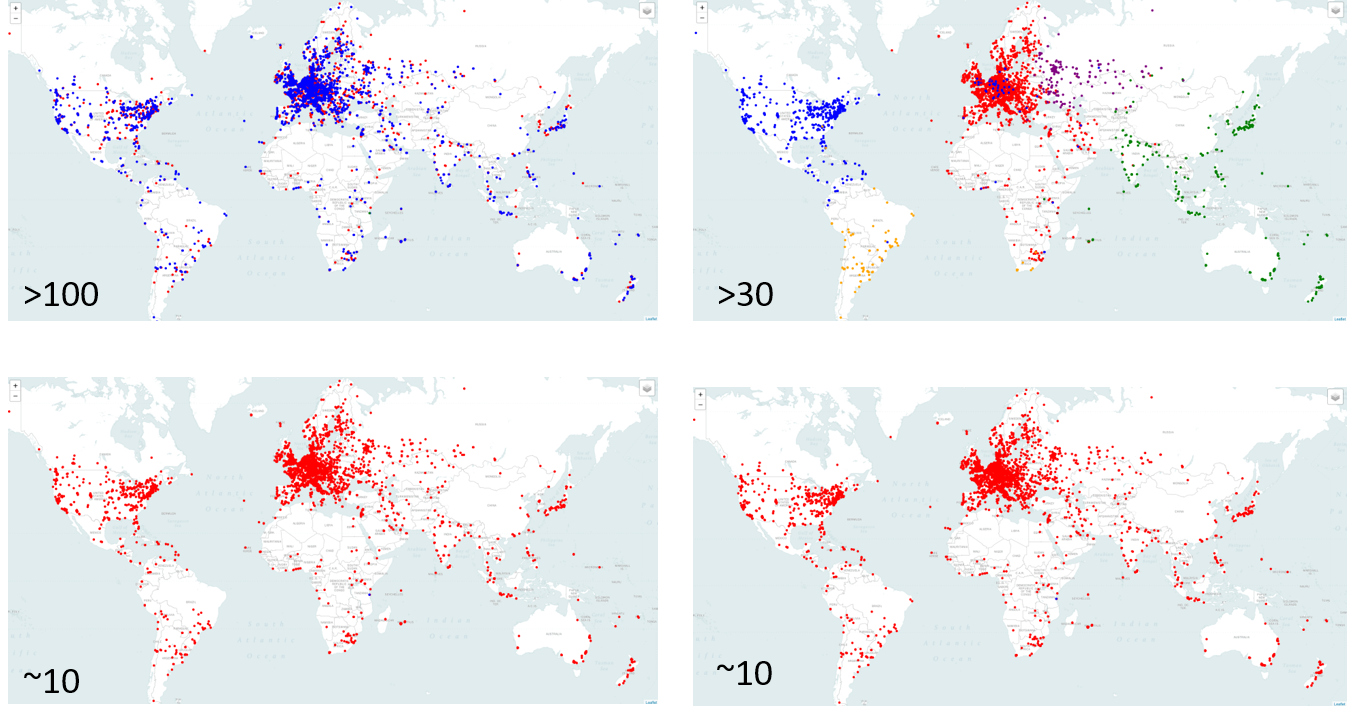
The first company claims on its website that there are more than 100 points of presence. The picture is beautiful and the delays, as we see, are globally quite low.
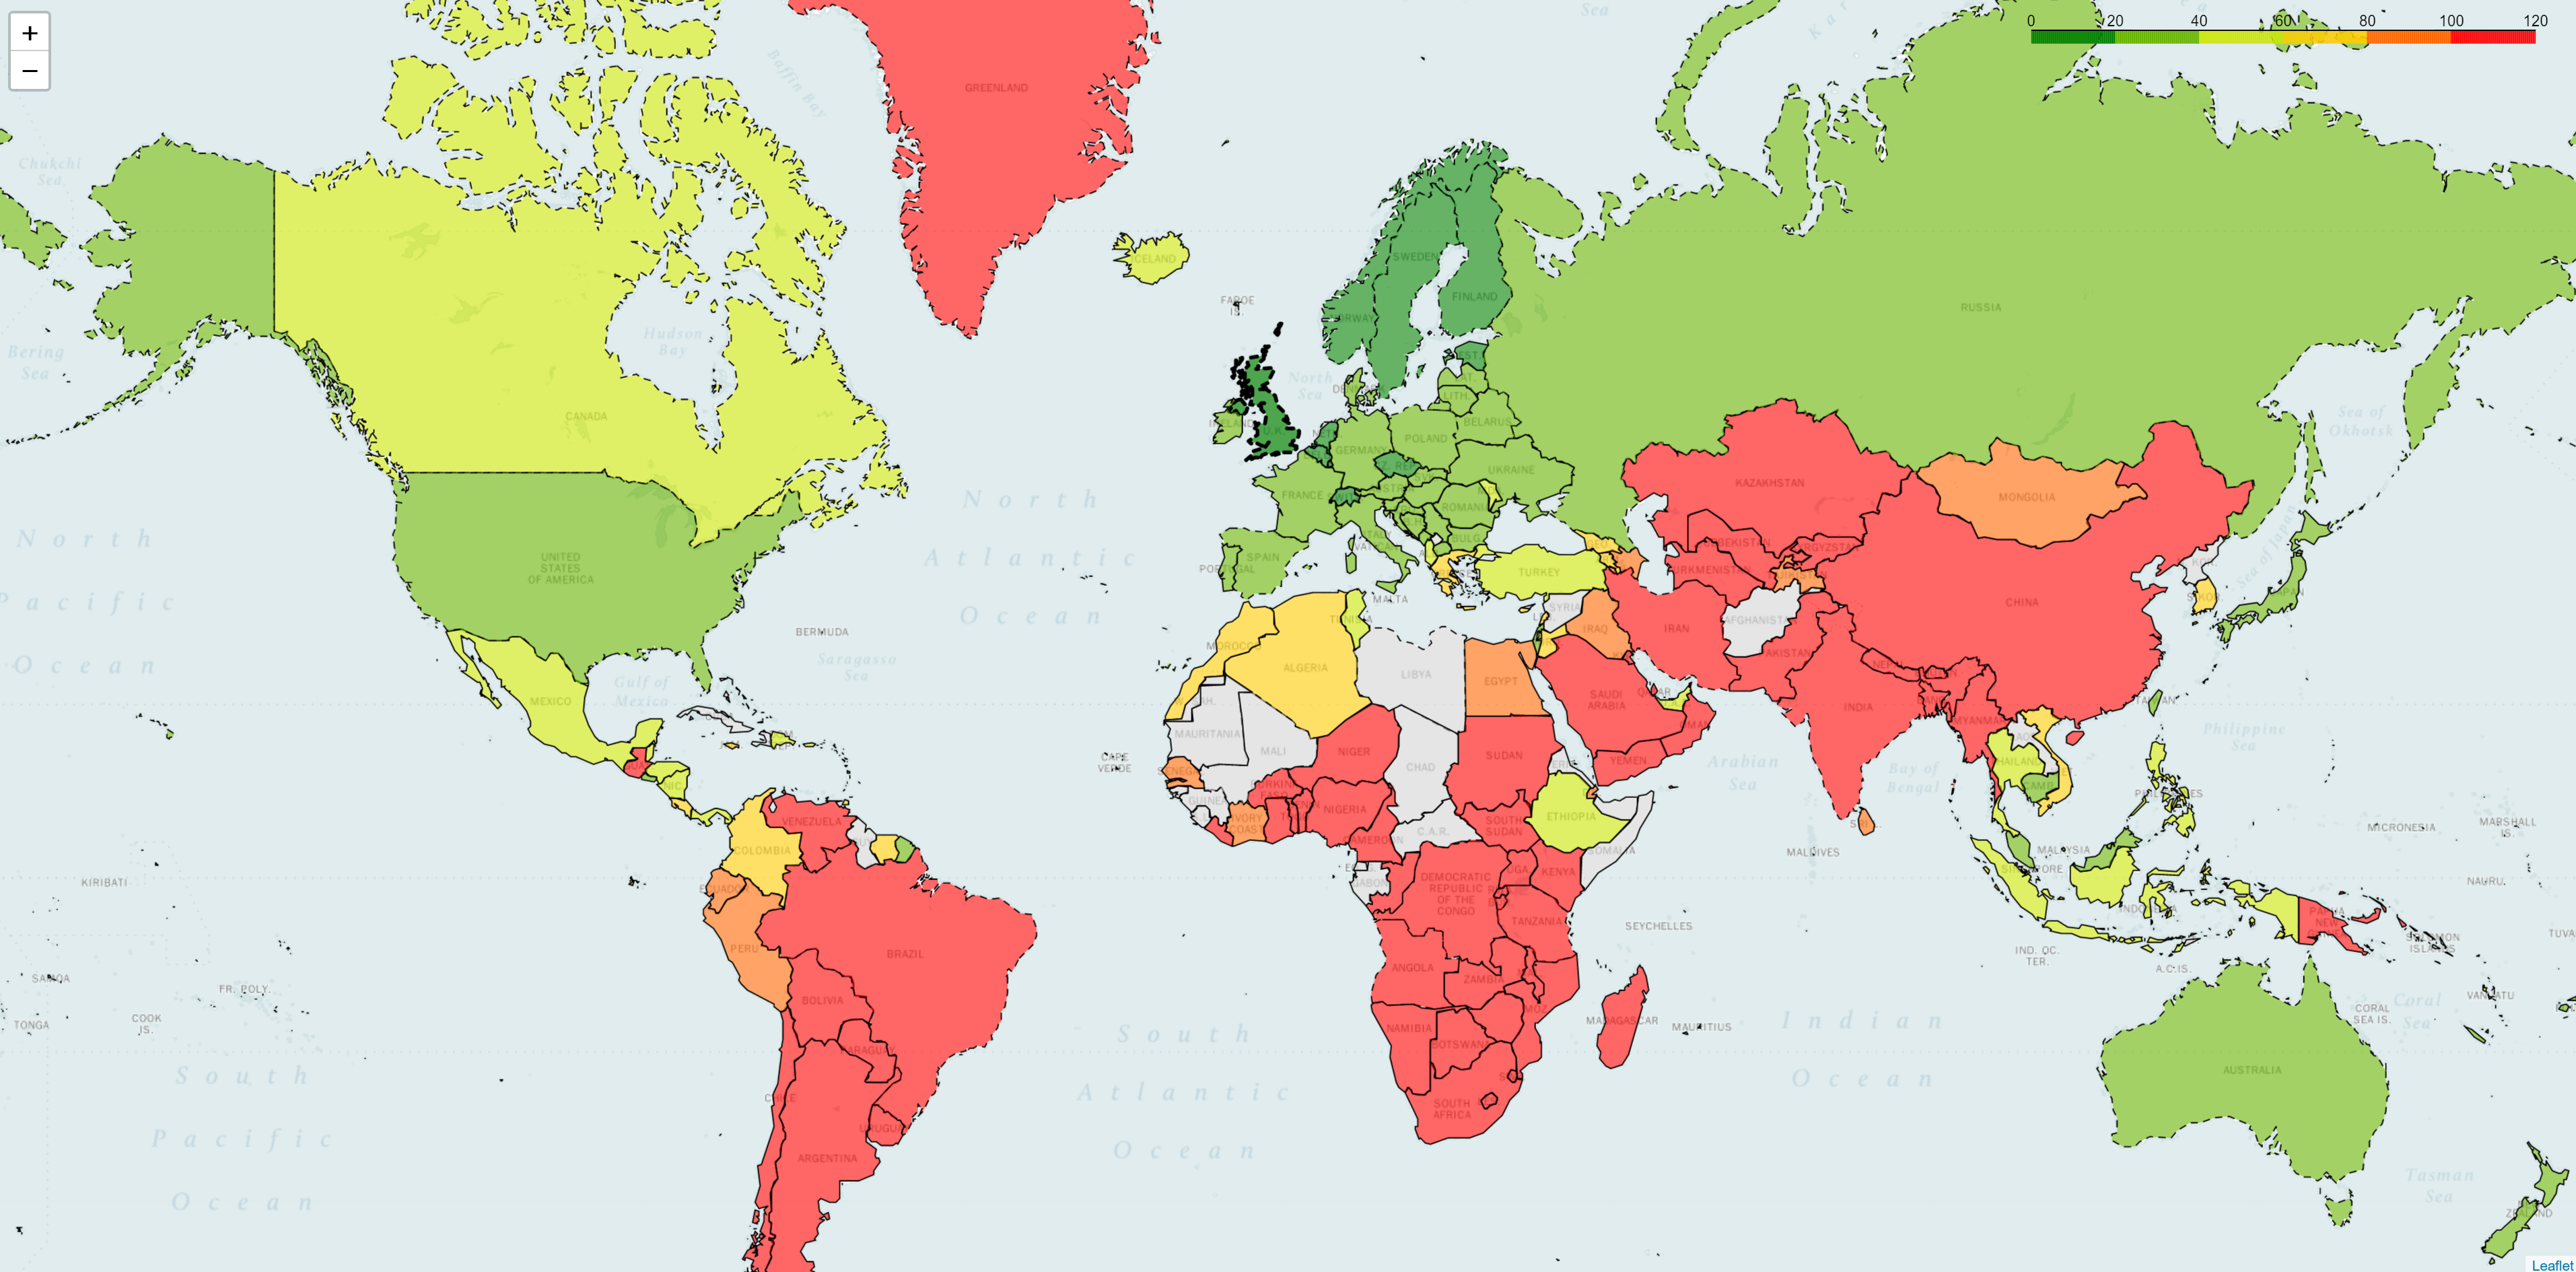
The second picture corresponds to a company with almost 40 points of presence, and, as you can see, the delay map has become worse.
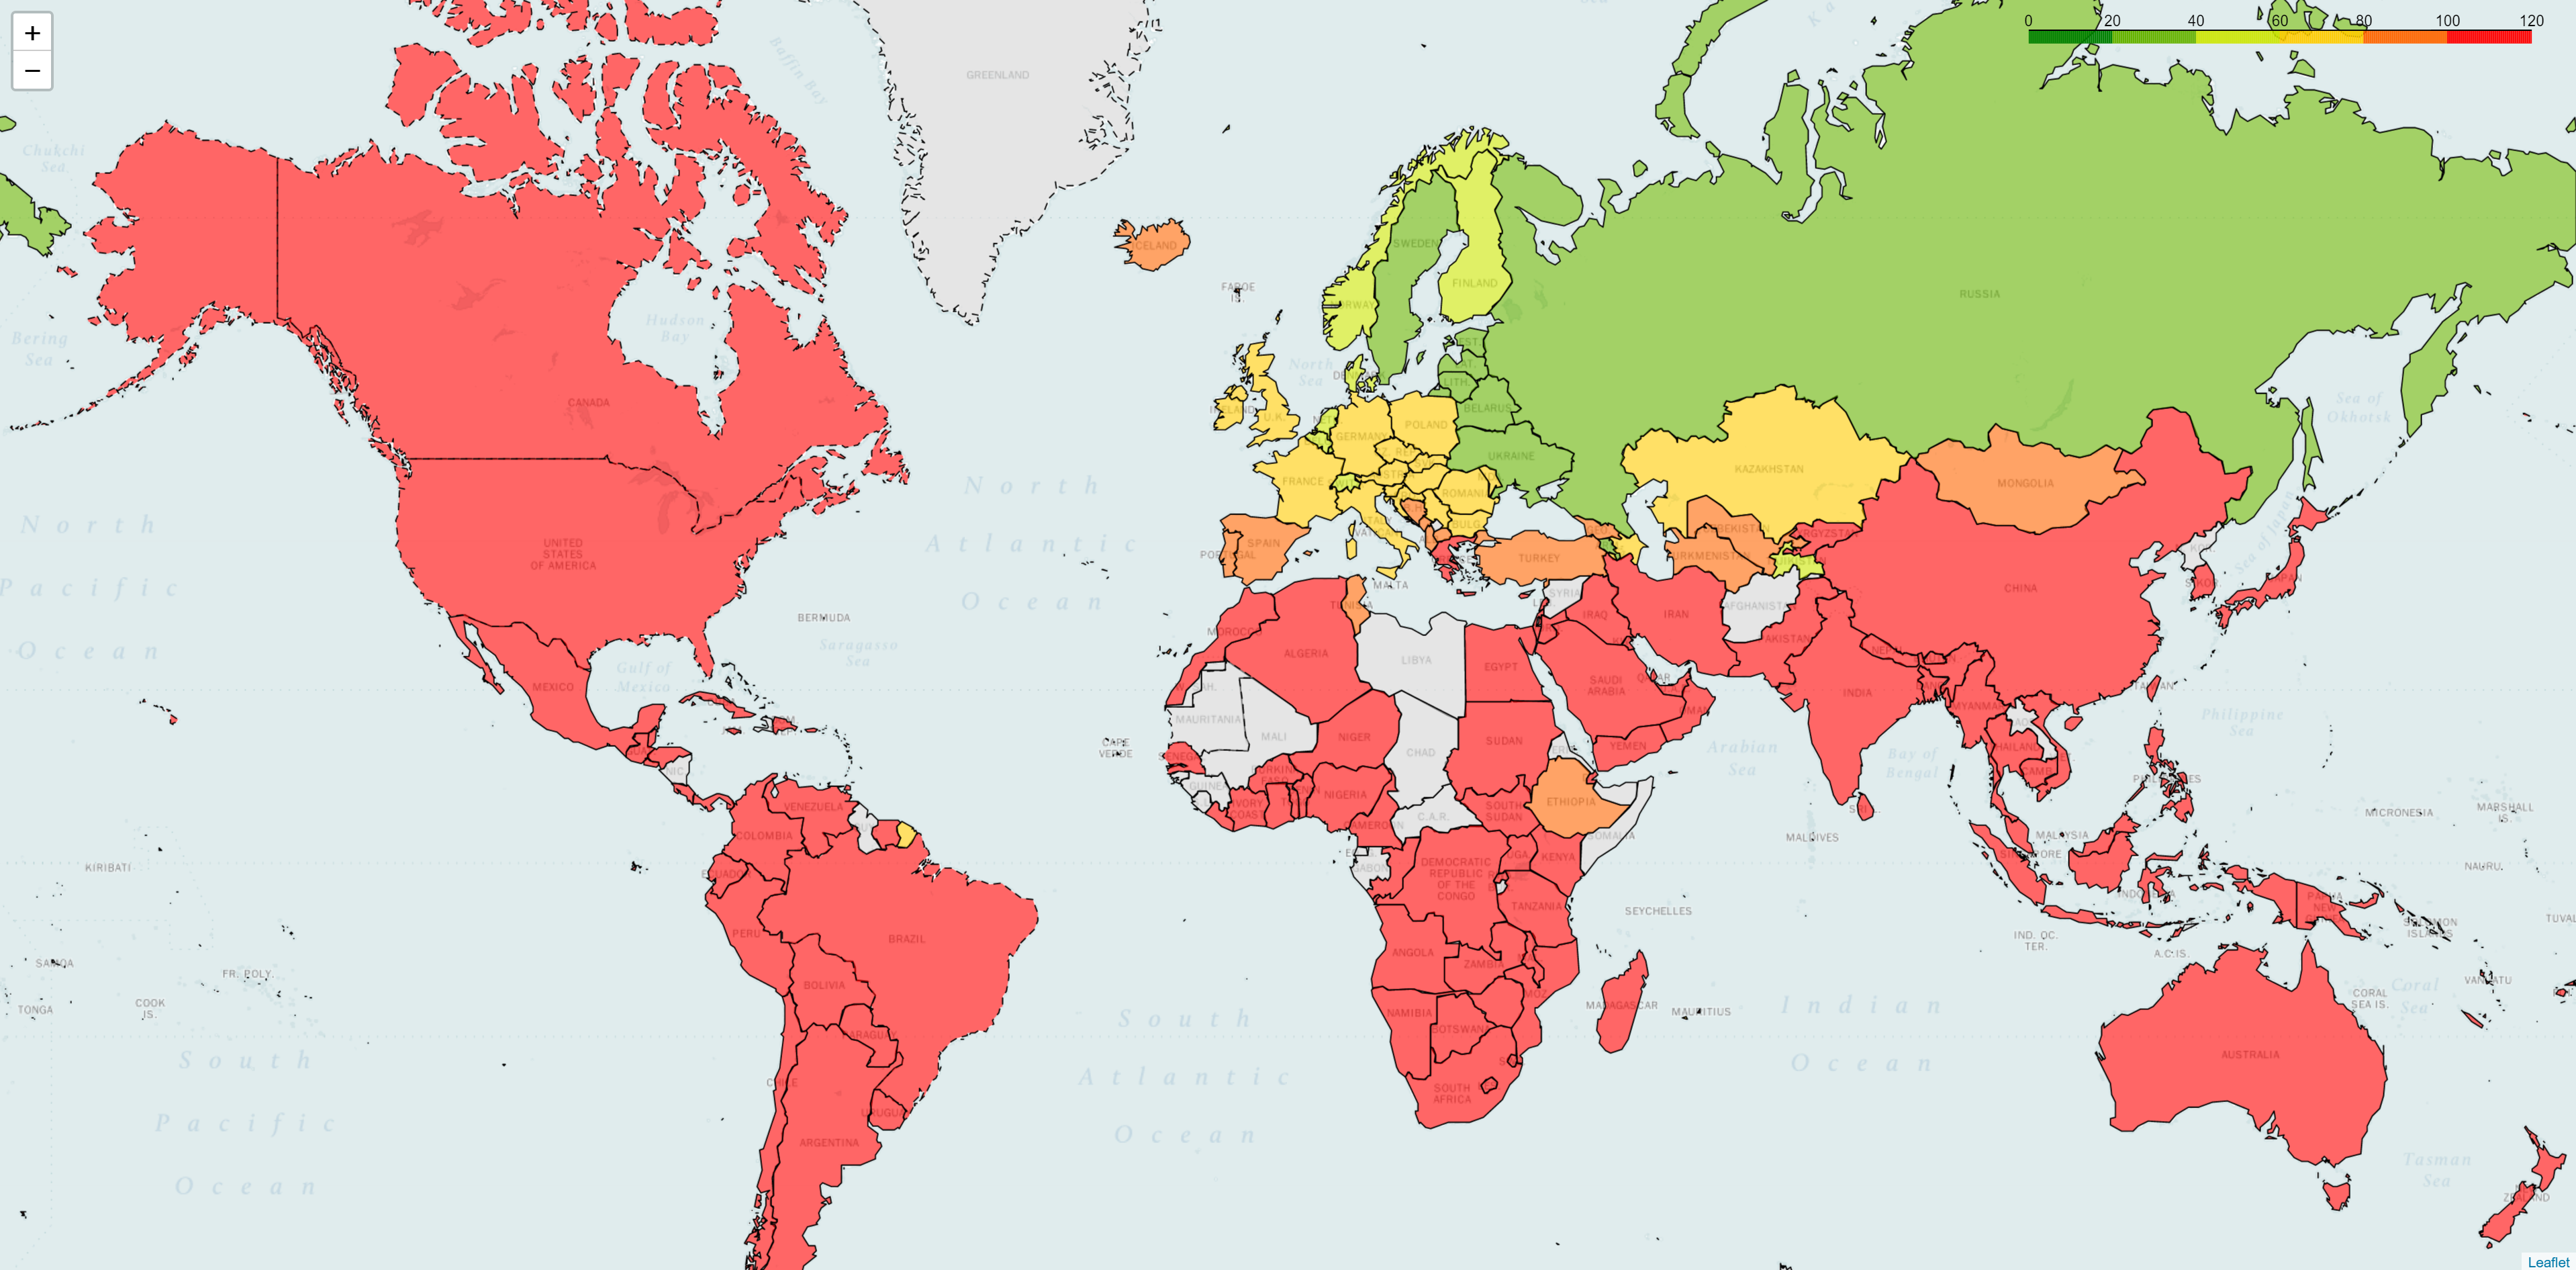
The next is a company with only 10 points of presence, and here it immediately catches the eye that the delays are quite high in most regions. But if you look at another operator, who also has 10 points of presence, the picture changes again for the better.
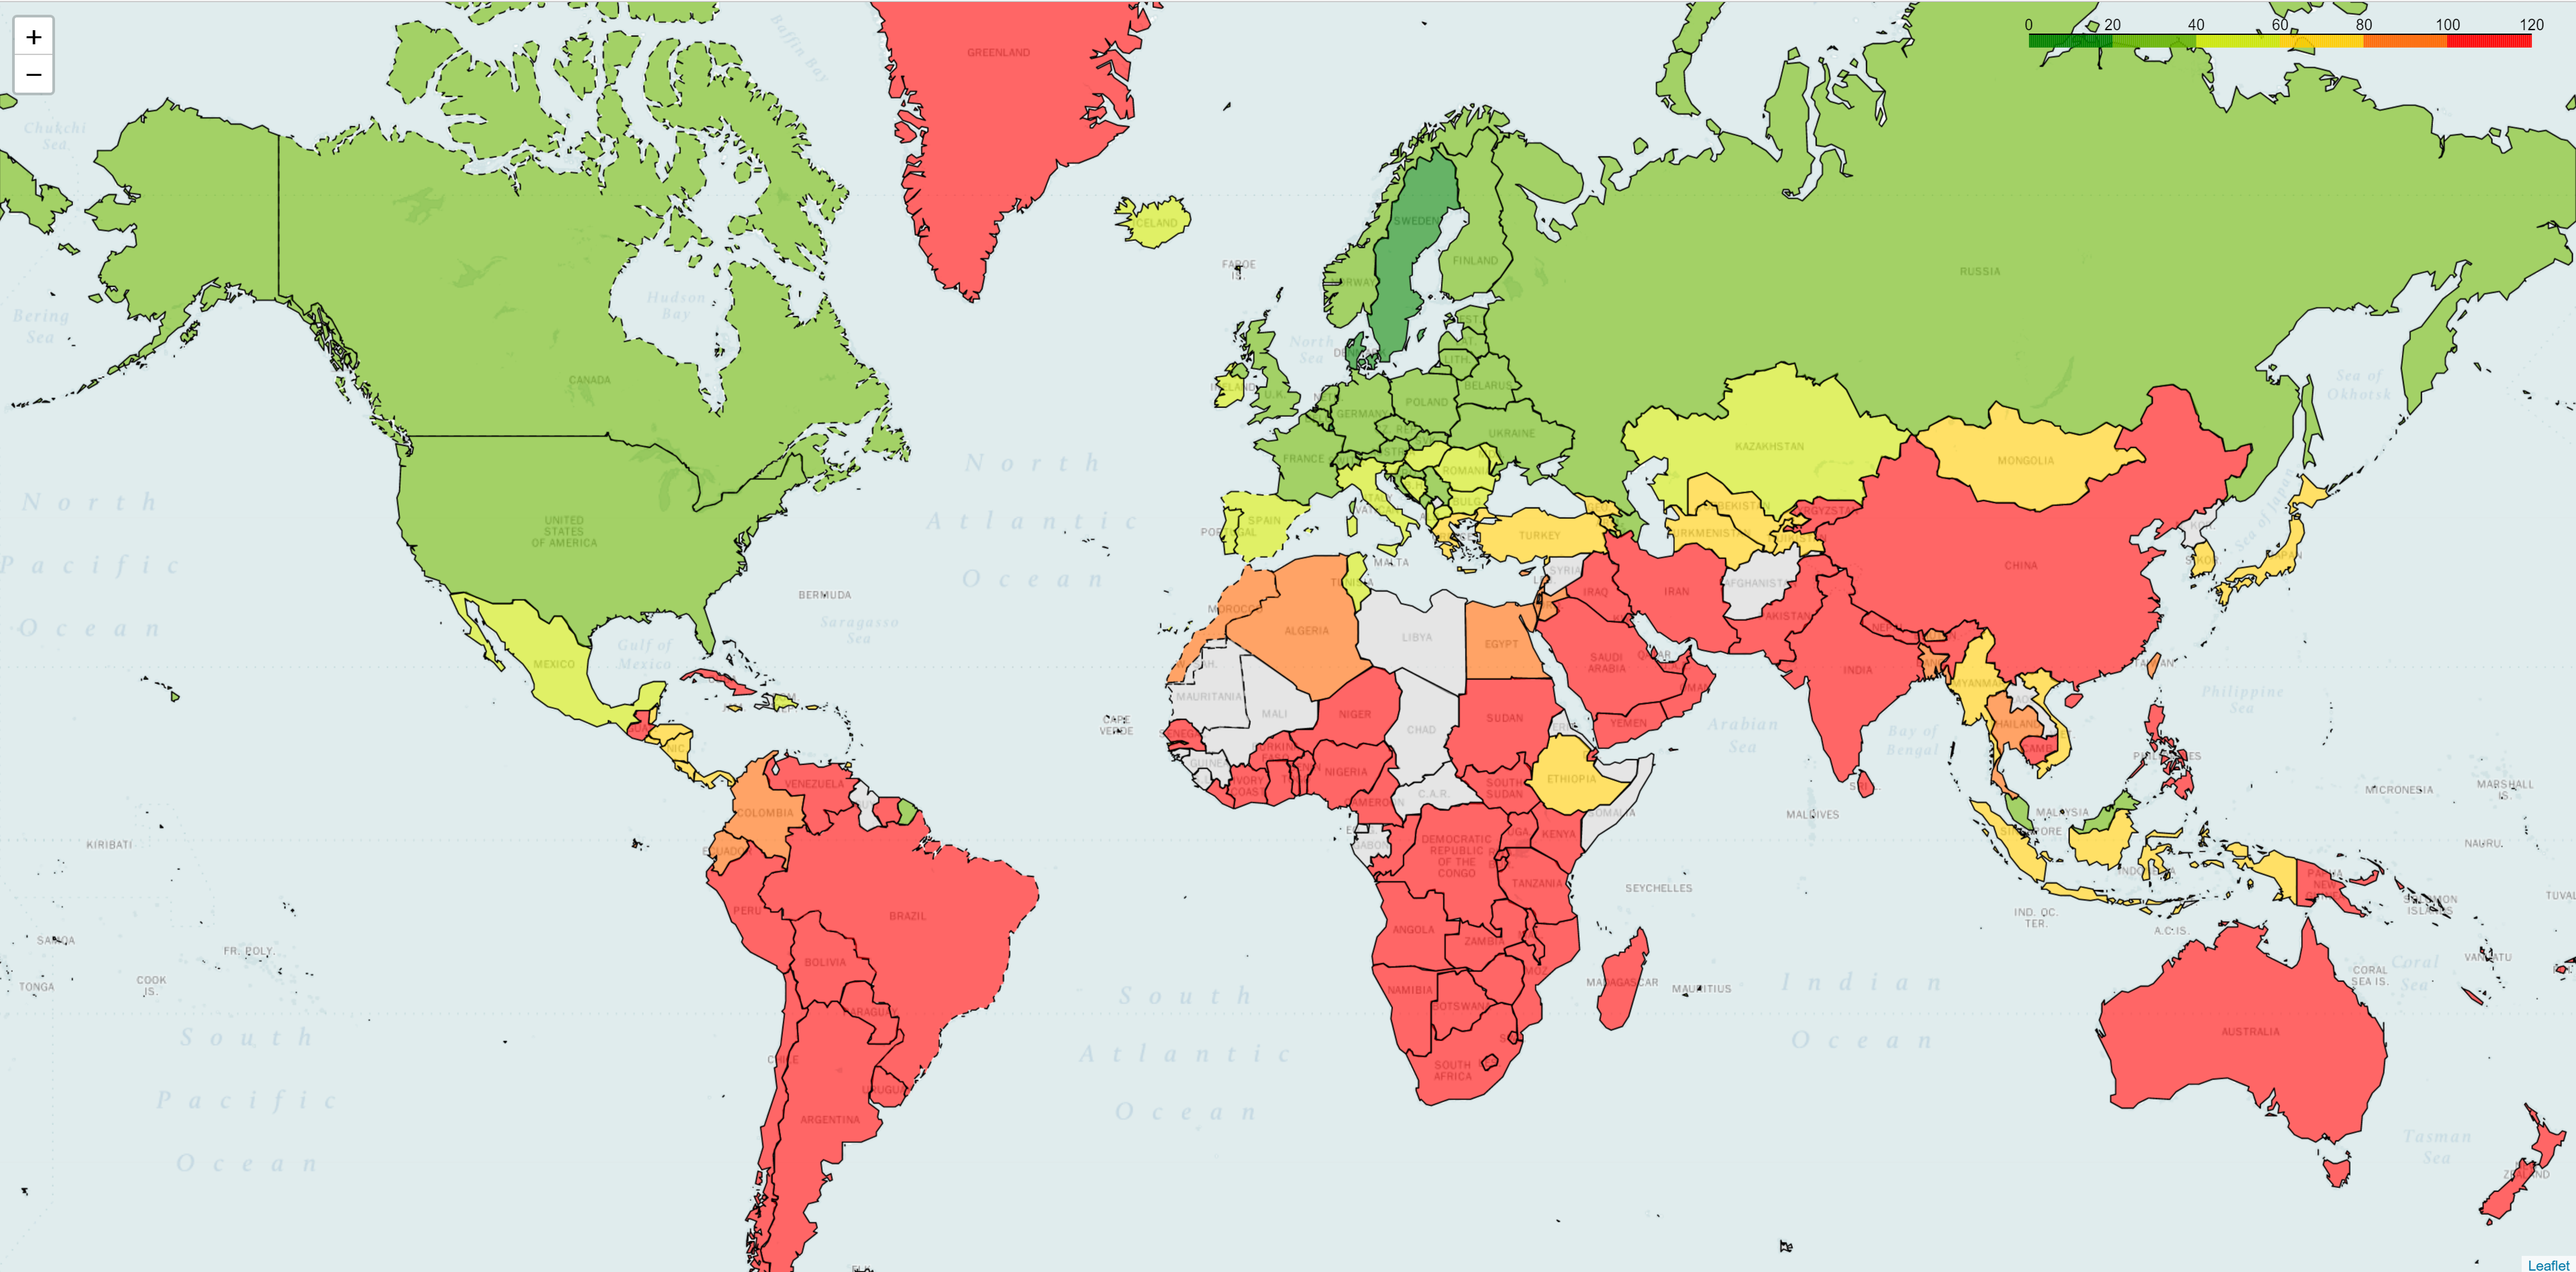
What is the conclusion? The number of PoP (point-of-presence, point of presence) and their geo-prevalence has a strong influence on the quality of the services provided, but this criterion cannot in itself be a silver bullet. So, the delay in networks with the same number of points of presence can give completely different results, and the network having several times less points of presence can still have very low delays in a given region.
Let's take a look at the problem from a different angle. What can give an analysis of the issuance of DNS in the analysis of the services provided by the network to filter traffic? The following picture shows that 2 out of 4 operators use DNS balancing to control traffic. In other cases, balancing is based only on BGP. Why is it important? Both BGP Anycast and GeoDNS are methods of localizing traffic within a region, as a result, which allow reducing delays for end users.
Historically, traffic balancing using GeoDNS has been popular among CDN providers (CDN). Compared to BGP Anycast, GeoDNS is easy to implement and monitor, there is a whole set of almost complete solutions. However, what applies to a CDN does not always apply to traffic filtering services. So, unlike normal users, bots can safely ignore the issue of a local DNS server and can easily create congestion in a particular region, ultimately taking even geo-distributed networks out of service.
As can be seen from this example, the possibility of a qualitative comparison can be very useful when choosing a particular service. And RIPE Atlas, with the set of methods implemented by us, greatly simplifies the analysis of the connectivity of telecom operators, DDoS-mitigation service providers and other services that you will definitely need tomorrow, and it is possible that today. All the source code for our toolkit is available on GitHub .
To use a set of tools, you must have virtual credits that are accrued to users for the work of the probes installed at them, as well as all owners of autonomous systems with LIR status. It is worth noting that the RIPE itself provides the samples at no cost .
For a long time this situation did not exist any alternative. Yes, there are analytical agencies comparing and analyzing market offers; again - how accessible are they and are we ready to trust them completely? Market share, the financial condition of the company and other “business metrics” may not say anything about the quality of the service and the service. At the moment we live in a world of brand comparison, and not the quality of the services they offer. In our opinion, this is a rather bad symptom for the market.
However, the situation is changing, and recently there have been opportunities to nevertheless carry out a quantitative and qualitative assessment of the desired service before it is purchased for free. And one of the best of these mechanisms is RIPE Atlas .
Atlas is a set of samples (probe - "probe", in the key network architecture - "sensor"), that is, some points to which you can send a task. Samples are located around the world, several hundred are within the state borders of the Russian Federation. There are two types of samples: large (anchors) are located in networks of telecom operators and data centers, and small ones, the size of a flash drive, can be put anywhere - even on a home router.
')
RIPE Atlas samples provide an excellent opportunity for qualitative research, analysis and comparison of networks. Independent of comparable services. RIPE Atlas did a great job on this service and provided a public API with a basic set of commands, such as ping, traceroute, HTTP get. However, like any API, it cannot by itself be an end product, and until recently there were no ready-made mechanisms to quickly conduct a qualitative assessment of various services. The Qrator.Radar team developed a measurement visualization tool, which includes several typical experiments, primarily several options for visualizing network delays (latency) and visualizing DNS issuance. Additionally, an emergency check mechanism for the availability of a given service was implemented, which is often needed by teams of network engineers.
As a demonstration of the capabilities of this toolkit, we made a comparison, taking (anonymized) four fairly large service providers for protection against DDoS attacks. We compared them primarily for delays. Why is it important to compare DDoS-mitigation services on this basis?
Historically, services to neutralize DDoS-attacks were created as services or equipment, which was included in the work immediately at the time of the attack. However, for many high-risk and high-margin services, the constant on-off of such a service or equipment still leads to temporary unavailability. As a result, in order to avoid downtime, services are gradually moving from the inclusion model under attack to the model of constant and continuous traffic filtering. But this imposes on the services that provide filtering services, additional requirements for low latency. According to a recent Akamai study , people's satisfaction decreases in proportion to the drop in the quality of the video being watched and the presence of problems with buffering, which are inextricably linked to network delays. Ping is extremely critical for online games and players, making it impossible to compete in the event of high delays. Network delays even affect how we search for information on the Internet and make related decisions. Milliseconds have a huge, sometimes invisible, effect.
The first company claims on its website that there are more than 100 points of presence. The picture is beautiful and the delays, as we see, are globally quite low.
The second picture corresponds to a company with almost 40 points of presence, and, as you can see, the delay map has become worse.
The next is a company with only 10 points of presence, and here it immediately catches the eye that the delays are quite high in most regions. But if you look at another operator, who also has 10 points of presence, the picture changes again for the better.
What is the conclusion? The number of PoP (point-of-presence, point of presence) and their geo-prevalence has a strong influence on the quality of the services provided, but this criterion cannot in itself be a silver bullet. So, the delay in networks with the same number of points of presence can give completely different results, and the network having several times less points of presence can still have very low delays in a given region.
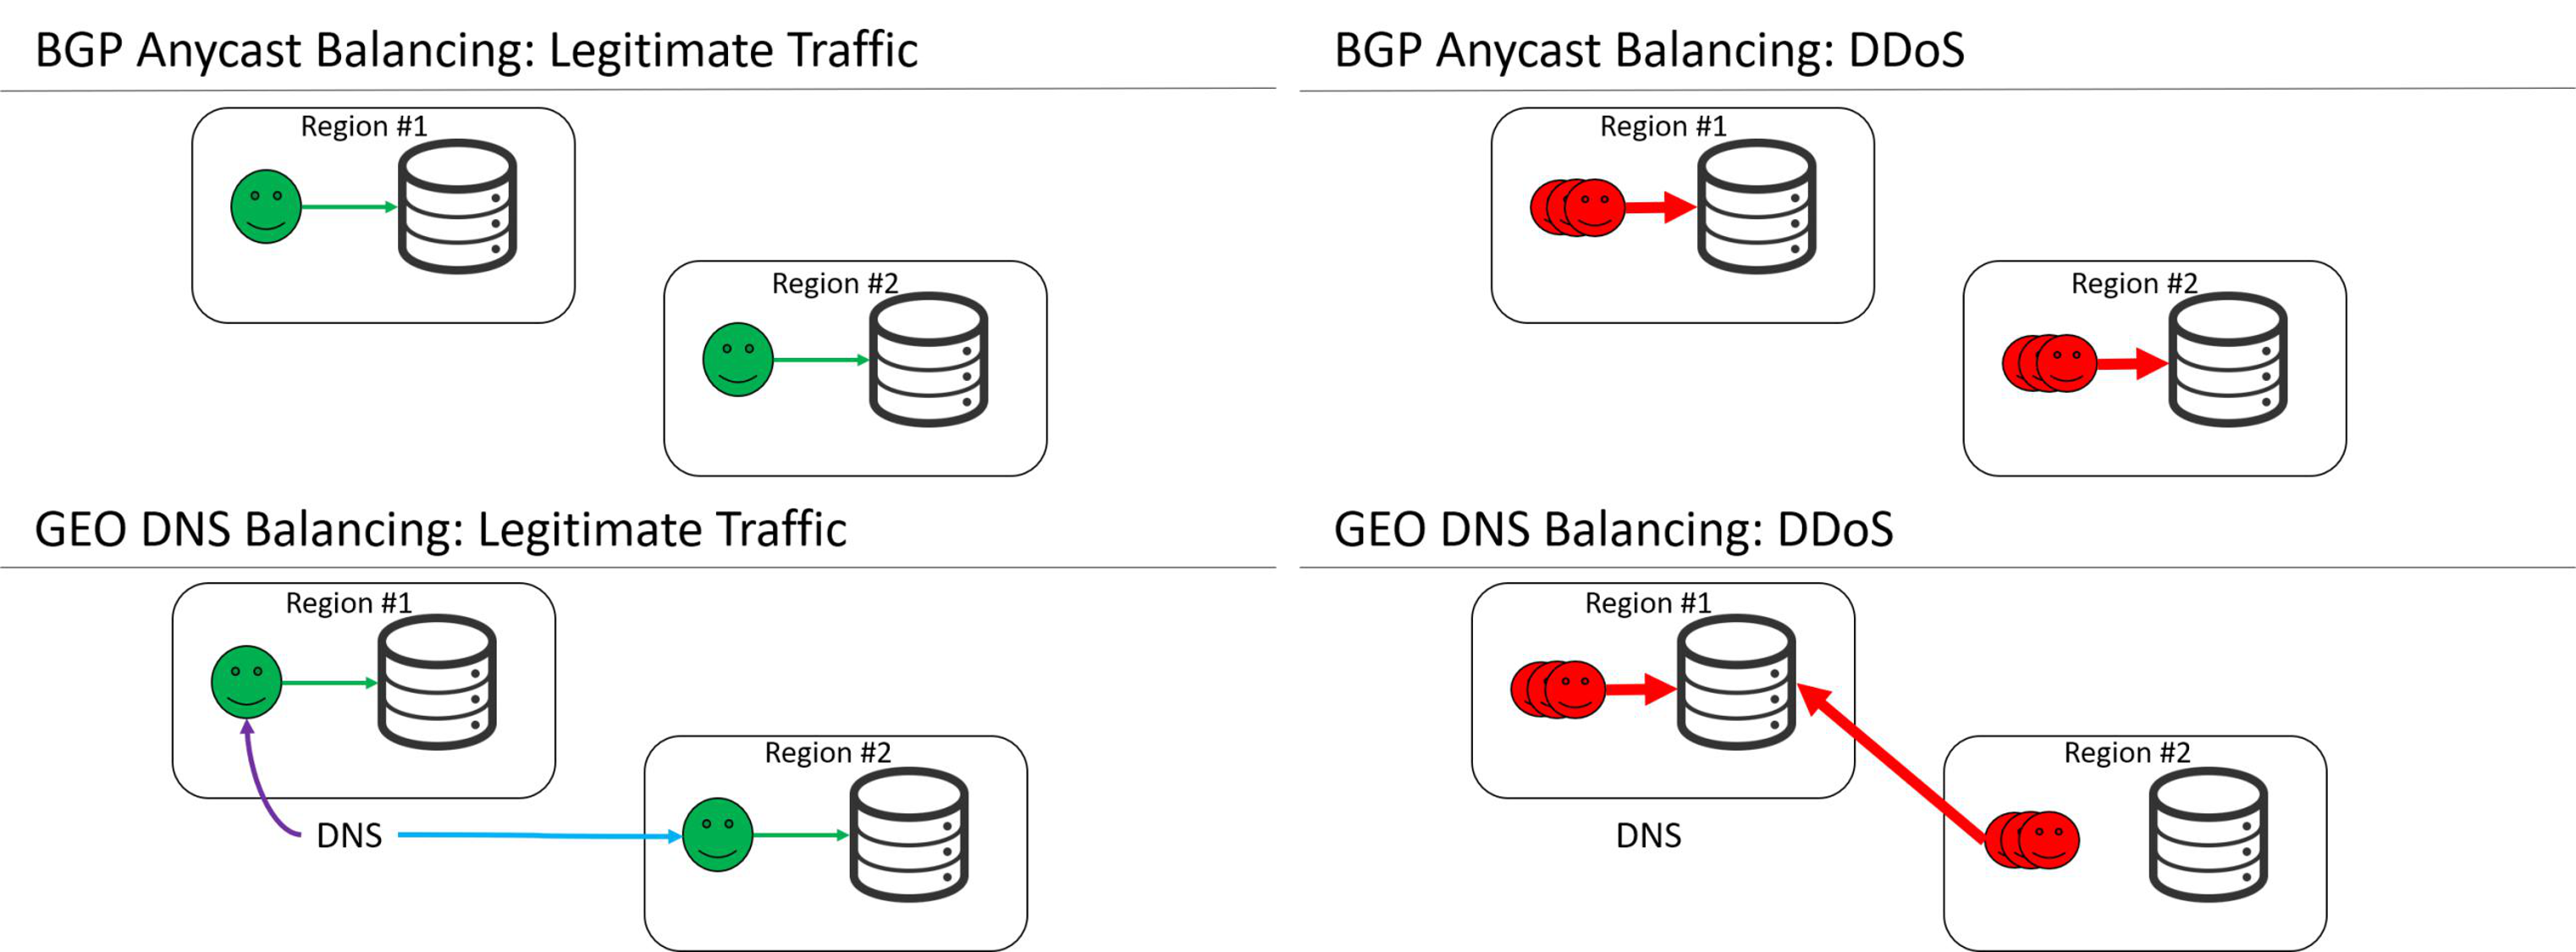
Let's take a look at the problem from a different angle. What can give an analysis of the issuance of DNS in the analysis of the services provided by the network to filter traffic? The following picture shows that 2 out of 4 operators use DNS balancing to control traffic. In other cases, balancing is based only on BGP. Why is it important? Both BGP Anycast and GeoDNS are methods of localizing traffic within a region, as a result, which allow reducing delays for end users.
Historically, traffic balancing using GeoDNS has been popular among CDN providers (CDN). Compared to BGP Anycast, GeoDNS is easy to implement and monitor, there is a whole set of almost complete solutions. However, what applies to a CDN does not always apply to traffic filtering services. So, unlike normal users, bots can safely ignore the issue of a local DNS server and can easily create congestion in a particular region, ultimately taking even geo-distributed networks out of service.
As can be seen from this example, the possibility of a qualitative comparison can be very useful when choosing a particular service. And RIPE Atlas, with the set of methods implemented by us, greatly simplifies the analysis of the connectivity of telecom operators, DDoS-mitigation service providers and other services that you will definitely need tomorrow, and it is possible that today. All the source code for our toolkit is available on GitHub .
To use a set of tools, you must have virtual credits that are accrued to users for the work of the probes installed at them, as well as all owners of autonomous systems with LIR status. It is worth noting that the RIPE itself provides the samples at no cost .
Source: https://habr.com/ru/post/347544/
All Articles