Method for analyzing multichannel user interaction
Good all!
Here are our legs and got to the non-IT specialties - “Digital marketer” . The course is taught by Victoria Alexandrova , the head of the marketing department at OTUS, which is sharing this article today.
Go
')
Sooner or later, any internet marketer is faced with the problem of optimizing the budget for promotion. It is necessary either to get the same number of conversions while reducing the budget, or to get a greater number of conversions for the same budget. And sometimes both.
The best result in solving this problem usually gives an integrated approach:

Today we will talk about one side of the coin - identifying advertising channels with low efficiency. This question, by the way, is relevant not only in the context of budget optimization. When searching and testing new advertising sites, marketers are faced with a similar question: how to correctly evaluate the effectiveness of the new channel based on the results of test placement?
It would seem that there is nothing difficult in identifying channels with low efficiency: I looked at the statistics, looked at the CPC and CPA, chose channels with the highest CPA, turned it off. The budget (if necessary) transferred to the channels with the lowest CPA. Is done. But in practice it is often the case that turning off one channel, which generates a small share of sales with high CPA sales, leads to a noticeable drop in conversions through other (very different) channels. What is the reason? In the lack of analytical data. How to be?
To begin with, let's see what our product is and how our users decide to purchase. After all, their behavior will largely depend on finding us before making a decision about the purchase and return. I would single out four types of products:
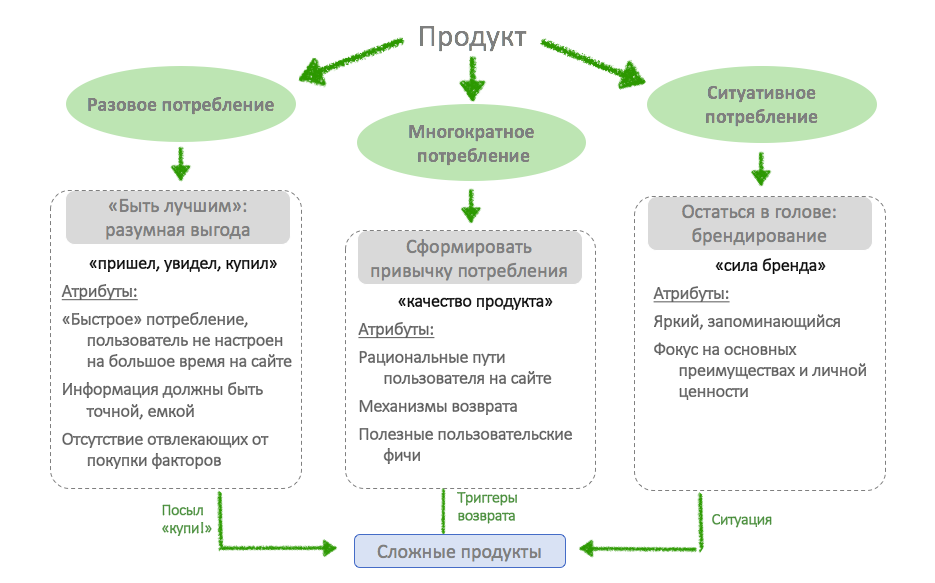
Understanding the type of product will allow you to choose the method of analysis. In the case of a single-use product, it makes no sense to get lost in the wilds of returns, a large number of touches and attributions. It is worth studying the behavior of users from the advertising channel on the site - are there any blockers for conversion? If we are dealing with a product of multiple consumption, then returns and life cycle of the user, methods of reminding about themselves and boosters interfere with business (do you have everything with sending letters and retargeting?). If you are working with a product of situational consumption, then think about the possibility of predicting re-treatment - perhaps your user needs your product regularly. If you are the first to offer your product on time, the probability of a purchase will be very high.
In the case of complex products, among other things, we will have to pay attention to the length of the decision-making cycle and on the black box of the marketing mix of channels during the decision-making cycle on purchasing.
So, how to determine the length of the cycle of decision making by the user about the purchase. Simply put, we need to determine the following points in time:
Measuring the number of days between these points will provide insight into the cycle time for making a purchase decision (and re-purchase). Intentionally didn’t mark the client’s “dying” point (stopped coming to the site altogether), because to assign a customer to this category with a certain probability. you need to have an understanding of the standard decision cycle length. We do not forget that each product may have its own characteristics - somewhere there is no need for registration, somewhere the moment of the first visit and registration coincides in most cases, etc. However, the definition in time of these points will give an understanding of how long the customer thinks before buying.
Do not forget that, depending on the channel (globally organic / advertising and the point of each advertising platform), the length of decision-making cycles may differ significantly. So, for example, search contextual advertising is considered to be primarily the “fast” channel (the user is most willing to purchase because he is looking for a product), and content promotion on the thematic portals (in the thematic communities) is mostly the “long” channel (because users are ready to read about the product, but not strongly motivated to buy). Respectively, “long” channels usually need “boost” free (e-mail) or paid (retargeting, advertising) activities. Hi, marketing mix :) Well, are you ready to open the black box of the marketing mix and see which channels influence the users who have made the purchase how and when? Perfectly!
Then on the available data on the decision-making cycle we impose the interaction of customers with the site with the indication of the source and we get a complete picture: how long the user thought and what prompted him to buy; which channels participated in the “ripening” of the client, and which did not.
It seems that the problem has been solved, but marketers, who have had experience in analyzing data, probably thought that if you analyze each advertising platform and each client, then there will be a huge number of cuts. And the more clients, the more unique chains will be - it means that the data will be heterogeneous and no conclusions can be drawn. And what about projects, where hundreds of clients? I see only one solution - to enlarge the sections.
How does it work in practice? Here is a case in steps:
Here you can add a third time point and its channel, you can add to the comparison the last period - it all depends on the amount of data. You can drill down to the point where the data will no longer be suitable for clear analysis.
The resulting table can not only be analyzed for testing different hypotheses, but also to display some slices graphically. For example, for each channel of the first touch, we use a bubble chart, where the OX axis is the closing channel, the OU axis is the decision time, the bubble size is the purchase amount.

This presentation allows you to visually understand the speed of closing channels, as they overlap, where you have to “buy” a client at least twice.
By the way, the reverse thing can be done with those customers who have not reached the goal and compare how much the results obtained differ from the cutoff for the customers who have made the purchase.
Having such an analysis minimizes the likelihood of an error when switching off low-efficiency channels.
THE END
As always, we welcome your comments, questions and suggestions here or at our Open House.
Here are our legs and got to the non-IT specialties - “Digital marketer” . The course is taught by Victoria Alexandrova , the head of the marketing department at OTUS, which is sharing this article today.
Go
')
Sooner or later, any internet marketer is faced with the problem of optimizing the budget for promotion. It is necessary either to get the same number of conversions while reducing the budget, or to get a greater number of conversions for the same budget. And sometimes both.
The best result in solving this problem usually gives an integrated approach:
- optimize advertising campaigns in the channel (lower the cost per click if you are talking about an auction or, for example, change the targeting in order to minimize the display of untargeted audiences and the same amount of audience to buy cheaper);
- turn off ineffective advertising channels (and / or redistribute the budget towards effective channels, if they have not yet exhausted the capacity).
Today we will talk about one side of the coin - identifying advertising channels with low efficiency. This question, by the way, is relevant not only in the context of budget optimization. When searching and testing new advertising sites, marketers are faced with a similar question: how to correctly evaluate the effectiveness of the new channel based on the results of test placement?
It would seem that there is nothing difficult in identifying channels with low efficiency: I looked at the statistics, looked at the CPC and CPA, chose channels with the highest CPA, turned it off. The budget (if necessary) transferred to the channels with the lowest CPA. Is done. But in practice it is often the case that turning off one channel, which generates a small share of sales with high CPA sales, leads to a noticeable drop in conversions through other (very different) channels. What is the reason? In the lack of analytical data. How to be?
To begin with, let's see what our product is and how our users decide to purchase. After all, their behavior will largely depend on finding us before making a decision about the purchase and return. I would single out four types of products:
- products of single consumption (the decision is made quickly, the study of competitors is minimal - came, saw, bought);
- products of multiple consumption (the choice of "long-term", thoughtful decision);
- products of situational consumption (they are searched and used only when the user is in a certain situation);
- complex products (they lie at the junction of previous types. These are products with a long decision-making cycle, where the trigger for making a purchase decision can be both a situation in which the user finds itself and a good creative or discount, and, possibly, “matured” user's opinion about the high quality of the product);
Understanding the type of product will allow you to choose the method of analysis. In the case of a single-use product, it makes no sense to get lost in the wilds of returns, a large number of touches and attributions. It is worth studying the behavior of users from the advertising channel on the site - are there any blockers for conversion? If we are dealing with a product of multiple consumption, then returns and life cycle of the user, methods of reminding about themselves and boosters interfere with business (do you have everything with sending letters and retargeting?). If you are working with a product of situational consumption, then think about the possibility of predicting re-treatment - perhaps your user needs your product regularly. If you are the first to offer your product on time, the probability of a purchase will be very high.
In the case of complex products, among other things, we will have to pay attention to the length of the decision-making cycle and on the black box of the marketing mix of channels during the decision-making cycle on purchasing.
So, how to determine the length of the cycle of decision making by the user about the purchase. Simply put, we need to determine the following points in time:
- first visit to the site;
- check in;
- making a purchase;
- making a re-purchase.
Measuring the number of days between these points will provide insight into the cycle time for making a purchase decision (and re-purchase). Intentionally didn’t mark the client’s “dying” point (stopped coming to the site altogether), because to assign a customer to this category with a certain probability. you need to have an understanding of the standard decision cycle length. We do not forget that each product may have its own characteristics - somewhere there is no need for registration, somewhere the moment of the first visit and registration coincides in most cases, etc. However, the definition in time of these points will give an understanding of how long the customer thinks before buying.
Do not forget that, depending on the channel (globally organic / advertising and the point of each advertising platform), the length of decision-making cycles may differ significantly. So, for example, search contextual advertising is considered to be primarily the “fast” channel (the user is most willing to purchase because he is looking for a product), and content promotion on the thematic portals (in the thematic communities) is mostly the “long” channel (because users are ready to read about the product, but not strongly motivated to buy). Respectively, “long” channels usually need “boost” free (e-mail) or paid (retargeting, advertising) activities. Hi, marketing mix :) Well, are you ready to open the black box of the marketing mix and see which channels influence the users who have made the purchase how and when? Perfectly!
Then on the available data on the decision-making cycle we impose the interaction of customers with the site with the indication of the source and we get a complete picture: how long the user thought and what prompted him to buy; which channels participated in the “ripening” of the client, and which did not.
It seems that the problem has been solved, but marketers, who have had experience in analyzing data, probably thought that if you analyze each advertising platform and each client, then there will be a huge number of cuts. And the more clients, the more unique chains will be - it means that the data will be heterogeneous and no conclusions can be drawn. And what about projects, where hundreds of clients? I see only one solution - to enlarge the sections.
How does it work in practice? Here is a case in steps:
- We take a list of customers who have made a purchase for a certain period.
- We determine the dates of key points (for example, the first visit to the site and purchase). We consider the difference in days between points.
- We determine the sources of transitions that led to the achievement of key points (for example, the utm of the first visit and the utm of the purchase).
- Add the amount for which the customer made a purchase (after all, it happens that the channel generates a lot of sales, but at the same time they have a high average bill).
Here you can add a third time point and its channel, you can add to the comparison the last period - it all depends on the amount of data. You can drill down to the point where the data will no longer be suitable for clear analysis.
The resulting table can not only be analyzed for testing different hypotheses, but also to display some slices graphically. For example, for each channel of the first touch, we use a bubble chart, where the OX axis is the closing channel, the OU axis is the decision time, the bubble size is the purchase amount.
This presentation allows you to visually understand the speed of closing channels, as they overlap, where you have to “buy” a client at least twice.
By the way, the reverse thing can be done with those customers who have not reached the goal and compare how much the results obtained differ from the cutoff for the customers who have made the purchase.
Having such an analysis minimizes the likelihood of an error when switching off low-efficiency channels.
THE END
As always, we welcome your comments, questions and suggestions here or at our Open House.
Source: https://habr.com/ru/post/347412/
All Articles