How we built the data infrastructure in Wish
I came to Wish 2.5 years ago, things were going great in the company. Our application was in the top in iOS and Android stores and sold more than 2 million products a day.
Few people believed that you could build a big business by selling cheap goods. However, using the data, Wish was able to challenge these doubts. Data analytics has always been in our blood.
But when our business began to grow at a tremendous pace, we were not ready for this, we discovered many problems with analytics. Each team within the company began to need urgent support in working with data and lost a lot of things in its field of activity. At that time, our analytical capabilities were still in its infancy and could not satisfy the ever-increasing demand.
')
In this post, I will talk about the lessons we have learned during this time, and also sign for the right path for companies looking for ways to scale their analytical functions.
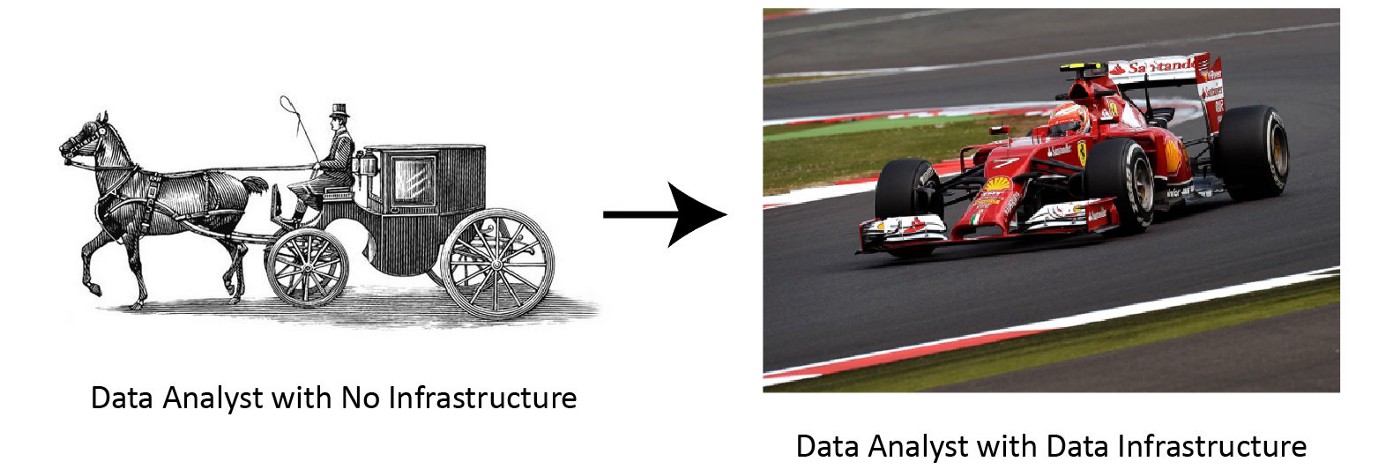
There were many problems, primarily with access to data. The only ones who could extract data and build reports were the engineers working on the product, and since the data infrastructure was completely raw, we could not hire analysts to help. As a result, the execution of data queries and report building could take weeks.
Over the next 2 years, we worked tirelessly to build analytics in the company. We have built a data pipeline from scratch that allows engineers, analysts and data scientists to perform ETL processes reliably and safely for their work. The data warehouse was collected in Redshift and BigQuery with core tables that support secondary tables used by analysts. We also deployed the BI Looker platform, which is now used as a company’s data source, which means more than 200 employees on three continents.
To date, more than 30 people at Wish are engaged in analytics. This year we plan to double their number. We are confident that now our processes and systems are well scalable, which means we are ready for future challenges.
Let's start with the early days. When I came to the company, it was quite obvious that we had huge problems with the way we work with the data:
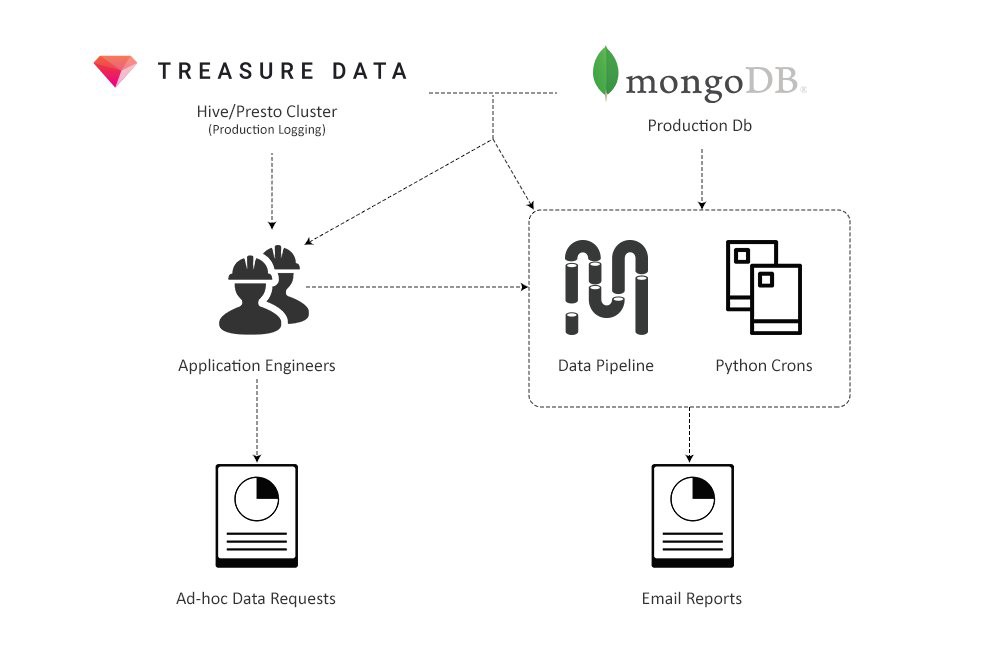
Initial data system
First, the creation of data queries was nightmarish, despite the fact that by that time our MongoDB clusters were one of the largest in the world (top 3). In order to ensure reliability, our infrastructure team has disabled aggregation requests in Mongo, that is, data aggregation should now be performed on the client side (in the Python script). Instead of simple SUM and GROUP BY SQL queries, we wrote code in a Python script, which in turn processed each of the millions of documents, storing the results in a dictionary that contains other dictionaries. Needless to say, such requests were hard to write, and they started forever.
The data pipeline situation was not much better. The system was too simple, and there were no key functions in it that would allow managing a huge number of ETL tasks, for example, there were problems with dependency management. The flow of failures and errors practically did not stop, and as a result, the whole working day had to be devoted to the fight against them.
Obviously, it was necessary to redo the infrastructure, move the pipeline data to a more scalable and reliable platform, and also build a separate data warehouse for analysts to speed up the creation of queries and reports.
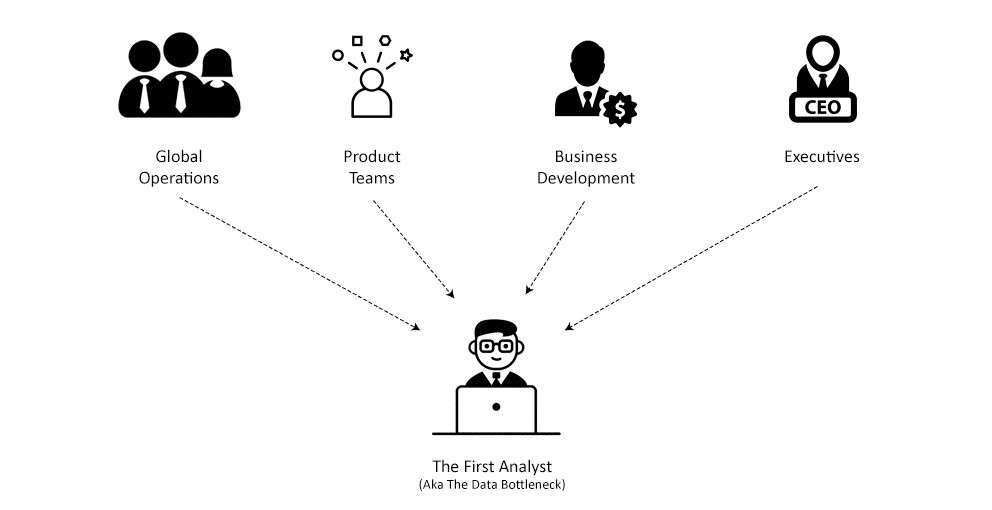
The fact that I was one of only two employees in a company with a focus on analytics made the task much more complicated. I was torn between supporting the current pipeline, creating a huge number of reports and data requests, and still needed to find time to restructure the infrastructure. Thus, I periodically switched from data engineering to analytical tasks and vice versa, that is, I dealt with two areas at the same time, each of which requires special skills and thinking style. Trying to be in time everywhere, I'm not sure that I did well with both.
Finally, we managed to hire our first, serious data analysts, and that saved us. We were lucky that they were technically savvy enough to write ad-hoc requests for MongoDB and work with our reports in Python. They were also experienced enough to deal with undocumented and new data sources. This means that they could take on some of the responsibilities that I was under.
Over the next year, we built infrastructure on Wish. While analysts were engaged in processing data requests from all over the company, I could concentrate on building a new system.
It is impossible to imagine that someone from our pair “I am a team of analysts” stretched out in the company for a long time, do not be different. Two problems we worked on: data extraction / building of reports and improvement of infrastructure were complex in their own way and required so different kinds of skills that each of us could not be good enough to do the work of the other.
The main thing that needs to be learned from this part is that when creating a team for working with data, you must have both a data engineer and an analyst (s). Without at least one analyst, the data engineer will drown in creating reports and extracting data, and without a data engineer, analysts, in turn, will fail with the number of queries from various complex data sources. As a result, both must be experienced and patient while waiting for a decent system to be built.
In the next two parts, I will talk in more detail about the challenges that analysts and engineers will meet, and how to handle them.
Being one of the first analysts on Wish meant taking on a huge amount of reports and data queries. Let's start with the reports.
Report generation is a system from Python scripts that generated HTML emails at regular intervals. There were thousands of them, and they covered various systems and functions within the company.
Ensuring that the scripts work, and the reports are sent on a schedule is a full-time job. It is hard to process data and take into account all possible errors: typos, missing or incomplete data, display problems - all this daily hindered the normal sending of reports. During the week there was simply not enough time to correct all the accumulated errors, so it was necessary to sort them by importance and correct only the most serious ones.
Of course, simply maintaining the system was not enough. The growth of the company has led to an increase in demand for new reports. In addition, we only hired a new operations director, which means that all of our customer service reports needed to be redone. We also launched new programs for sellers, such as Wish Express with 7-day delivery, and each of them required its own set of reports.
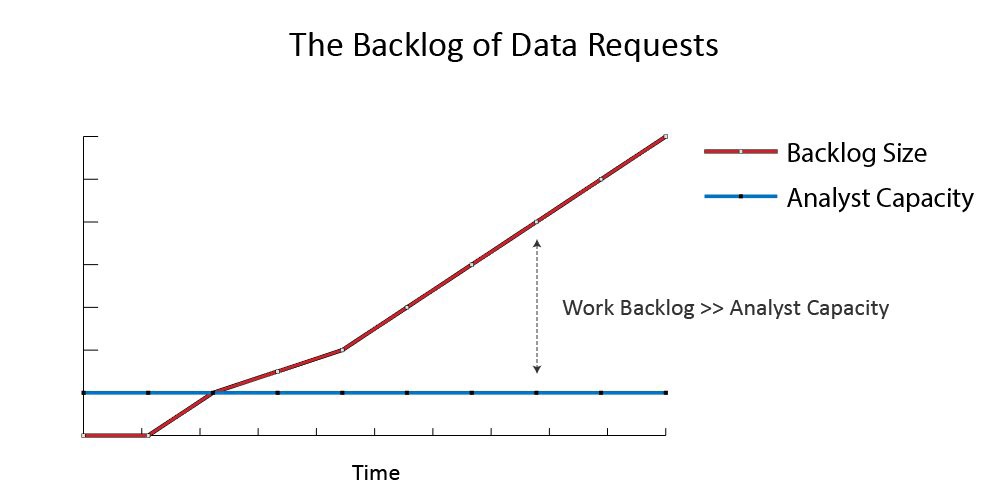
Also, in addition to reports, the analyst had to somehow cope with the incessant flow of data requests from the entire company. From experience, we knew that the rate of receipt of these requests is growing exponentially, so one of the main tasks was to prioritize the most important requests and screening unnecessary ones.
Sure, it was hard. The analyst has always been tempted to do something hastily in order to cope with the enormous amount of work, which led to errors and, consequently, a decrease in confidence in him.
Thus, to succeed in this role, two skills are needed:
Below we will discuss these two skills in detail: why they are so difficult in the early stages and how to overcome these difficulties.
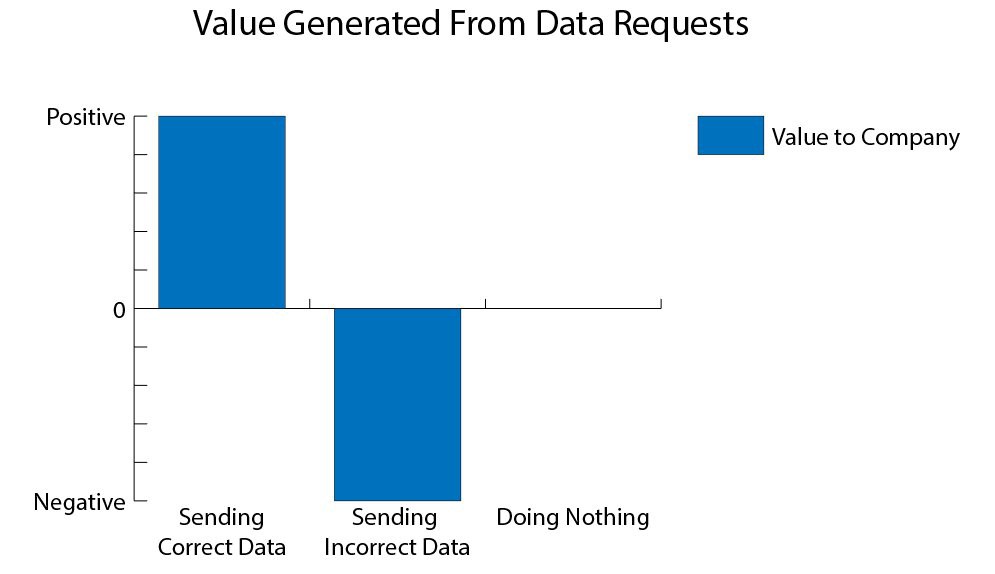
Send bad data <do nothing <send good data
Inexperienced analysts often try to create data queries without fully understanding how it works. For example, let's say that we received a request to receive the current share of the returned goods. The naive way is to find orders in the data model and see if they have a “Returned” field. Then, filtering all the data for a certain period of time by this criterion, we can calculate this share: # returns / # orders. Then we send this number.
After some time, the answer comes from the authorities: now it is necessary to find out how the share of returned goods for goods with and without delivery confirmation differs. Being the same naive analyst will use the same approach, find a separate data model for tracking orders and see that there is a “Confirmed delivery time” field that can be attached to orders from the first data model using the order id key.
Finally, we write the same query as before, but with the condition of presence / absence of delivery confirmation time, in order to get two metrics:
Then we send. It's pretty simple.
However, did you notice a mistake?
For Wish, cancellation of an order is also considered a return of the goods, and since cancellation means that the goods have not yet been delivered, such orders will always be in the second group - orders without confirmation of delivery. As a result, the second metric will be greatly overestimated, which can lead to incorrect management decisions.
This example is not invented, it really happened (fortunately, we quickly noticed an error). Now I know from experience that every time I walked the fast path and worked with queries without understanding the system itself, I ended up sending the wrong numbers.
To successfully avoid such traps, experience is needed. Always working with a new metric or data source with which the analyst is not familiar, he must spend additional time understanding the data and the system itself. And the first analysts in the company had to do this every time, since any new task meant working with unfamiliar data.
Experienced analysts understand where there is no need to hurry, even under conditions of tremendous pressure and urgency.
Workload of analysts in startups
Earlier in Wish, we were just a group of analysts and engineers who were supposed to support a business with a turnover of several million dollars a year. The point here is not even in the number of people, we could be 20, and we still could not cope with a huge amount of data. Therefore, we had to correctly prioritize, concentrate on the most important tasks and set aside everything else.
Of course, easier said than done. Why is one request more important than another? Are all the bugs fixed before sending the request? Which department needs help first? To answer these questions, each request is evaluated according to two criteria:
First, before starting work on a request, it is necessary to assess its impact, that is, to think about how this task will affect the company. For example, relevant questions: what areas of our business this task affects and what is the size of these areas? What is the possible benefit? What is the probability of successful completion of the task? Is this important in terms of company strategy?
Answering these questions, we compare the assessment of the importance of the task with the amount of work on its implementation. We approximately imagined how much this or that task takes: fixing a bug takes from half to a full day, a report from 2 days to a week, and an ad-hoc data request takes half a day.
Using this framework, we on Wish have prioritized incoming requests as follows:
Also, if the request has an impact on the business, but it requires more effort than necessary, then most often we cut some requirements from the task. So, if the metric is too hard to count, then we simply remove it from the query.
Thus, ranking the tasks in order of importance and focusing on tasks that require less effort to achieve greater results, we were able to achieve a lot in conditions of a critical lack of time.
Summing up this part: data requests are hard to process, and they arrive at an incredible speed. Even making everything perfect, sooner or later you will burn. No analyst can hold such a pace for long enough.
That is why it was necessary to take up data engineering. We needed a quality infrastructure.
The MVP (Minimum Viable Product) data infrastructure consists of:
The presence of all these elements will lead to a significant increase in efficiency. Creating a data source specifically for business analytics at Wish led to the fact that one request was 5-7 times less time to go. It also allowed us to reduce the technical skills requirements of new analysts, which greatly accelerated hiring. Now they could pump some skills later, if necessary.
Implementing all this is not just an engineering problem. So, we needed to convince shareholders of buying a ready-made BI platform, since the corporate culture of Wish is aimed at developing all that is needed on its own.
Below I will describe how we developed infrastructure step by step, and what lessons I learned from this.

As already mentioned, the existing Pipeline on Wish could not cope, so its restructuring was the primary task. As a base framework, we chose Luigi - ETL tool, which is better in several aspects:
As a result, in 2 months I transferred more than 200 ETL jobs from the old system to the new one along with several cron scripts.
Here is what I managed to take out for myself from this project:
Also, the main risk when refactoring code is that you can get even more new bugs. Transferring more than 200 job-s to the new platform, it was necessary to carefully check the system for the presence of bugs, otherwise everything would have collapsed.
Thus, the easiest way is to gradually make small changes that are automatically checked for bugs. Fundamental changes should be avoided until the project is fully ready. In our case, this means: skip / block pipelines, comparing the result of their work with the old system.
The new platform based on Luigi was quite primitive, but it worked and managed to cope with errors on its own, and this is exactly what we needed: a system that we can rely on, building the rest of the infrastructure.

Data storage is a database that allows you to write and run analytic queries more quickly.Usually it includes tables that are easier to understand. For example, one of the most commonly used tables in our repository is called merch_merchanttransaction . Each line in it contains all the necessary analytics information about the order. Instead of spending hours writing join-s in MongoDB, to retrieve the order + its id + information about the return of the goods, it was now possible to write queries to one table, which contains all the data about the order, spending a few minutes on it.
, , . -, . -, , , , .
3 . , - .
Redshift. Hive ( TreasureData ) , . TreasureData Redshift, , Redshift .
Python , HTML. :
, :
, BI-, .
. : CTO, BI-, , ( ) . , — , .
, , Looker. 2 . :
, , , , . , , , , - .
, Looker, Wish. , , , , , , .
, , data engineering- Wish!
Few people believed that you could build a big business by selling cheap goods. However, using the data, Wish was able to challenge these doubts. Data analytics has always been in our blood.
But when our business began to grow at a tremendous pace, we were not ready for this, we discovered many problems with analytics. Each team within the company began to need urgent support in working with data and lost a lot of things in its field of activity. At that time, our analytical capabilities were still in its infancy and could not satisfy the ever-increasing demand.
')
In this post, I will talk about the lessons we have learned during this time, and also sign for the right path for companies looking for ways to scale their analytical functions.
There were many problems, primarily with access to data. The only ones who could extract data and build reports were the engineers working on the product, and since the data infrastructure was completely raw, we could not hire analysts to help. As a result, the execution of data queries and report building could take weeks.
Over the next 2 years, we worked tirelessly to build analytics in the company. We have built a data pipeline from scratch that allows engineers, analysts and data scientists to perform ETL processes reliably and safely for their work. The data warehouse was collected in Redshift and BigQuery with core tables that support secondary tables used by analysts. We also deployed the BI Looker platform, which is now used as a company’s data source, which means more than 200 employees on three continents.
To date, more than 30 people at Wish are engaged in analytics. This year we plan to double their number. We are confident that now our processes and systems are well scalable, which means we are ready for future challenges.
Break the foundation and build a new one.
Let's start with the early days. When I came to the company, it was quite obvious that we had huge problems with the way we work with the data:
Initial data system
First, the creation of data queries was nightmarish, despite the fact that by that time our MongoDB clusters were one of the largest in the world (top 3). In order to ensure reliability, our infrastructure team has disabled aggregation requests in Mongo, that is, data aggregation should now be performed on the client side (in the Python script). Instead of simple SUM and GROUP BY SQL queries, we wrote code in a Python script, which in turn processed each of the millions of documents, storing the results in a dictionary that contains other dictionaries. Needless to say, such requests were hard to write, and they started forever.
The data pipeline situation was not much better. The system was too simple, and there were no key functions in it that would allow managing a huge number of ETL tasks, for example, there were problems with dependency management. The flow of failures and errors practically did not stop, and as a result, the whole working day had to be devoted to the fight against them.
Obviously, it was necessary to redo the infrastructure, move the pipeline data to a more scalable and reliable platform, and also build a separate data warehouse for analysts to speed up the creation of queries and reports.
The fact that I was one of only two employees in a company with a focus on analytics made the task much more complicated. I was torn between supporting the current pipeline, creating a huge number of reports and data requests, and still needed to find time to restructure the infrastructure. Thus, I periodically switched from data engineering to analytical tasks and vice versa, that is, I dealt with two areas at the same time, each of which requires special skills and thinking style. Trying to be in time everywhere, I'm not sure that I did well with both.
Finally, we managed to hire our first, serious data analysts, and that saved us. We were lucky that they were technically savvy enough to write ad-hoc requests for MongoDB and work with our reports in Python. They were also experienced enough to deal with undocumented and new data sources. This means that they could take on some of the responsibilities that I was under.
Over the next year, we built infrastructure on Wish. While analysts were engaged in processing data requests from all over the company, I could concentrate on building a new system.
It is impossible to imagine that someone from our pair “I am a team of analysts” stretched out in the company for a long time, do not be different. Two problems we worked on: data extraction / building of reports and improvement of infrastructure were complex in their own way and required so different kinds of skills that each of us could not be good enough to do the work of the other.
The main thing that needs to be learned from this part is that when creating a team for working with data, you must have both a data engineer and an analyst (s). Without at least one analyst, the data engineer will drown in creating reports and extracting data, and without a data engineer, analysts, in turn, will fail with the number of queries from various complex data sources. As a result, both must be experienced and patient while waiting for a decent system to be built.
In the next two parts, I will talk in more detail about the challenges that analysts and engineers will meet, and how to handle them.
What is it like: come to us as one of the first data scientist?
Being one of the first analysts on Wish meant taking on a huge amount of reports and data queries. Let's start with the reports.
Report generation is a system from Python scripts that generated HTML emails at regular intervals. There were thousands of them, and they covered various systems and functions within the company.
Ensuring that the scripts work, and the reports are sent on a schedule is a full-time job. It is hard to process data and take into account all possible errors: typos, missing or incomplete data, display problems - all this daily hindered the normal sending of reports. During the week there was simply not enough time to correct all the accumulated errors, so it was necessary to sort them by importance and correct only the most serious ones.
Of course, simply maintaining the system was not enough. The growth of the company has led to an increase in demand for new reports. In addition, we only hired a new operations director, which means that all of our customer service reports needed to be redone. We also launched new programs for sellers, such as Wish Express with 7-day delivery, and each of them required its own set of reports.
Also, in addition to reports, the analyst had to somehow cope with the incessant flow of data requests from the entire company. From experience, we knew that the rate of receipt of these requests is growing exponentially, so one of the main tasks was to prioritize the most important requests and screening unnecessary ones.
Sure, it was hard. The analyst has always been tempted to do something hastily in order to cope with the enormous amount of work, which led to errors and, consequently, a decrease in confidence in him.
Thus, to succeed in this role, two skills are needed:
- To be able to understand the system and make quality calculations.
- Deal with an incredible amount of data requests.
Below we will discuss these two skills in detail: why they are so difficult in the early stages and how to overcome these difficulties.
How not to send bad data
Send bad data <do nothing <send good data
Inexperienced analysts often try to create data queries without fully understanding how it works. For example, let's say that we received a request to receive the current share of the returned goods. The naive way is to find orders in the data model and see if they have a “Returned” field. Then, filtering all the data for a certain period of time by this criterion, we can calculate this share: # returns / # orders. Then we send this number.
After some time, the answer comes from the authorities: now it is necessary to find out how the share of returned goods for goods with and without delivery confirmation differs. Being the same naive analyst will use the same approach, find a separate data model for tracking orders and see that there is a “Confirmed delivery time” field that can be attached to orders from the first data model using the order id key.
Finally, we write the same query as before, but with the condition of presence / absence of delivery confirmation time, in order to get two metrics:
- The proportion of orders with delivery confirmation: X%.
- Percentage of orders without delivery confirmation: Y%.
Then we send. It's pretty simple.
However, did you notice a mistake?
For Wish, cancellation of an order is also considered a return of the goods, and since cancellation means that the goods have not yet been delivered, such orders will always be in the second group - orders without confirmation of delivery. As a result, the second metric will be greatly overestimated, which can lead to incorrect management decisions.
This example is not invented, it really happened (fortunately, we quickly noticed an error). Now I know from experience that every time I walked the fast path and worked with queries without understanding the system itself, I ended up sending the wrong numbers.
To successfully avoid such traps, experience is needed. Always working with a new metric or data source with which the analyst is not familiar, he must spend additional time understanding the data and the system itself. And the first analysts in the company had to do this every time, since any new task meant working with unfamiliar data.
Experienced analysts understand where there is no need to hurry, even under conditions of tremendous pressure and urgency.
How to cope with a huge number of requests
Workload of analysts in startups
Earlier in Wish, we were just a group of analysts and engineers who were supposed to support a business with a turnover of several million dollars a year. The point here is not even in the number of people, we could be 20, and we still could not cope with a huge amount of data. Therefore, we had to correctly prioritize, concentrate on the most important tasks and set aside everything else.
Of course, easier said than done. Why is one request more important than another? Are all the bugs fixed before sending the request? Which department needs help first? To answer these questions, each request is evaluated according to two criteria:
- The degree of influence of the request on the company.
- The amount of work needed to complete it.
First, before starting work on a request, it is necessary to assess its impact, that is, to think about how this task will affect the company. For example, relevant questions: what areas of our business this task affects and what is the size of these areas? What is the possible benefit? What is the probability of successful completion of the task? Is this important in terms of company strategy?
Answering these questions, we compare the assessment of the importance of the task with the amount of work on its implementation. We approximately imagined how much this or that task takes: fixing a bug takes from half to a full day, a report from 2 days to a week, and an ad-hoc data request takes half a day.
Using this framework, we on Wish have prioritized incoming requests as follows:
- Most often, fixing bugs is most important. If someone asks to fix something, then most likely this is some useful feature. Fixing a bug, we will improve the work of the company. Moreover, this is quite fast, so this task has a very large ratio of importance to the volume of work.
- To work with reports need to be approached more carefully. Adding a new metric to a report or creating a new one really helps shareholders make better decisions?
- Then there are system improvements , such as consolidating reports or allocating frequent settlements to a separate pipeline, as they have a good effect on business in the medium term, but have little effect in the short term. Therefore, these tasks should be postponed until it threatens the functioning of the entire system.
- Finally, tasks with no clear goal have the lowest priority. For example, when shareholders are not sure which problem needs to be solved, and just want to get data for analysis. Such tasks need to be addressed last, since they rarely affect the operation of a business and most often require you to return to them several times.
Also, if the request has an impact on the business, but it requires more effort than necessary, then most often we cut some requirements from the task. So, if the metric is too hard to count, then we simply remove it from the query.
Thus, ranking the tasks in order of importance and focusing on tasks that require less effort to achieve greater results, we were able to achieve a lot in conditions of a critical lack of time.
Summing up this part: data requests are hard to process, and they arrive at an incredible speed. Even making everything perfect, sooner or later you will burn. No analyst can hold such a pace for long enough.
That is why it was necessary to take up data engineering. We needed a quality infrastructure.
What is it like: come to us as one of the first data engineers?
The MVP (Minimum Viable Product) data infrastructure consists of:
- Data Pipeline to transfer data.
- Data warehouses, which is tailored to the needs of analysts.
- BI platform, with which analysts can quickly visualize data.
The presence of all these elements will lead to a significant increase in efficiency. Creating a data source specifically for business analytics at Wish led to the fact that one request was 5-7 times less time to go. It also allowed us to reduce the technical skills requirements of new analysts, which greatly accelerated hiring. Now they could pump some skills later, if necessary.
Implementing all this is not just an engineering problem. So, we needed to convince shareholders of buying a ready-made BI platform, since the corporate culture of Wish is aimed at developing all that is needed on its own.
Below I will describe how we developed infrastructure step by step, and what lessons I learned from this.
How we rebuilt the pipeline data
As already mentioned, the existing Pipeline on Wish could not cope, so its restructuring was the primary task. As a base framework, we chose Luigi - ETL tool, which is better in several aspects:
- The current pipeline used cron-s to determine dependencies. This method does not shine with elegance and causes many problems. Luigi has built-in dependency management.
- Also, the problem with the old pipeline is that its errors lead to a waste of time due to manual restarts. In turn, Luigi is idempotent, that is, remembers which tasks were successfully completed and restarts only the failed ones.
- Finally, in order to do all the work for the day, the pipeline took more than 24 hours, while Luigi has a scheduler that does not allow one ETL request to be run twice at the same time. Consequently, we can distribute this request across several machines and halve the time of the program.
As a result, in 2 months I transferred more than 200 ETL jobs from the old system to the new one along with several cron scripts.
Here is what I managed to take out for myself from this project:
- Do not try to change a bunch of things at the same time.
- Changing the infrastructure, do not try to change the logic of the business.
- Automate code testing with validation scripts.
Also, the main risk when refactoring code is that you can get even more new bugs. Transferring more than 200 job-s to the new platform, it was necessary to carefully check the system for the presence of bugs, otherwise everything would have collapsed.
Thus, the easiest way is to gradually make small changes that are automatically checked for bugs. Fundamental changes should be avoided until the project is fully ready. In our case, this means: skip / block pipelines, comparing the result of their work with the old system.
The new platform based on Luigi was quite primitive, but it worked and managed to cope with errors on its own, and this is exactly what we needed: a system that we can rely on, building the rest of the infrastructure.
Creating a data warehouse
Data storage is a database that allows you to write and run analytic queries more quickly.Usually it includes tables that are easier to understand. For example, one of the most commonly used tables in our repository is called merch_merchanttransaction . Each line in it contains all the necessary analytics information about the order. Instead of spending hours writing join-s in MongoDB, to retrieve the order + its id + information about the return of the goods, it was now possible to write queries to one table, which contains all the data about the order, spending a few minutes on it.
, , . -, . -, , , , .
3 . , - .
Redshift. Hive ( TreasureData ) , . TreasureData Redshift, , Redshift .
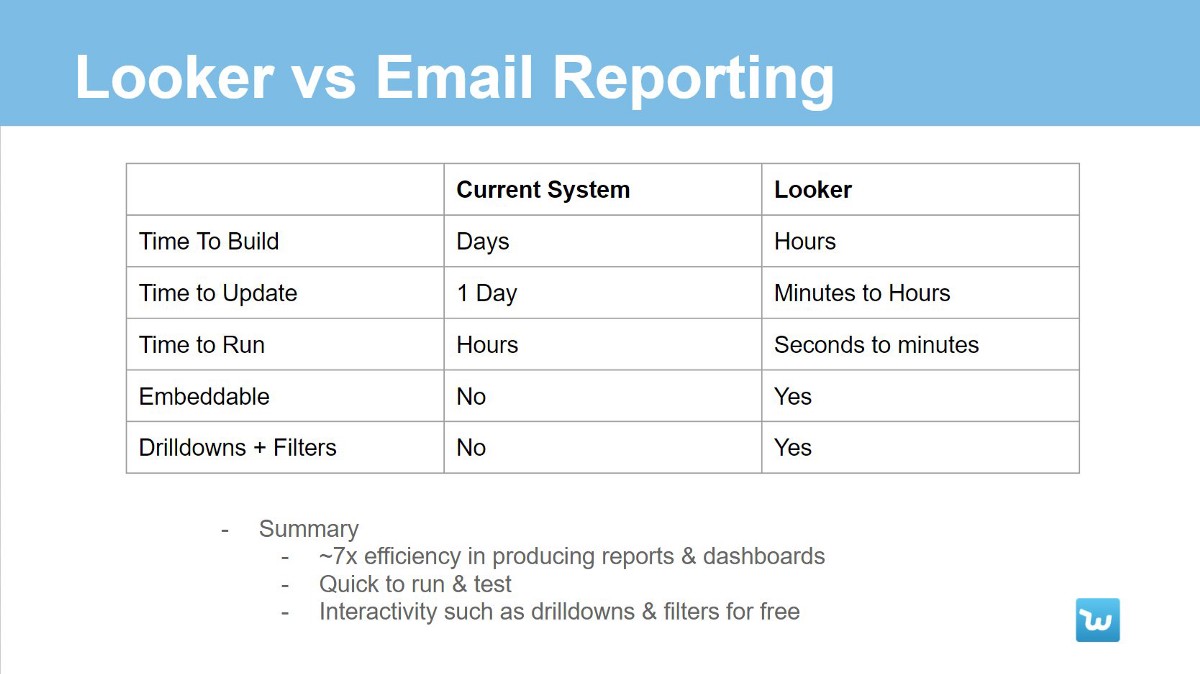
BI
Python , HTML. :
- Python , .
- , , BI . .
, :
- — , .
- , , , , .
- - . - , .
, BI-, .
. : CTO, BI-, , ( ) . , — , .
, , Looker. 2 . :
- ( ) , Looker, .
- -.
- — , .
- Looker , (4 ).
- 4 , (20 ).
- CTO , ROI , Looker.
, , , , . , , , , - .
, Looker, Wish. , , , , , , .
, , data engineering- Wish!
Source: https://habr.com/ru/post/347360/
All Articles