[DotNetBook] Stack stream. Its editing and stream cloning
 With this article, I continue to publish a series of articles, the result of which will be a book on the work of the .NET CLR, and .NET as a whole. The whole book will be available on GitHub (link at the end of the article). So Issues and Pull Requests are always welcome :)
There is a memory area about which conversation rarely comes. However, this area is probably the core of the application. Most often used, quite limited with instant allocation and release of memory. This area is called the "thread stack." Moreover, since the pointer to it is inherently encoded by the processor registers that are included in the context of the thread, then within the execution of any thread, the thread's stack is different. Why is it necessary? Let's get into the world of low-level structures, on the basis of which everything works: from DOS programs to the .NET Framework installed on top of Windows 10.
So, let's analyze an elementary code example:
')
void Method1() { Method2(123); } void Method2(int arg) { // ... } Nothing remarkable happens in this code, but we will not skip it, but vice versa: we will look at it as closely as possible.
Note
The chapter published on Habré is not updated and it is possible that it is already somewhat outdated. So, please ask for a more recent text to the original:
CLR Book: GitHub, table of contents
Release 0.5.2 of the book, PDF: GitHub Release
When any `Method1` calls any` Method2`, absolutely any such call (and not only in .NET, but also in other platforms) performs the following operations:
- The first thing that the code compiled by JIT does is: it saves the method parameters to the stack (starting with the third one). In this case, the first two are transmitted through registers. Here it is important to remember that the first parameter of the instance methods is a pointer to the object with which the method works. Those. pointer `this`. So in these (almost all) cases for registers there is only one parameter. And for everyone else, the stack;
- Next, the compiler puts the call instruction of the `call` method, which pushes the return address from the method onto the stack: the address following the instruction` call`. Thus, any method knows where it needs to go back so that the calling code can continue;
- After all the parameters are passed, and the method is called, we need to somehow understand how to restore the stack if we exit the method if we don’t want to take care of counting the bytes in the stack. To do this, we store the value of the EBP register, which always stores a pointer to the beginning of the current stack frame (that is, the section where information is stored for the particular method called). By saving the value of this register with each call, we thereby actually create a simply linked list of stack frames. But please note that in fact they are clearly following each other, without any spaces. However, to simplify the release of memory from under the frame and to be able to debug applications (the debugger uses these pointers to display Stack Trace), a simply linked list is built;
- The last thing to do when calling a method is to allocate a section of memory for local variables. Since the compiler knows in advance how much it will need, he does it right away by moving the pointer to the top of the stack (SP / ESP / RSP) by the required number of bytes;
- And finally, at the fifth stage, the method code, useful operations are executed;
- When the exit from the method occurs, the top of the stack is restored from EBP - the place where the beginning of the current stack frame is stored;
- Further, the last stage is the exit from the method via the `ret` instruction. It takes the return address from the stack, carefully left before the `call` instruction, and makes the transition to that address.
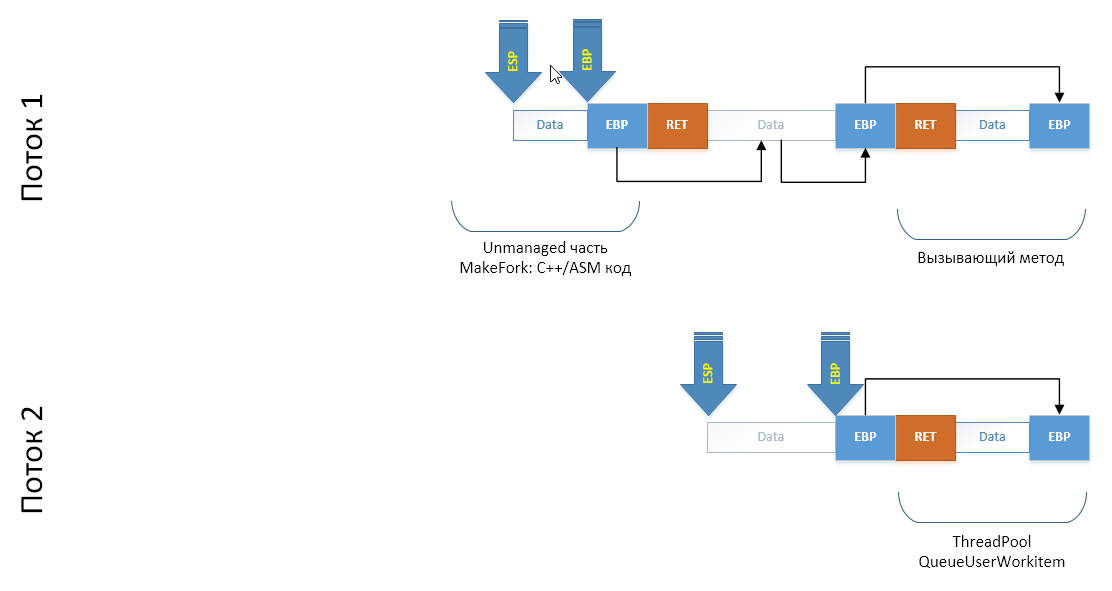
The same processes can be viewed in the image:
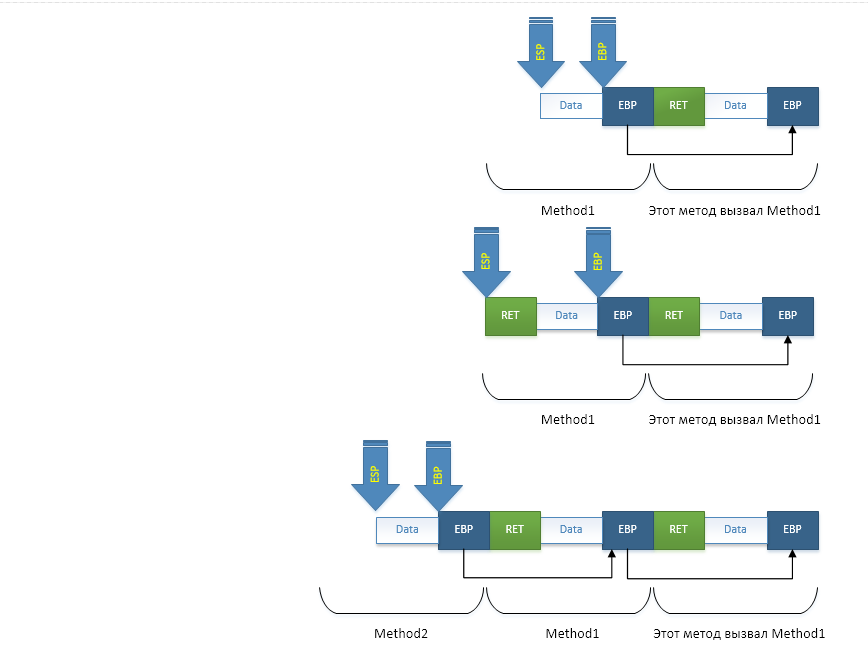
Also note that the stack "grows" from the elder addresses to the younger ones, i.e. reversed.
Looking at all this, one involuntarily comes to the conclusion that if not the majority, then at least half of all operations that the processor is involved in - it is the maintenance of the program structure, and not its payload. Those. serving method calls, checking types for the ability to bring one to another, compiling Generic variations, searching for methods in interface tables ... Especially if we remember that most modern code is written with an approach to work through interfaces, breaking down into many small but each performing its own methods ... And the work at the same time often goes with basic types and type conversion to the interface, then to the successor. With all such incoming conditions, the conclusion about the wastefulness of the infrastructure code may well mature. The only thing I can say to all of you is this: compilers, including JIT, have many techniques that allow them to make more productive code. Where possible - instead of calling a method, its body is inserted entirely, and where possible, instead of searching for a method in the VSD interface, it is directly called. What is the saddest thing is that the infrastructure load is very difficult to measure: it is necessary that JITter or any compiler insert some metrics before and after the infrastructure code places. Those. before calling the method, and inside the method - after initializing the stack frame. Before exiting the method, after exiting the method. Before compilation, after compilation. And so on. However, let's not talk about sad things, but rather talk about what we can do with the information we receive.
About exceptions
If we look inside the code of the methods, we will notice another structure that works with the thread stack. Judge for yourself:
void Method1() { try { Method2(123); } catch { // ... } } void Method2(int arg) { Method3(); } void Method3() { try { //... } catch { //... } } If an exception occurs in any of the methods called from `Method3`, then control will be returned to the` catch` block of the `Method3` method. Moreover, if the exception is not processed, then its processing will begin in the `Method1` method. However, if nothing happens, `Method3` finishes its work, control passes to the method` Method2`, where an exception may also occur. However, for natural reasons, it will be processed not in `Method3`, but in` Method1`. The question of such convenient automatism is that the data structures that form chains of exception handlers are also located in the stack frame of the method where they are declared. We'll talk about the exceptions themselves separately, but here I’ll just say that the exception model in the .NET Framework CLR and in the Core CLR is different. CoreCLR is forced to be different on different platforms, and therefore the exception model is different there and is presented depending on the platform through the PAL (Platform Adaption Layer) layer by different implementations. The large .NET Framework CLR does not need this: it lives in the ecosystem of the Windows platform, in which there is for many years the well-known exception-handling mechanism called SEH (Structured Exception Handling). This mechanism is used by almost all programming languages (at the final compilation) because it provides end-to-end exception handling between modules written in various programming languages. It works like this:
- When a try block is entered, a structure is put on the stack that points to the previous exception-handling block (for example, the calling method that also has a try-catch), the block type, the exception code, and the address of the handler;
- In the thread's TEB (Thread Environment Block, in essence, the context of the thread), the address of the current top of the exception handler chain is changed to the one we created. So we added our block to the chain.
- When try is over, the inverse operation is performed: the old vertex is written to the TEB, thus removing our handler from the chain;
- If an exception occurs, then a vertex is taken from the TEB and handlers are called up in turn along the chain, which check if the exception is appropriate for them. If yes, a processing block is executed (for example, catch).
- The TEB recovers the address of the SEH structure that is on the stack BEFORE the method that handled the exception.
As you can see, it is not difficult at all. However, all of this information is also on the stack.
Just a little about the imperfections of the thread stack
Let's think a bit about the issue of security and possible problems that can theoretically arise. To do this, let's look once again at the structure of the flow stack, which in its essence is a regular array. The range of memory in which frames are built is organized so that it grows from end to beginning. Those. later frames are located at earlier addresses. Also, as already mentioned, the frames are linked by a single linked list. This is done because the frame size is not fixed and must be “read” by any debugger. At the same time, the processor does not delimit the frames between them: any method can consider the entire memory area as it wishes. And if we take into account that we are in virtual memory, which is divided into sections, which are actually allocated memory, then using the special WinAPI function at any address from the stack, we can get the range of allocated memory in which this``csharp address is located. Well, sorting a simply linked list is a matter of technique:
// int x; // , MEMORY_BASIC_INFORMATION *stackData = new MEMORY_BASIC_INFORMATION(); VirtualQuery((void *)&x, stackData, sizeof(MEMORY_BASIC_INFORMATION)); This gives us the opportunity to obtain and modify all the data that are in the quality of local variables of the methods that called us. If the application does not set up a sandbox in any way, within which third-party libraries are called that extend the functionality of the application, then the third-party library will be able to drag off the data even if the API that you give it does not imply. This technique may seem far-fetched to you, however, in the world of C / C ++, where there is no such beautiful thing as an AppDomain with configured permissions on the stack, this is the most typical that can be found from hacking applications. Moreover, it is possible through reflection to look at the type that we need, to repeat its structure at home, and following the link from the stack to the object, replace the VMT address with ours, thus redirecting all the work with a specific instance to us. SEH, by the way, is also used to crack applications. Through it, you can also change the address of the exception handler to force the OS to execute malicious code. But the conclusion from all this is very simple: always customize the sandbox when you want to work with libraries that extend the functionality of your application. Of course, I mean all sorts of plugins, add-ons and other extensions.
Big example: stream cloning
To memorize everything that we have read to the smallest details, we must go to the question of covering a topic from several sides. It would seem, what example can be built for the stack flow? Call a method from another? Magic ... Of course not: we do this every day many times. Instead, we incline the flow of execution. Those. let's make it so that after calling a certain method, instead of one thread, we would have two: ours and the new one, but continuing to execute the code from the point of the call of the cloning method as if he himself got there. And it will look like this:
void MakeFork() { // : // var sameLocalVariable = 123; var sync = new object(); // var stopwatch = Stopwatch.StartNew(); // var forked = Fork.CloneThread(); // . // forked = true , false lock(sync) { Console.WriteLine("in {0} thread: {1}, local value: {2}, time to enter = {3} ms", forked ? "forked" : "parent", Thread.CurrentThread.ManagedThreadId, sameLocalVariable, stopwatch.ElapsedMilliseconds); } // , // MakeFork(), .. , // . } // : // in forked thread: 2, local value: 123, time to enter = 73 ms // in parent thread: 1, local value: 123, time to enter = 77 ms Agree concept interesting. Of course, one can argue a lot about the expediency of such actions, but the task of this example is to put a bold end in understanding the work of this data structure. How to make cloning? To answer this question, another question must be answered: what does the flow determine in general? And the flow is determined by the following structures and data areas:
- A set of processor registers. All registers determine the state of the flow of execution of instructions: from the address of the current execution instruction to the addresses of the flow stack and the data with which it operates;
- [Thread Environment Block] (https://en.wikipedia.org/wiki/Win32_Thread_Information_Block) or TIB / TEB, which stores system information on the stream including the addresses of exception handlers;
- The stack of the stream whose address is determined by the registers SS: ESP;
- Platform context of a stream that contains data local to the stream (link comes from TIB)
Well, surely something else that we may not know. And there is no need for us to know everything for an example: this code will not go into industrial use, but rather it will serve as an excellent example that will help us understand the topic. Therefore, he will not take into account everything, but only the most basic. And in order for it to work in the base view, we need to copy the set of registers to the new stream (correcting SS: ESP, since the stack will be new) and also edit the stack itself to contain exactly what we need.
So. If the flow stack determines in essence which methods were called and what data they operate on, then it turns out that by changing these structures, you can change them as local variables of the methods, so cut the call of a method from the stack, change the method to another one or add any place is your chain. Well, this is determined. Now let's look at some pseudocode:
void RootMethod() { MakeFork(); } When MakeFork () is called, what do we expect from the stack point of view? That everything remains unchanged in the parent thread, and the child thread will be taken from the thread pool (for speed), it will simulate a call to the
MakeFork method along with its local variables, and the code will continue execution not from the beginning of the method, but from the point following the call CloneThread . Those. The stack of traces in our fantasies will look something like this: // Parent Thread RootMethod -> MakeFork // Child Thread ThreadPool -> MakeFork What do we have initially? There is our stream. It is also possible to create a new thread or schedule a task in the thread pool by executing your code there. We also understand that information on nested calls is stored in the call stack and that, if desired, we can manipulate it (for example, using C ++ / CLI). Moreover, if you follow the agreements and enter the return address for the ret instruction in the top of the stack, the value of the EBP register and allocate space for the local ones (if necessary), you can simulate the method call. It is possible to make a manual entry into the thread stack from C #, however, we will need registers to use them very carefully, and therefore we cannot do without leaving C ++. This is where CLI / C ++ comes to help us for the first time in my life (personally), which allows you to write mixed code: part of the instructions is in .NET, part is in C ++, and sometimes even go to the assembler level. Exactly what we need.
So, what will the thread stack look like when our code calls MakeFork, which calls CloneThread, which goes into the unmanaged world of CLI / C ++ and calls the cloning method (the implementation itself) - there? Let's look at the scheme (once again I remind you that the stack grows from older addresses to younger ones. From right to left):
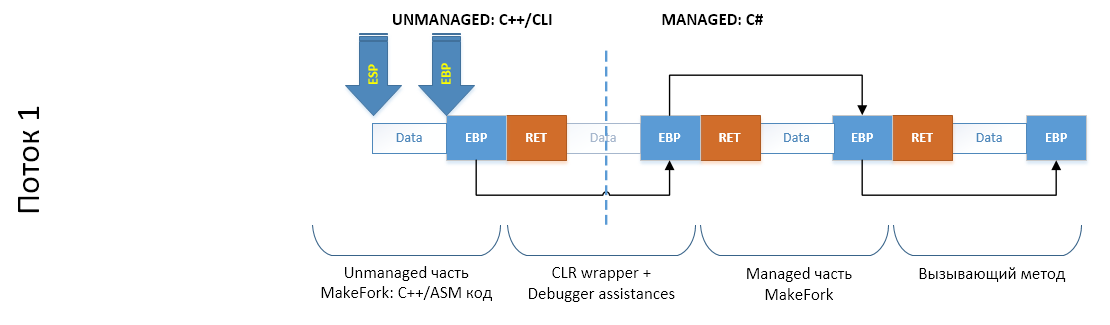
Well, in order not to drag the entire sheet from the scheme to the scheme, simplify, discarding what we do not need:
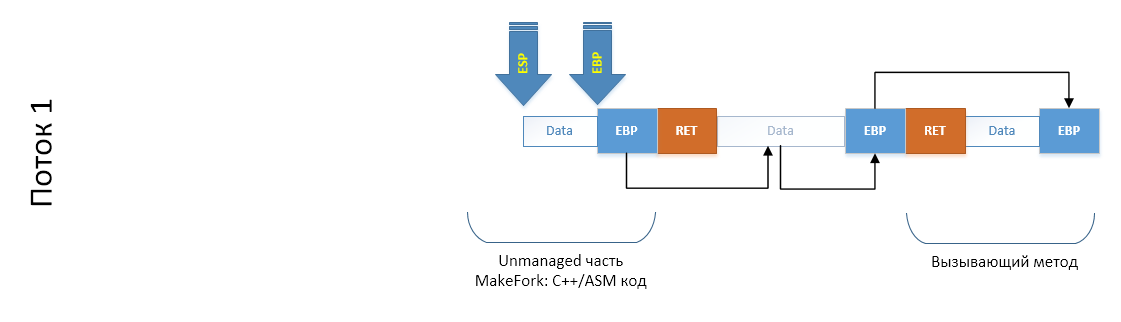
When we create a thread or take a ready one from the thread pool, another stack appears in our scheme, which has not yet been initialized:
Now our task is to simulate the launch of the
Fork.CloneThread() method in a new thread. To do this, we have to add a series of frames to the end of its thread stack: as if from the delegate passed to ThreadPool, Fork.CloneThread() was called, from which the CLI / C ++ method was called through a wrapper C ++ code wrapper. To do this, we simply copy the required section of the stack into the array (I note that copies of the EBP registers are provided from the sloped section to the old one, which ensures the construction of a chain of frames):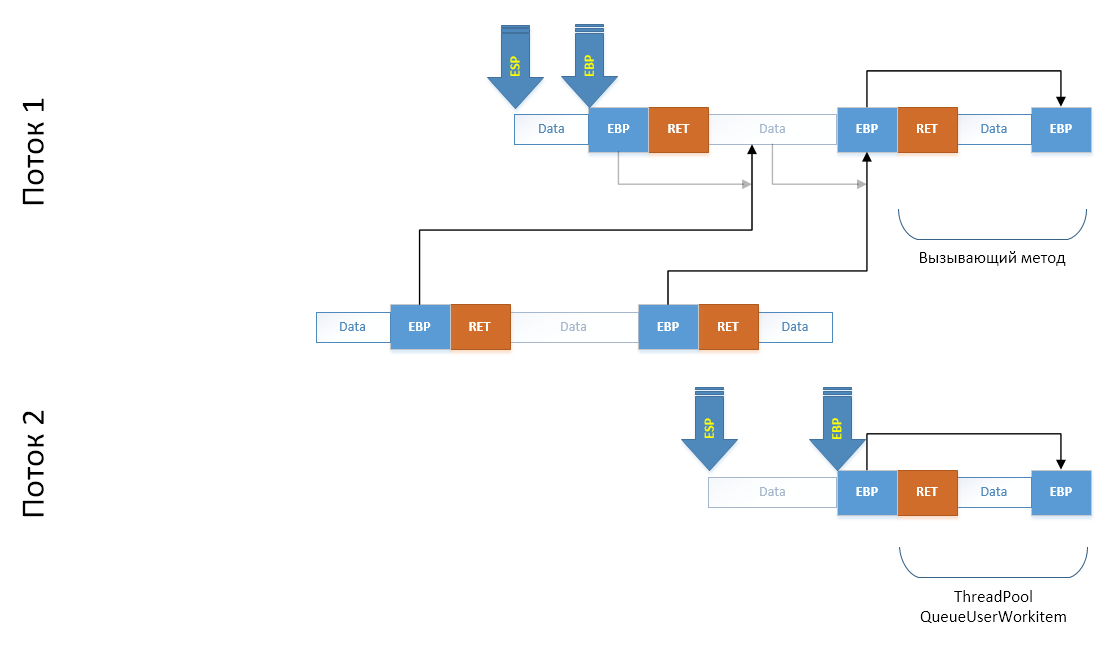
Further, in order to ensure the integrity of the stack after the copying operation of a site that has been clouded on the previous block, we expect in advance what addresses the EBP fields will be in at the new location and immediately correct them directly on the copy:
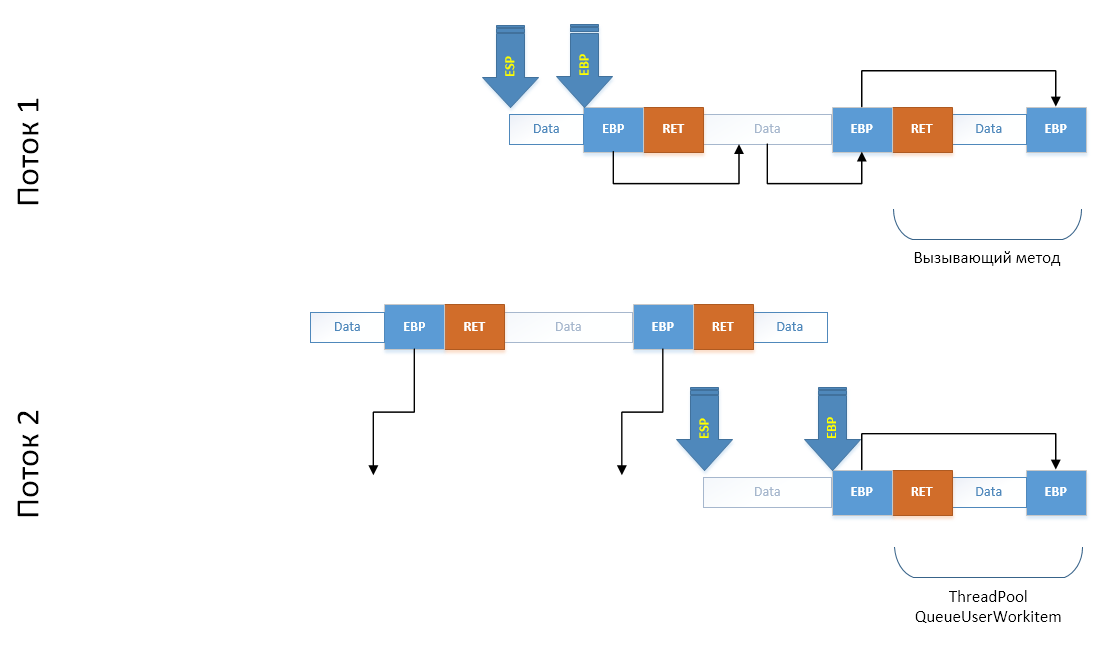
The last step, very carefully, using the minimum number of registers, copy our array to the end of the stack of the child thread, after which we shift the ESP and EBP registers to new locations. In terms of the stack, we simulated a call to all these methods:
But not yet in terms of code. In terms of code, we need to get into the methods that we just created. The simplest thing is to simply simulate the exit from the method: restore
ESP to EBP , put what it points to in EBP and call the ret instruction, initiating the exit from the flow cloning method allegedly called by C ++, which will return to the real CLI / C ++ wrapper call, which returns control to MakeFork() , but in a child thread. Technique worked.Now let's take a look at the code. The first thing we do is the ability for CLI / C ++ code to create a .NET stream. To do this, we need to create it in .NET:
extern "C" __declspec(dllexport) void __stdcall MakeManagedThread(AdvancedThreading_Unmanaged *helper, StackInfo *stackCopy) { AdvancedThreading::Fork::MakeThread(helper, stackCopy); } Do not pay attention to the types of parameters. They are needed to transfer information about which part of the stack should be drawn from the parent stream to the child one. The thread creation method wraps in a delegates the call to the unmanaged method, passes the data, and puts the delegate in a queue for processing by the thread pool.
[MethodImpl(MethodImplOptions::NoInlining | MethodImplOptions::NoOptimization | MethodImplOptions::PreserveSig)] static void MakeThread(AdvancedThreading_Unmanaged *helper, StackInfo *stackCopy) { ForkData^ data = gcnew ForkData(); data->helper = helper; data->info = stackCopy; ThreadPool::QueueUserWorkItem(gcnew WaitCallback(&InForkedThread), data); } [MethodImpl(MethodImplOptions::NoInlining | MethodImplOptions::NoOptimization | MethodImplOptions::PreserveSig)] static void InForkedThread(Object^ state) { ForkData^ data = (ForkData^)state; data->helper->InForkedThread(data->info); } And finally, the cloning method itself (or rather, its .NET part):
[MethodImpl(MethodImplOptions::NoInlining | MethodImplOptions::NoOptimization | MethodImplOptions::PreserveSig)] static bool CloneThread() { ManualResetEvent^ resetEvent = gcnew ManualResetEvent(false); AdvancedThreading_Unmanaged *helper = new AdvancedThreading_Unmanaged(); int somevalue; // * helper->stacktop = (int)(int *)&somevalue; int forked = helper->ForkImpl(); if (!forked) { resetEvent->WaitOne(); } else { resetEvent->Set(); } return forked; } To understand where this method is in the chain of stack frames, we keep the address of the stack variable (*). We will use this address in the cloning method, which will be discussed below. Also, so that you understand what is being said, I will give the code of the structure necessary for storing information about the stack copy:
public class StackInfo { public: // int EAX, EBX, ECX, EDX; int EDI, ESI; int ESP; int EBP; int EIP; short CS; // void *frame; // int size; // , // int origStackStart, origStackSize; }; The work of the algorithm itself is divided into two parts: in the parent thread, we prepare the data in order to draw the necessary stack frames in the child thread. The second stage - in the child thread - the data is restored, superimposed on its own stack of the execution flow, thus simulating the calls of methods that were not actually called.
Copy Preparation Method
Description of the code I will do in blocks. Those. a single code will be divided into parts and each of the parts will be commented separately. So let's get started.When the external code calls
Fork.CloneThread(), then through the internal wrapper over the unmanaged code and through a number of additional methods if the code works under debugging (the so-called debugger assistants). That is why we in the .NET part remembered the address of a variable in the stack: for the C ++ method, this address is a kind of label: now we know exactly which section of the stack we can safely copy. int AdvancedThreading_Unmanaged::ForkImpl() { StackInfo copy; StackInfo* info; First of all, before at least some operation happens, in order not to get corrupted registers, we copy them locally. It is also additionally necessary to save the address of the code where the `goto` will be placed when the stack is simulated in the child thread and it will be necessary to perform an exit procedure from` the CloneThread` from the child thread. As the "exit point" we choose `JmpPointOnMethodsChainCallEmulation` and not just like that: after the operation of saving this address" for the future "we additionally put the number 0 on the stack.
// Save ALL registers _asm { mov copy.EAX, EAX mov copy.EBX, EBX mov copy.ECX, ECX mov copy.EDX, EBX mov copy.EDI, EDI mov copy.ESI, ESI mov copy.EBP, EBP mov copy.ESP, ESP // Save CS:EIP for far jmp mov copy.CS, CS mov copy.EIP, offset JmpPointOnMethodsChainCallEmulation // Save mark for this method, from what place it was called push 0 } After that, after `JmpPointOnMethodsChainCallEmulation` we get this number from the stack and check: does` 0` lie there? If so, we are in the same thread: which means we still have a lot to do and we are switching to `NonClonned`. If there is not `0`, but in fact` 1`, it means that the child thread has finished “drawing” the stack of the thread to the required state, put the number `1` on the stack and made goto at this point (I note that he does goto another method). This means that it is time to exit the `CloneThread` in the child thread whose call has been simulated.
JmpPointOnMethodsChainCallEmulation: _asm { pop EAX cmp EAX, 0 je NonClonned pop EBP mov EAX, 1 ret } NonClonned: Well, we are convinced that we are still we, which means we need to prepare data for the child stream. In order not to descend to the assembler level anymore, we will work with the structure of previously saved registers. We will get the value of the EBP register from it: it is essentially the “Next” field in the simply linked list of stack frames. Going to the address that is contained there, we will find ourselves in the frame of the method that called us. If we take the first field there and move to that address, we will find ourselves in an even earlier frame. So we can get to the managed part
CloneThread: after all, we saved the address of the variable in its stack frame, which means we know very well where to stop. This is the task of the cycle below. int *curptr = (int *)copy.EBP; int frames = 0; // // Calculate frames count between current call and Fork.CloneTherad() call // while ((int)curptr < stacktop) { curptr = (int*)*curptr; frames++; } Having received the address of the beginning of the frame of the managed method
CloneThread, we now know how much to copy to simulate the call CloneThreadfrom MakeFork. However, because we MakeForkalso need (our goal is to go into it), we make an additional one transition on a linked list: *(int *)curptr. Then we create an array for creating the stack and save it by simple copying. // // We need to copy stack part from our method to user code method including its locals in stack // int localsStart = copy.EBP; // our EBP points to EBP value for parent method + saved ESI, EDI int localsEnd = *(int *)curptr; // points to end of user's method's locals (additional leave) byte *arr = new byte[localsEnd - localsStart]; memcpy(arr, (void*)localsStart, localsEnd - localsStart); Another task that needs to be addressed is the correction of the addresses of variables that hit the stack and at the same time point to the stack. To solve this problem, we get the range of addresses that the operating system has allocated for us under the thread stack. We save the received information. I start the second part of the cloning process by scheduling a delegate to the thread pool:
// Get information about stack pages MEMORY_BASIC_INFORMATION *stackData = new MEMORY_BASIC_INFORMATION(); VirtualQuery((void *)copy.EBP, stackData, sizeof(MEMORY_BASIC_INFORMATION)); // fill StackInfo structure info = new StackInfo(copy); info->origStackStart = (int)stackData->BaseAddress; info->origStackSize = (int)stackData->RegionSize; info->frame = arr; info->size = (localsEnd - localsStart); // call managed ThreadPool.QueueUserWorkitem to make fork MakeManagedThread(this, info); return 0; } Copy recovery method
This method is called as the result of the previous work: we have been given a copy of the stack portion of the parent thread as well as the full set of its registers. Our task in our thread, taken from the thread pool, is to draw all the calls copied from the parent thread in such a way as if we ourselves had performed them. After completing the work, the MakeFork of the child thread will fall back into this method, which, after completing the work, will release the stream and return it to the thread pool.
void AdvancedThreading_Unmanaged::InForkedThread(StackInfo * stackCopy) { StackInfo copy; First of all, we save the values of the working registers so that when
MakeForkwe have completed our care, we can restore them without any serious consequences. In order to further minimally influence the registers, we unload the parameters passed to us onto our stack. Access to it will only go through SS:ESPwhat will be predictable for us. short CS_EIP[3]; // Save original registers to restore __asm pushad // safe copy w-out changing registers for(int i = 0; i < sizeof(StackInfo); i++) ((byte *)©)[i] = ((byte *)stackCopy)[i]; // Setup FWORD for far jmp *(int*)CS_EIP = copy.EIP; CS_EIP[2] = copy.CS; Our next task is to fix the values in the copy of the stack
EBP, which form a simply linked list of frames for their future new positions. To do this, we calculate the delta between the address of our thread stack and the parent thread stack, the delta between the copy of the stack range of the parent thread and the parent thread itself. // calculate ranges int beg = (int)copy.frame; int size = copy.size; int baseFrom = (int) copy.origStackStart; int baseTo = baseFrom + (int)copy.origStackSize; int ESPr; __asm mov ESPr, ESP // target = EBP[ - locals - EBP - ret - whole stack frames copy] int targetToCopy = ESPr - 8 - size; // offset between parent stack and current stack; int delta_to_target = (int)targetToCopy - (int)copy.EBP; // offset between parent stack start and its copy; int delta_to_copy = (int)copy.frame - (int)copy.EBP; Using this data, we cycle through a copy of the stack and fix the addresses for their future new positions.
// In stack copy we have many saved EPBs, which where actually one-way linked list. // we need to fix copy to make these pointers correct for our thread's stack. int ebp_cur = beg; while(true) { int val = *(int*)ebp_cur; if(baseFrom <= val && val < baseTo) { int localOffset = val + delta_to_copy; *(int *)ebp_cur += delta_to_target; ebp_cur = localOffset; } else break; } When editing a single-linked list is complete, we need to correct the values of the registers in their copy so that if there are references to the stack there, they would be corrected. Here, in fact, the algorithm is not at all accurate. After all, if by some chance there is not a good number from the range of stack addresses, then it will be corrected by mistake. But our task is not to write a concept product, but simply to understand the workings of the thread stack. Therefore, for these purposes, this technique will suit us.
CHECKREF(EAX); CHECKREF(EBX); CHECKREF(ECX); CHECKREF(EDX); CHECKREF(ESI); CHECKREF(EDI); Now, the main and most important part. When we copy to the end of our stack a copy of the parent range, everything will be fine until the moment when
MakeForkthe child wants to exit (make return). We need to tell him where he should go. To do this, we also imitate the call itself MakeForkfrom this method. We put the label address on the stack RestorePointAfterClonnedExited, as if the processor instruction callput the return address on the stack, and also put the current one EBP, simulating the construction of a simply connected list of chains of method frames. After that, we put a copy of the parent stack onto the stack using the usual `push` operation, thereby drawing all the methods that were called on the parent stack from the` MakeFork` method including it. Stack ready! // prepare for __asm nret __asm push offset RestorePointAfterClonnedExited __asm push EBP for(int i = (size >> 2) - 1; i >= 0; i--) { int val = ((int *)beg)[i]; __asm push val; }; Further, since we also need to restore the registers, we restore them too.
// restore registers, push 1 for Fork() and jmp _asm { push copy.EAX push copy.EBX push copy.ECX push copy.EDX push copy.ESI push copy.EDI pop EDI pop ESI pop EDX pop ECX pop EBX pop EAX But now is the time to remember that strange code with the laying
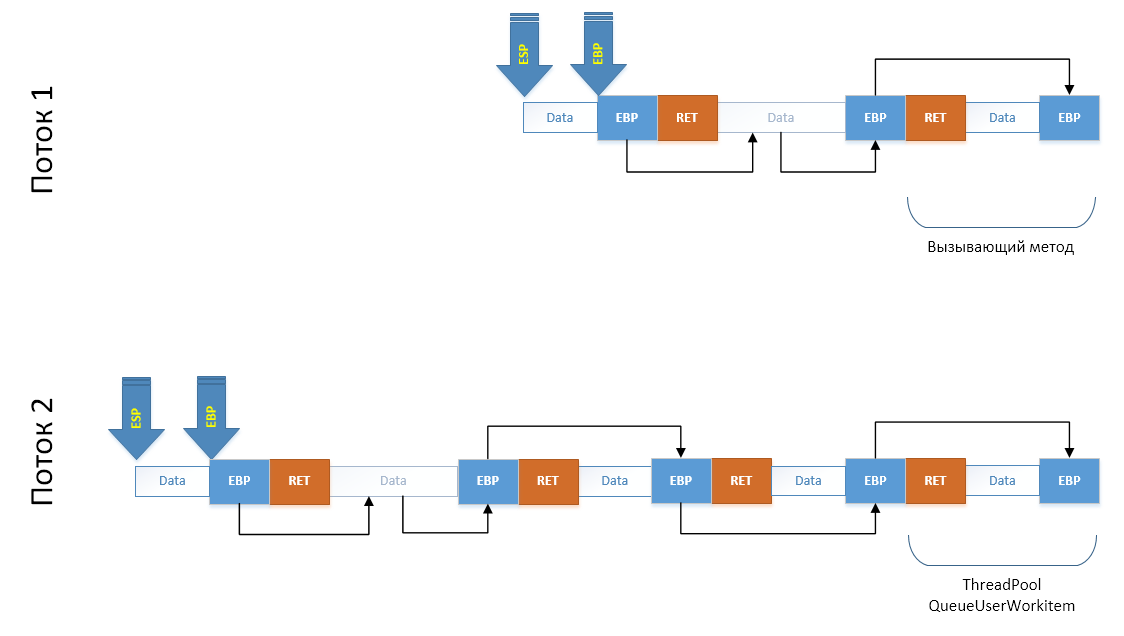
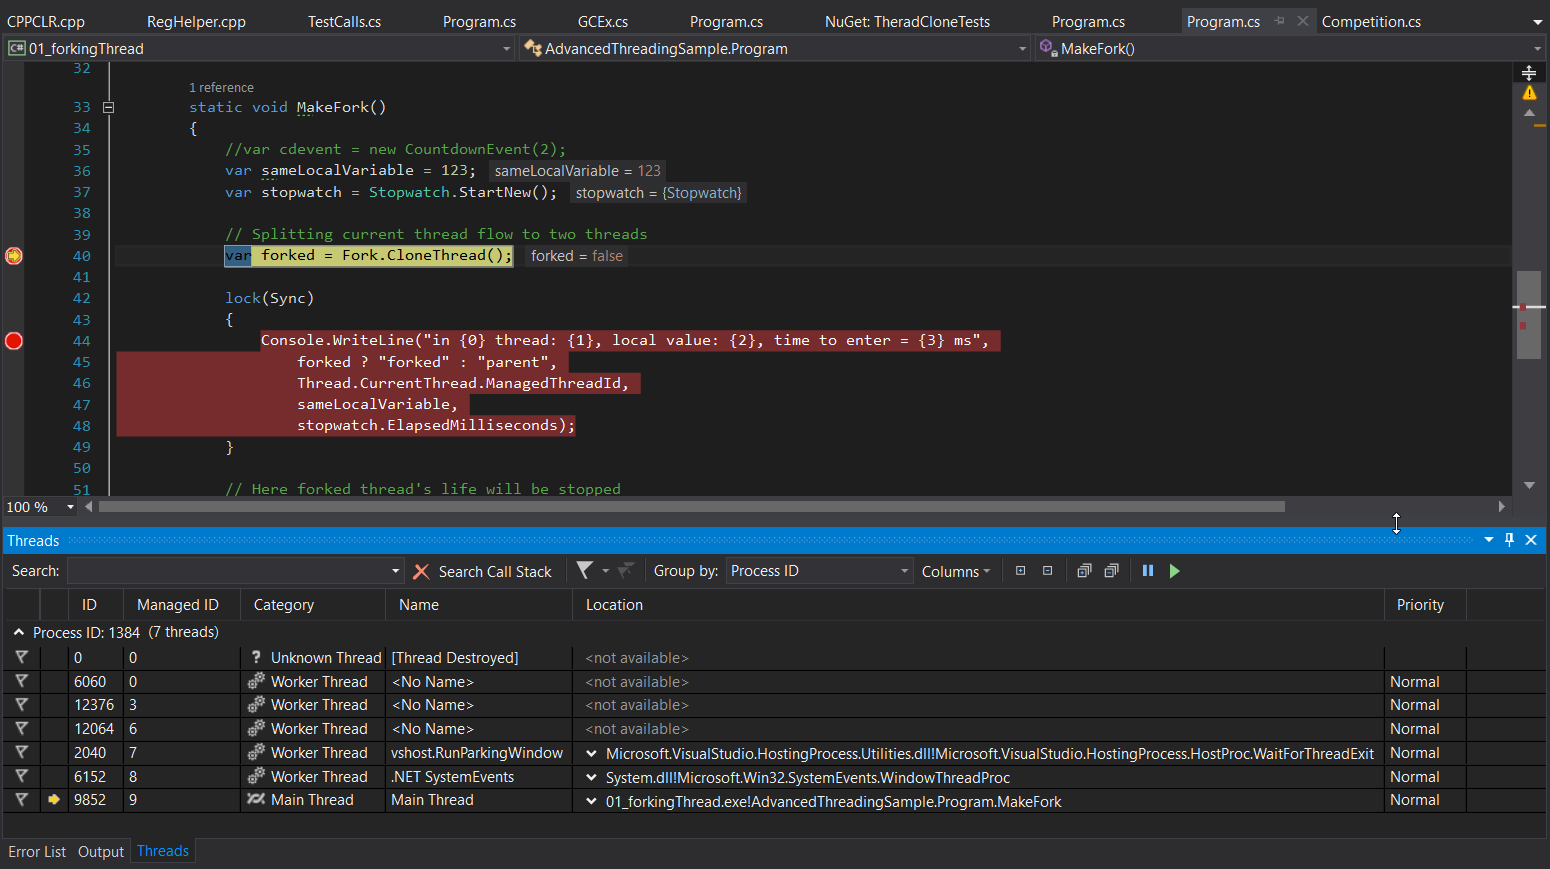
0on the stack and checking for 0. In this thread, we lay 1and make the far jmp in the method code ForkImpl. After all, the stack we are there, but really still here. When we get there, it ForkImplrecognizes the flow change and makes an exit to the method MakeForkthat completes the work, it will hit the spot RestorePointAfterClonnedExited, because a little earlier, we simulated a call to `MakeFork` from this point. By restoring registers to the state "just called from TheadPool", we complete the work, passing the stream to the thread pool. push 1 jmp fword ptr CS_EIP } RestorePointAfterClonnedExited: // Restore original registers __asm popad return; } Check?This is the screenshot before calling the stream cloning:
And after:
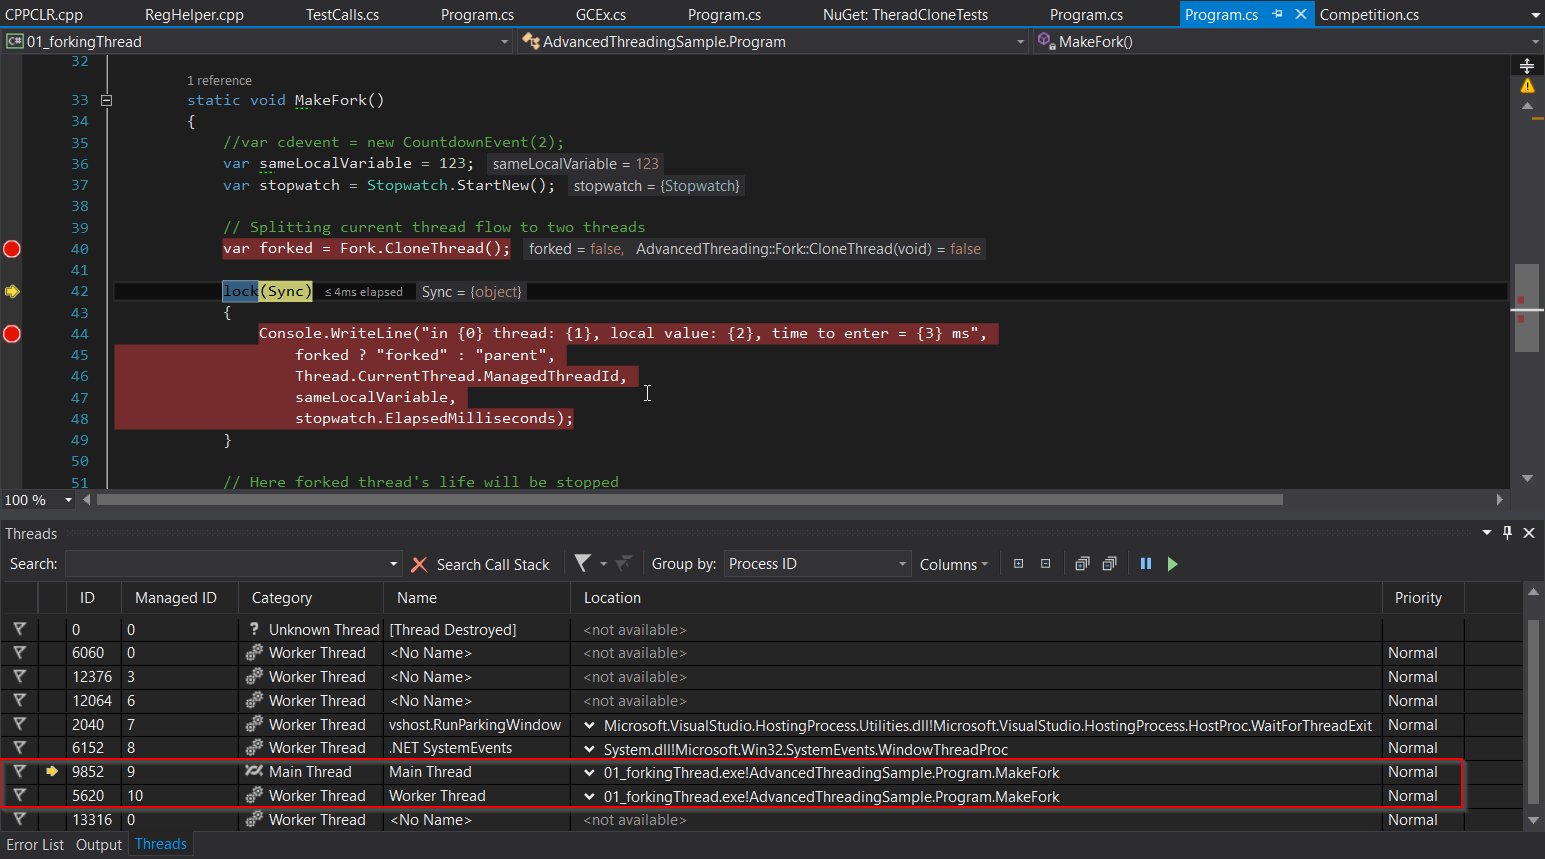
As we see, now instead of one stream inside MakeFork, we see two. And both came out of this method.
A couple of words about the level below
If we take a look at an even lower level out of the corner of our eye, we will find out or recall that memory is actually virtual and that it is divided into 4 KB pages. Each such page may or may not physically exist. And if it exists, it can be mapped to a file or real RAM. It is this virtualization mechanism that allows applications to have separate memory and provides security levels between the application and the operating system. What is the flow stack here? Like any other application memory, the thread stack is part of it and also consists of 4 KB pages. Along the edges of the allocated space for the stack are two pages, access to which leads to a system exception,notifying the operating system that the application is trying to access unallocated memory. Within this region, only the pages that the application has addressed are actually highlighted; if the application reserves for the flow of 2MB of memory, this does not mean that they will be allocated immediately. Not at all, they will be allocated on demand: if the stack of the stream grows to 1 MB, this will mean that the application received exactly 1 MB of RAM under the stack.This will mean that the application received exactly 1 MB of RAM under the stack.This will mean that the application received exactly 1 MB of RAM under the stack.
When an application reserves memory for local variables, two things happen: the value of the ESP register is increased and the memory for the variables themselves is zeroed out. Therefore, when you write a recursive method that goes into infinite recursion, you get a StackOverflowException: by taking up all the allocated stack memory (the entire available region), you will run into a special page, the Guard Page, which will be accessed by the operating system that initiates StackOverflow An OS level that goes to .NET will intercept and throw a StackOverflowException exception for a .NET application.
Conclusions to the section
Of course, in general, we do not need to edit the stack in the product code: only if you want to take your free time with an interesting task. However, an understanding of its structure gives us the appearance of the simplicity of the task of obtaining data from it and editing it. Those.if you develop an API to extend the functionality of your application and if this API does not provide access to any data, this does not mean that this data cannot be obtained. Because always check your application for resistance to hacking.
Link to the whole book
Source: https://habr.com/ru/post/347280/
All Articles