Identify anomalies using user behavior analysis

Over the past 10 years, Security Information Center (SOC) and analysts have operated with such concepts as Indicators of Compromise (IoC), signatures, threshold (based) signs of penetration or penetration attempts in an attempt to keep up with the pace of ever-changing threats. It was a losing confrontation.
At the same time, attackers have become increasingly effective in hiding their activities. Disguise techniques have made traditional signature and threshold detective measures virtually useless.
In response, the information security industry saw a new demand for behavioral analysis (User Behavior Analytics, UBA) , which looks for activity patterns and mathematically significant deviations in user behavior (using suspicious applications, file search operations) based on historical source data.
')
You can often hear the question of what distinguishes UBA from traditional approaches based on SIEM.
Build on previous behavior.
In our opinion, the answer is history. There is an old saying that says: "If you do not remember the past, you will be doomed to repeat it." The same can be said about the traditional SIEM approach, which consists in real-time monitoring of many unrelated events: deleting or copying files, unsuccessful login attempts, malware signatures, or an excessive number of connection requests from a specific IP address.
Of course, you need to keep track of “raw” events from various systems, but statistics and SIEM snapshots without context are unreliable signals of what is actually happening. We call this a false positive when the SIEM system notifies of an incident where it is not there. At some point you end up pursuing the same false positives and, even worse, start to ignore them all together.
How many events indicate an incident when a user deletes or copies data? How many failed login attempts for this user are an anomaly? When should I pay attention to user activity in a rarely used folder?
The key decision to be taken for any event notification is the correct threshold for separating the normal from the abnormal.
Often there are dozens, if not hundreds or thousands of applications, and user activity in an enterprise. Each event associated with them has a unique purpose, a set of thresholds, signatures, and alerts for tuning and monitoring. An approach with brute force leads to the creation of rules that are not based on accumulated data, but on unique, seemingly correct settings for this particular case. Such rules generate endless reports and flashing dashboards, which in turn require a team of people to sift out “fake news”.
This dilemma on how to set a threshold led information security researchers to a statistical approach, where thresholds are based on analyzing user behavior in the real world or infrastructure.
The key difference between UBA and monitoring methods based on static thresholds is that the first trigger decision is controlled by mathematical models and statistical analysis, which is better able to recognize true anomalies, ultimately reducing false alarms. Some examples of behavioral incident notifications are:
- notification when the user worked with information that was rarely used at an unusual time of day - 4AM and day - Sunday, and then sent an email to a mailbox belonging to a foreign provider;
- Notification when a user generates unsuccessful login events at a time when it usually does not work;
- notification when a user copies files from another user's home directory, and then transfers these files to a USB drive.
UBA rule example
The reason why UBA is so effective is that it does not depend only on signature or static threshold analytics.
Let's look at this with an example.
In the company, the security department was asked to monitor the email activity of all of its 1,000 employees. Impossible? - Maybe.
We can understand the essence of the problem, focusing only on 5 users (0.5% of all users). First, we apply traditional analytics and review their email activity (below) for a week.
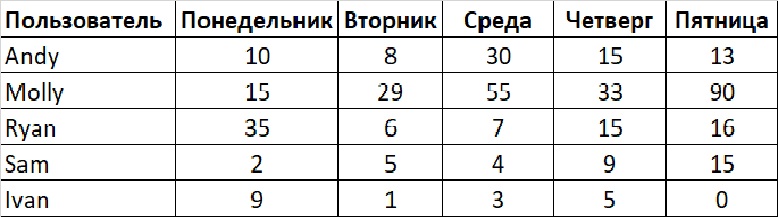
By reviewing this report, you can decide to investigate the activity of users who sent more emails, right?
You will quickly find out that Molly, who sent 90 emails on Friday, is associated with the marketing team, and her job is related to sending materials to customers by email in a day.
False direction!
Then you decide to take as a threshold the average number of emails sent by all users for each day. For the data above, the average email sent by the user on any given day is 17.
If you created a rule that notifies when a user sends more than 17 emails per day, you would receive 6 warnings during this time period. Four of these warnings will take you back to Molly.
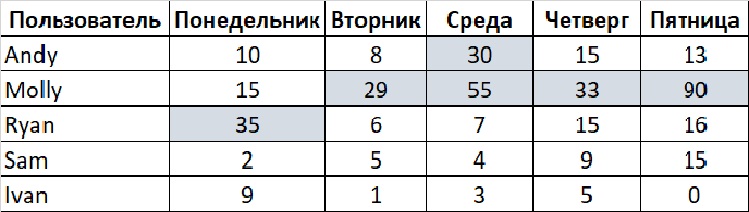
This threshold is clearly too sensitive. You need a different strategy than the average for all users on a particular day - a vertical column.
The UBA anomaly detection algorithm looks at each user every day and records information about its activities. This historical information is accompanied by a number of attributes: in the afternoon, time, number of events, type of events, and others, and is stored in the system, so basic statistics can be created.
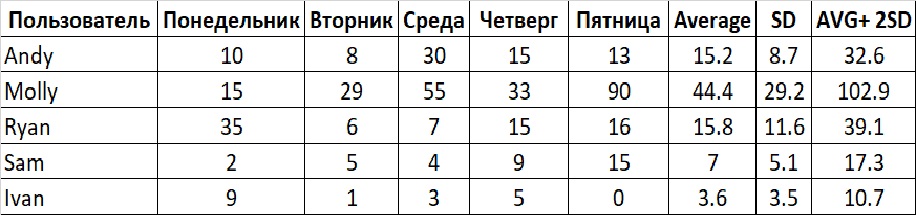
UBA is a tool that runs reports, calculates the average values of the parameters and the standard deviations from them for each user while comparing it with similar ones and pointing out users who really stand out from the rest. It should also be noted that UBA calculates average values of parameters, standard deviations and other statistics dynamically over time, so that they reflect possible shifts in historical trends.
Consider an example of a possible behavioral rule: A warning when a user deviates significantly from his usual activity when sending emails.
This could be more accurately translated as “notification when a user deviates by two or more standard deviations from the mean” (column AVG + 2SD).
Obviously, this is not exactly what is being done in practice - there are better statistical tests and more comprehensive analysis that can be performed.
More importantly, by analyzing the behavior of a user or users within, say, the same Active Directory (or OU) groups, UBA can more accurately find true anomalies.
Source: https://habr.com/ru/post/347232/
All Articles