Feature Engineering, as silent online courses

Sherlock by ThatsWhatSheSayd
To become a great detective, Sherlock Holmes had enough to notice what others did not see, in things that everyone had in plain sight. It seems to me that every machine learning specialist should have this quality. But the topic of Feature Engineering is often studied in courses on machine learning and data analysis in passing. In this article, I want to share my experience in the processing of signs with beginners datasaentists. I hope this helps them to achieve success in solving the first tasks faster. I’ll make a reservation at once that within this part the conceptual processing methods will be considered. The practical part of this material will soon be published by my colleague Osina_Anya .
One of the popular data sources for machine learning is logs. Practically in every line of the log there is time, and if this is a web service, then there will be IP and UserAgent. Consider what signs can be extracted from this data.
Time
UnixTimestamp
UnixTimestamp is the number of seconds elapsed from 1970-01-01 00: 00: 00.000, the popular representation of time, a natural number. You can add time to the model in this format, but this approach often works in regression problems. It rarely works in classification tasks, since only information about the sequence of events is stored in the UnixTimestamp format, and the model will not know anything about days of the week, months, hours, etc.
Year, month, day, hour, minute, second, day of the week
Often, time is added to the model as a set of natural numbers: a separate year, a separate month number, and so on, until the required detail. For example, 2017-09-08 12: 07: 12.997 can be converted to five signs: 2017, 09, 08, 12, 07. You can also add a binary sign: a day off or not, time of year, working time or not - and so on. etc., etc. A successful set of such signs most often allows solving a problem of high quality. Sometimes the method Create OneHotEncoding features for months / years works, but this is more exotic than practice.
Circle mapping
Representations of time as a set of individual components are often sufficient, but it has one weakness and may require the addition of additional features.
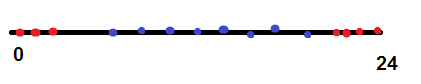
Suppose we have a task: for the current time, determine why a person picked up a mobile phone - turn off the sound or set the alarm. At the same time, we see from historical data that a person sets the alarm from 23.00 to 01.00, and turns off the sound from 07.00 to 21.00. If we begin to solve the problem of logistic regression, then it will need to build a dividing plane for the following image:
Obviously, she will not be able to do this: this presentation of time loses the information that 23.00 and 01.00 are very close events. In this case, you can add quadratic signs, but I have a better way! To solve such problems, the following trick comes in handy: we take a sign about which we know that it varies in cycle. For example, “hour” - it changes from 0 to 23. And we turn it into two signs: cos (“hour” 2 pi / 24), sin (“hour” 2 pi / 24), i.e. we evenly distribute everything cycle elements along a unit circle with a center at 0 and a diameter of 1.
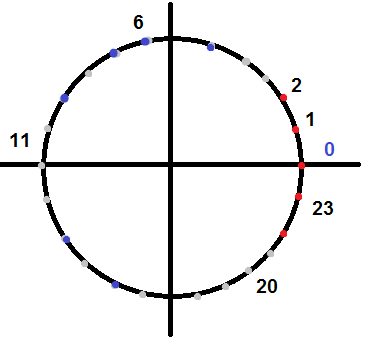
For such a multitude of points, the logistic regression will easily find the dividing plane and help the person set the alarm. Similarly, you can deal with days of the week, month, piston cycles, etc. Theoretically, this method can be interpolated to more complex periodic functions using Fourier series decomposition, but I have not encountered such cases.
IP address
Few words about IP
At first glance, an IP address is an important sign, but what to do with it is completely incomprehensible. The most common variant now is IPV4, i.e. a sequence of 4 bytes, traditionally written in the form of “255.0.0.1”. It is absolutely incorrect to work with these numbers or with all IP as with numerical signs. If you have two IP addresses, 123.123.123.123 and 124.123.123.123, then the proximity of these numbers means absolutely nothing (the first is China Unicom Beijing province network, the second is Beam Telecom Pvt Ltd). It would be correct to treat IP as categorical with subnetting, but large services have a lot of such categories. For example, if we consider categories by third-level subnets, they are 2 ^ 24 - ~ 10 ^ 16. To train a model with more than 16 million attributes, you really need a lot of data, and most likely they will create unnecessary noise.
Geolocation
In fact, much more information is gained from IP than just splitting it up into networks. So, the country, region, and sometimes even the city where the service user was located is extracted from the IP address with good accuracy. To do this, you can use:
- Open GeoIP-bases, which are now in abundance, many of them provide a free API. The main thing is not to burden them too much (no more than 100–1000 requests per minute). If you need large amounts of data, you can buy regularly updated databases from companies such as MindMax.
- The WhoIs service, which publishes public information about the owners of many IP addresses (in the case of ordinary users, about their providers). To obtain this data, you can use one of the WhoIs-services, for example https://www.nic.ru/whois/ , or a Python-package . For example, now my mobile phone has an IP address of 176.59.41.95. The WhoIs service shows that IP belongs to Russian Tele2 . You can do the same operation with any IP and find out his country, but the amount of information provided about the owner of the IP address differs from case to case. In addition, do not forget that there are special IP-addresses, you can read about them here .
Carefully deal with the data obtained on IP from similar services. The data sometimes becomes outdated, sometimes erroneous, and the IP addresses of mobile telecom operators are generally a big problem, since you can often get out of Moscow and Vladivostok through one operator with the same IP. Therefore, I recommend creating these additional fields to the log at the time of its receipt, and not later, at the time of collecting the signs, since you may not already have a version of the database at the time of the event described in the log. Plus approach: you can track the fact that some IP, met in Russia, moved to Europe, or vice versa. But even with these reservations, this function is very useful for data analysis and can significantly improve the quality of the model.
Postscript for this item
If your service is large enough, you can build GeoIP databases yourself. If the user gives your site / application access to their geolocation, then you will automatically receive information about the location of specific IP addresses. Only you will have to figure out how to deal with incorrect geolocations and IP addresses that have a wide geography. In addition, using this technique, we can assume where the user came from: from home, from work, while on the road.
Clean IPs
To analyze the data, it is sometimes worth filtering the actions of real users from the actions of bots, search robots and similar “evil”. In the original formulation, this problem is very complex, used in many areas, for example, anti-spam and anti-fraud. But for the task of filtering data, there are sometimes enough simpler methods - filtering by IP. For example, on the Internet, you can find open lists of IP addresses, from which fraud and DDoS attacks are often conducted, IP addresses tor-exitnode (bots often use them to bypass IP blocking for frequent requests to the service) and IP addresses of open proxies servers (sometimes used for the same purpose). So, you can add the flag “presence of an IP address in these databases” to the feature vector. In addition, according to historical data, you can consider the probability of encountering the same provider as the IP address in this log line. This probability can also be a sign, only it has a hyperparameter: how far to look at the history in order to calculate the probability. This is important because the distribution of users and, as a result, the distribution of user providers on the service changes.
Returning to the question of filtering "bad" users, I will note: the standard practice is to filter logs from IP addresses that appear on trusted blacklists. At the same time, the users who initiated them do not belong to the list of users who have recently performed trusted actions. Both of these conditions are equally important, since even good users sometimes access Tor and proxy servers, but a good user account can be hacked. Therefore, the action that characterizes him as a real person should happen recently.
UserAgent
A little bit about UserAgent
If we are talking about the HTTP protocol, the software that sends the request to your server sends the User-Agent field in the request header, which contains information about the software version and operating system. Using this header field often redirects to the mobile version of the site or to the version of the site without using JS. In addition to the browser version and operating system, UserAgent may contain other useful information, but it is sometimes not easy to get. The fact is that there is no single approved format for the User-Agent line, and everyone writes information there the way he wants. There are many different libraries that allow you to extract the browser and operating system from the UserAgent line, and you can choose them to your taste. I personally like https://github.com/ua-parser .
OS, software, what's complicated?
The browser and the operating system can be added as a categorical feature, using OneHotEncoding, even the type of device gets. Only for this you need to carefully look at the browser and the operating system. But in UserAgent you can still identify search bots, Python scripts, programs and custom browser assemblies using WebKit. Only with this variety of possibilities comes a variety of problems. You can write anything into the UserAgent string, and malware developers use it: for your server, everything will look as if you were a regular user with a Chrome and Windows 10 browser on your computer. Therefore, we must be very careful with the data from UserAgent and monitor the anomalies in the statistics of browser versions. In it, you may notice that a very old version of chromium is much more popular than the latest, or to see "flash" of old androids. In addition, frequency analysis will help, as is the case with IP. Most often, robot developers do not know the distribution of browsers to your target audience and take UserAgent from their UserAgent distribution databases among Internet users, and the databases may become outdated, not correspond to the geography, target audience of your service, etc. But all these difficulties are not reason not to use this data. This is a reason to look at them more carefully and to extract even more useful information.
Conclusion
The preparation of features is an important step in data analysis. Often beginning datasativists begin to sort out complex models, build multilayered neural networks, make ensembles of various algorithms in cases where the problem can be solved by carefully adding good signs to the logistic regression. I talked about some of the data that is rarely considered in training courses, but often found in real work. I hope that the information was useful to you.
Thank you for your attention - and good luck!
')
Source: https://habr.com/ru/post/346942/
All Articles