Using Grafana with DeviceHive IoT Platform

Authors: Igor Trambovetsky, Developer; Nikolai Khabarov, Embedded Expert
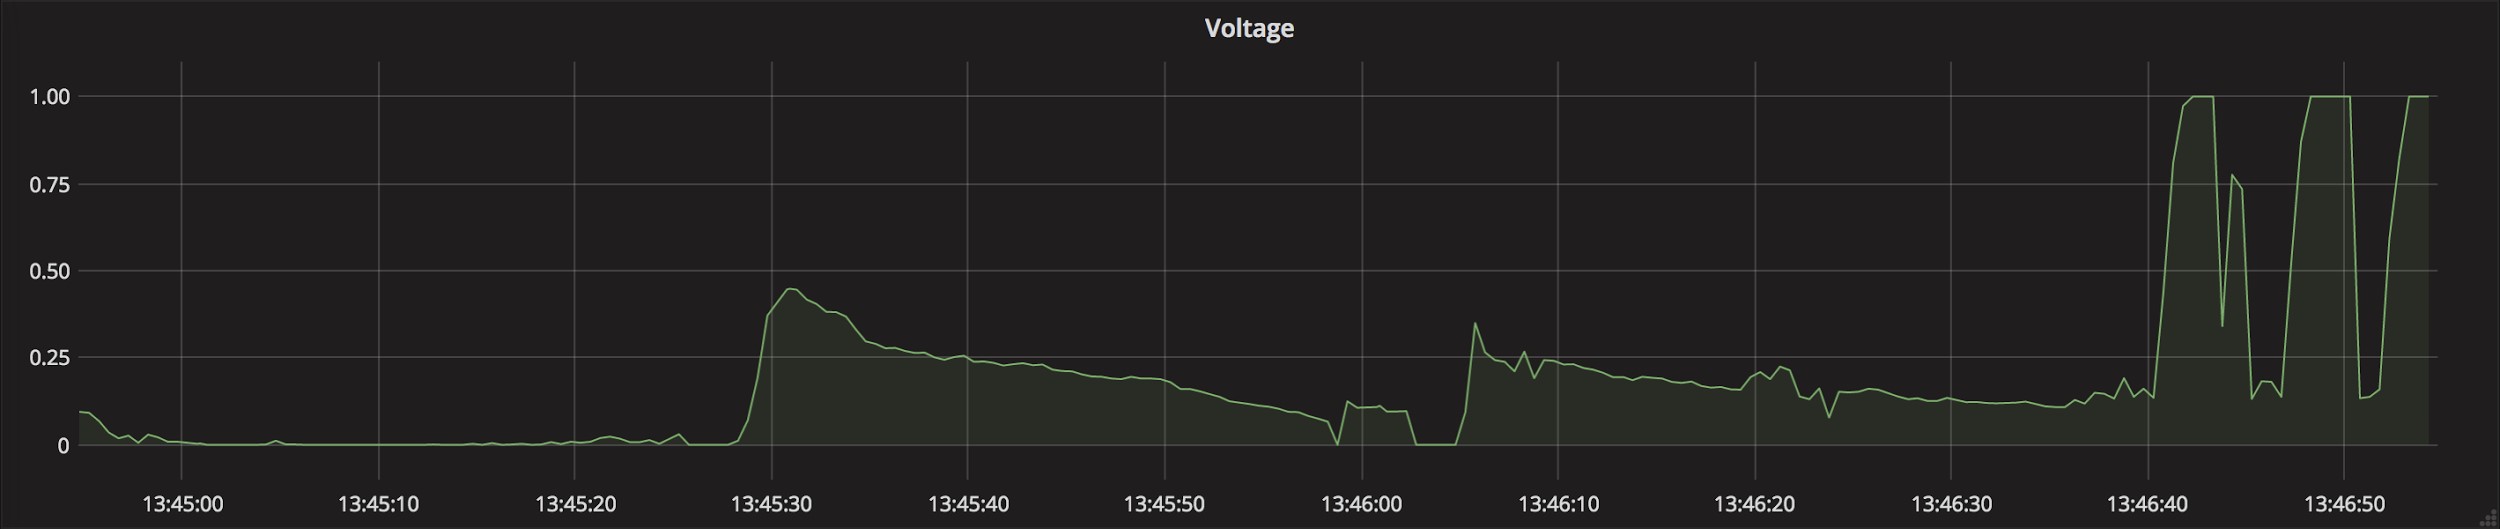
The DeviceHive platform contains many different components, including the Grafana plugin. It can collect data from the DeviceHive server and display it using various information panels using the popular tool Grafana. In this article I will explain how to create a Grafana Dashboard with DeviceHive, and as an example I use the analog input of an ESP8266 chip to visualize the voltage on it.
')
Data
From the point of view of the DeviceHive server, the data that needs to be displayed can be provided through commands and notifications. The former are usually used to transmit any messages to devices that initiate command execution. Notifications are messages by means of which devices inform their subscribers about certain events. Commands and notifications are simple JSON messages. Both can be used to plot graphs, display static text, scale, table, or any other Grafana components. In this article, we will generate notifications using a special DeviceHive firmware for the ESP8266 chip. This firmware allows the chip to directly connect to the DeviceHive server using the appropriate protocol. It also contains many pre-installed commands that can be run on the server side ( https://github.com/devicehive/esp8266-firmware/blob/develop/DeviceHiveESP8266.md ).
Generating Notifications with ESP8266 Firmware
Binary files for DeviceHive firmware are available here . Download the latest version and install the firmware. The distribution contains installation documentation, but if you have a NodeMCU board, you just need to connect it to the computer via a microUSB cable, run the esp-flasher utility from the distribution for your operating system and wait for the firmware installation to complete. Then you need to configure your wireless network, DeviceHive server, and credentials. This can be done in two ways: use the terminal with the esp-terminal utility or via Wi-Fi, as described here .
There is a free sandbox that you can use to try out a DeviceHive server. After connecting the board to your server or sandbox, log in to the administrative panel on the server, find the ESP8266 device in the device list and enter the command 'adc / int' with the parameters '{"0": 500}'.
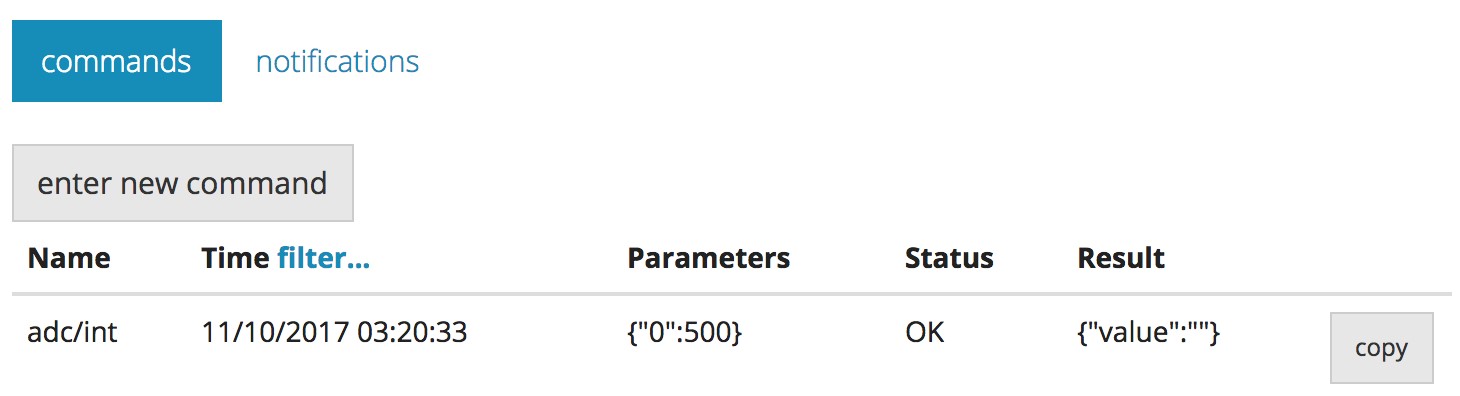
Thanks to this command, the ESP8266 device reports every 500 ms the input voltage # 0 of the ESP8266 ADC (this chip has only one analog input). After switching to the notifications tab, the following data should appear:
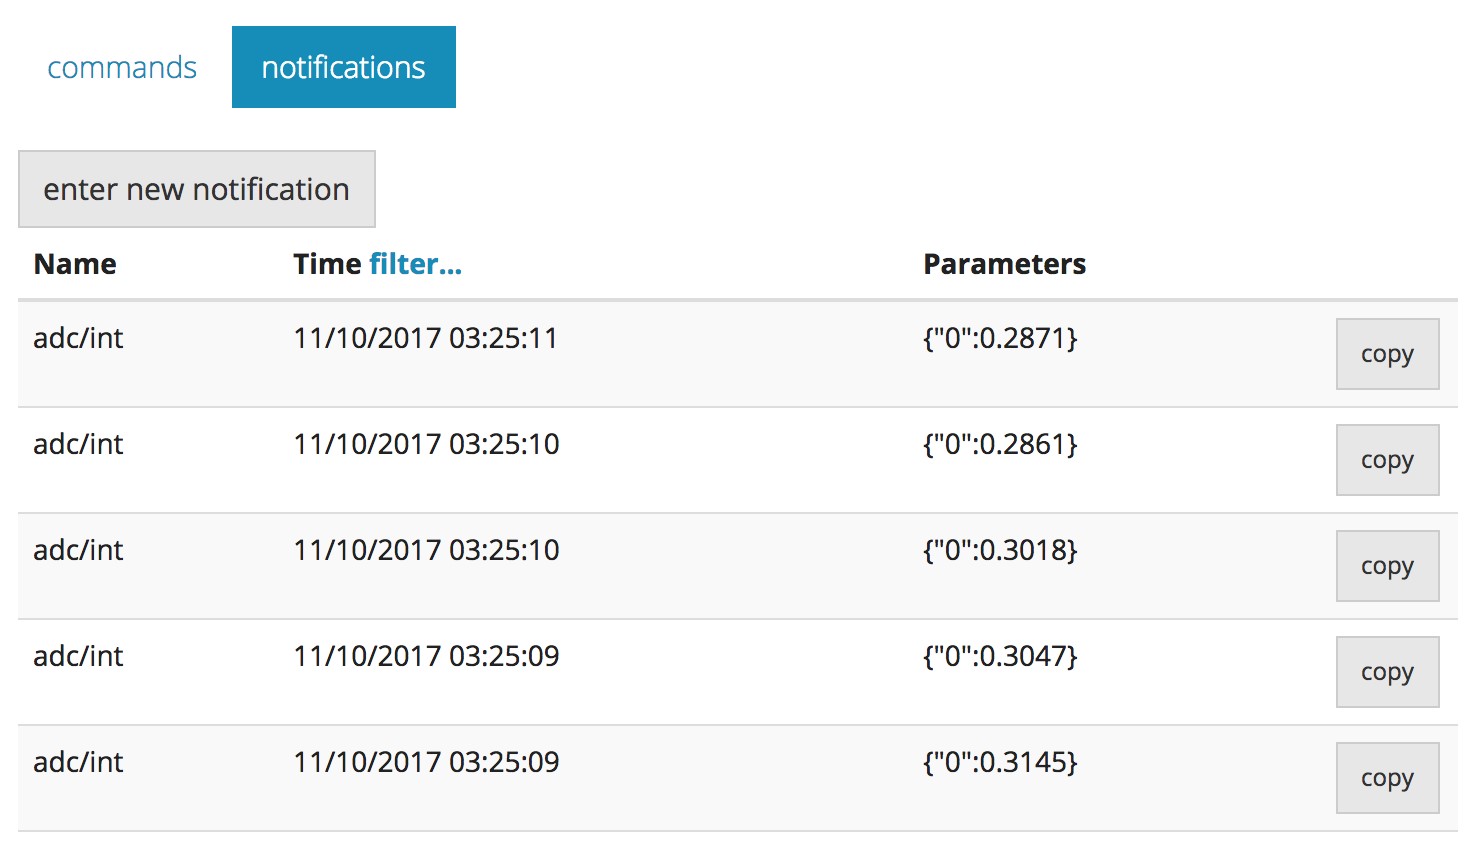
Values in the parameters - the voltage at the output of the chip. Such data is suitable for display using Grafana: 1) notifications contain data (in our case, notification parameters), 2) notifications are received continuously, 3) all DeviceHive notifications always have a time stamp. Having an analog sensor connected to this pin, you can display this data using Grafana.
Installing the DeviceHive Grafana plugin
Grafana can be used as a local service or as a service hosted on a server. Information on the local installation of Grafana can be found in the official documentation . There is also information about installing plugins .
To install the DeviceHive datasource data source via grafana-cli, you can use the following command:
$ grafana-cli plugins install devicehive-devicehive-datasource
If you want to install the plugin manually, you must perform the following steps:
These packages must be preinstalled:
- Grafana> = 4.6
- NodeJs> = 8 (optional)
- NPM> = 5 (optional)
- Grunt (npm install grunt -g) (optional)
Also, you should have rights to copy data to the Plugins folder (you can set them in grafana.ini in Paths -> plugins).
1. Clone this repository into the Plugins folder:
git clone github.com/devicehive/devicehive-grafana-datasource.git
The following steps are optional (in case you want to change the source code):
2.1. Go to the folder: cd devicehive-grafana-datasource;
2.2. Install all packages: npm install;
2.3. Plugin build: npm run build;
3. Restart the Grafana server;
4. Open Grafana in a browser;
5. Open the side menu by selecting the Grafana icon at the top of the window;
6. Select Data Sources in the sidebar;
7. Click + Add data source at the top of the window;
8. Select DeviceHive from the Type drop-down list;
9. Configure the data source.
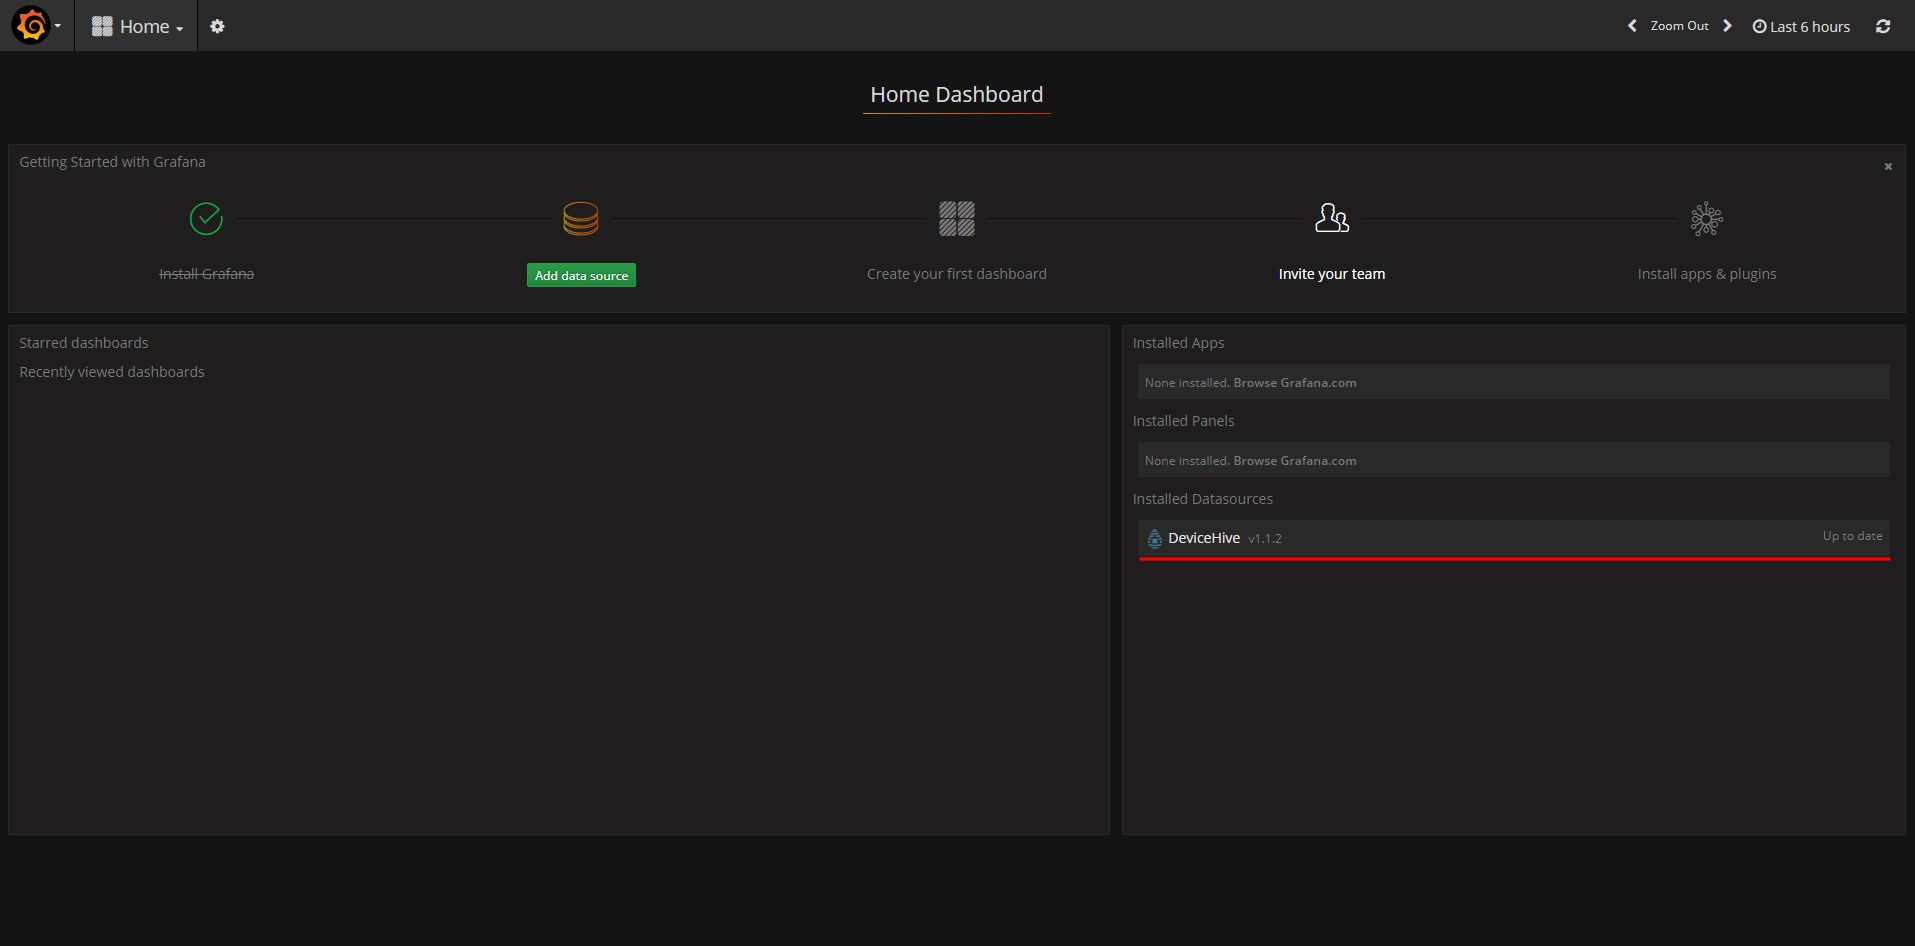
After installation, you can see the DeviceHive data source plugin in the list of installed plugins:
Adding a Grafana Data Source
To add a DeviceHive data source:
- Open the side menu by clicking the Grafana icon at the top of the window;
- Select Data Sources in the sidebar;
- Click + Add data source at the top of the window;
- Select DeviceHive from the Type drop-down list.
Take a look at the image below:
To set up a DeviceHive data source, you need to fill in the following fields:
- Server URL (the path to the DeviceHive WebSocket server. The following line is used for the sandbox: ws: //playground.devicehive.com/api/websocket);
- Device ID (unique device identifier DeviceHive);
- Login / Password or AccessToken - authentication credentials.
In addition, you can specify RefreshToken to automatically update AccessToken.
The image below shows a screenshot of the configuration window:
After adding and configuring a DeviceHive data source, it should appear in the list of data sources, as shown in the screenshot:

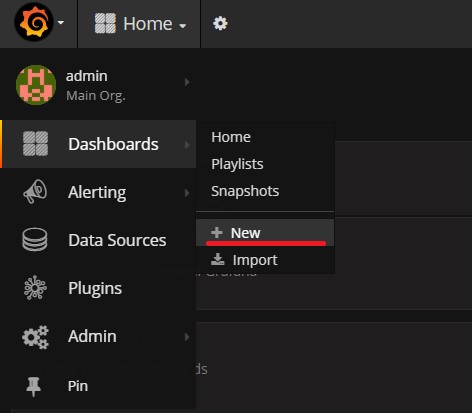
Creating a new panel
To create a new panel, you just need to click the New button on the side panel, as shown below:
In this article, we show examples in the Graph panel, so you need to click the appropriate button:
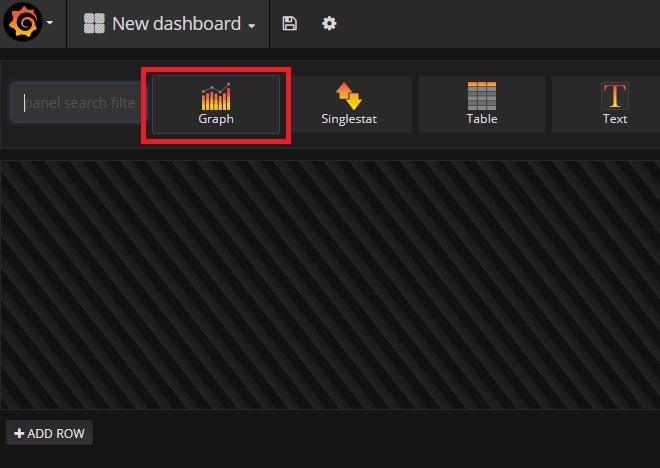
Then you can see the line diagram on your dashboard:

Display notifications / commands using Grafana graphics
Notifications and commands are DeviceHive objects:
- A command is a message sent by clients for devices;
- A notification is a message sent by devices to clients.
Both notifications and notifications include the parameters field in which the user can transmit his data.
At the beginning of this article, we configured the ESP8266 device to send notifications with data on the status of the analog output of the # 0 chip. In the image below, you can see how to configure the graphical panel of Grafana to display data on a line chart:
Display annotations on grafana graphics
Annotations allow you to mark points on a graph with many events. By hovering over the annotation, you can get a description of the event (event description) and event tags (event tags). The text box may contain links to other systems with more detailed information.
More information about annotations can be found here .
The figure below shows how to configure annotations based on a DeviceHive data source.
Advanced Graph Setup
After clicking the Add converter button (
 ) you can choose a converter.
The converter is a simple function that converts the value.
Currently, DeviceHive data sources support the following types of converters:
- Scale - multiplies by the given value
- Offset - adds the specified value
- Unit Converter - converts a value into various units of the following measurement types:
Temperature - Temperature (c - Celsius, f - Fahrenheit, k - Kelvin);
Length - Length (m - Meter, mi - Mile, yd - Yard, ft - Foot, in - Inch);
Weight - Weight (kg - Kilogram, lb - Pound, oz - Ounce);
Volume - Volume (l - Liter, gal - Gallon, pt - Pinta).
 minimizes the choice of the converter.
Clicking on the icon with the converter arrow will call up the editing panel.
Click
 to re-select converter? or
  to remove the converter.
An example of this function is shown below.
Conclusion
Grafana is the perfect tool for data visualization. It is very flexible and provides many different functions for visualization in the form that suits you. Grafana can use multiple data sources from a wide range of software solutions, DeviceHive is one of them. The example we gave in this article is very simple. Using the same principles, you can create more complex graphics. With Grafana and DeviceHive, you can create your own IoT visualization solutions, and, in addition, you can modify both projects as you like, since Grafana and DeviceHive are open source software products.
Source: https://habr.com/ru/post/346742/
All Articles