What can we learn from the four-color theorem in software development
The four color theorem is a mathematical formulation related to maps. All the examples of maps that I found on the Internet were too complicated for the introduction, so I sketched my own unsightly picture:
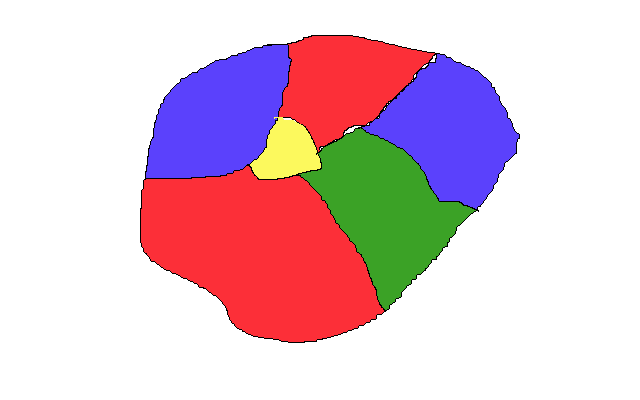
If you look at a different angle, you can perceive it as a graph - just squeeze all areas to circles and connect the circles corresponding to the adjacent areas of the map:
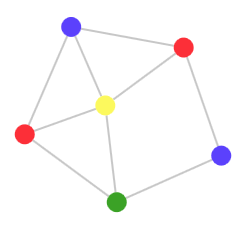
The four color theorem states that for marking any pattern that is similar to mine (or the corresponding graph) four colors are enough so that no adjacent areas have the same coloring. This means that if we take a map of the United States or Europe, even with all these fancy borders, and assign a different color to each state or country, then four colors will be enough to mark the entire map.
')
Some cards do not need all four colors, they need only two or three. A map that can be colored in one color will not be very interesting, so we’ll skip it.
The first thing that struck me as a software developer: four colors are very few . It seems amazing that any graph can be colored in just four colors; It seems to me that if I draw graphs of some of the code bases with which I worked, where the edges of the communicating objects will be connected with edges, then they may easily need a dozen colors.
So, you guessed it, there is one condition in the four color theorem. The count must be planar (flat) . This means that no edges can intersect. It must necessarily be able to overlap on a two-dimensional plane without intersections. That is, if we have an intersected graph that cannot be imposed on a plane, then the four-color theorem does not apply to it. It will require more than four colors, but at least three dimensions will be required to draw it without intersections.
Therefore, you can do this:
but not like this:
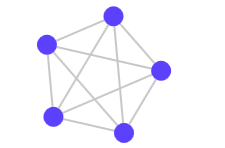
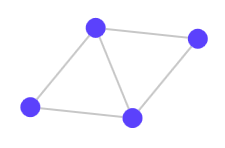
So what's interesting in these colors? Why should they bother someone? Why do I write this post? Briefly, this can be expressed in one word - complexity . The number of colors required for coloring a graph indicates its complexity - for more complex graphs, more colors will be needed. To understand how it will look in practice, let's try to paint the graphs. The graphs below have the same number of nodes, but their coloring requires a different number of colors (in the original article, the graphs are interactive and can be colored by clicking on the nodes):
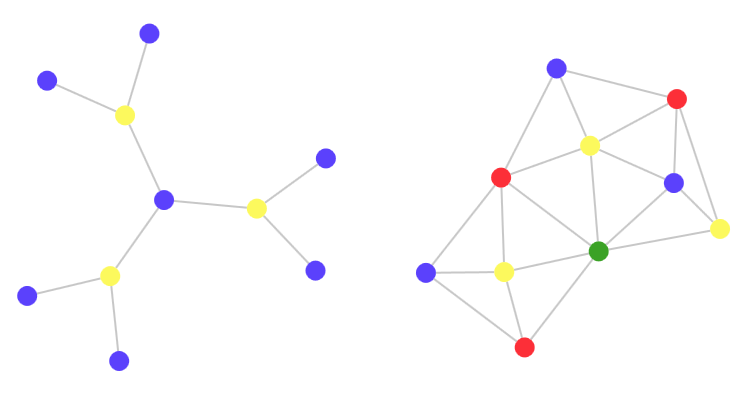
The second graph intuitively seems more complicated, or at least less orderly. There is a specific measurable way to assess its complexity: it needs more colors to paint. Four colors are required for the second graph, only two for the first one. Why?
The difficulty arises from the very nature of the compounds of the graph. Some components of the second graph are strongly interrelated, unlike the nodes of the first. In fact, the first graph is based on a set of rules: this is a tree . The second graph was created by me: I randomly clicked the mouse, creating a multitude of interconnections.
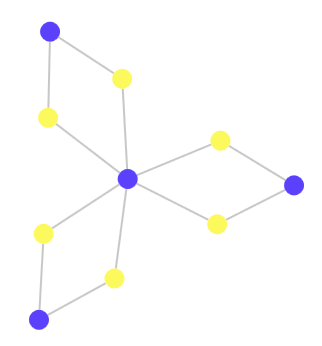
A graph can contain any number of links without increasing the number of colors, as long as it is ordered according to certain logical rules. The number of nodes connected to each node is not important:

as the number of elements in the graph:
In fact, the number of colors in the graph components with a large number of links. In the triangle we get three colors, but the triangle is in fact very interconnected for the number of nodes that it has: it is a complete graph . An interesting challenge is the transition from three to four colors. In this case, you need to add connections between components that are already connected. Suppose we want to combine the following two graphs:
There are ways to do this without increasing the total complexity and with the increase. It all depends on how new edges are added:
(The second graph is drawn with a crossed edge, but in fact it is planar. If you pull the lower nodes upwards in the original article, it will be corrected.)
In the first graph, I used node 3 to connect with the second graph; node 3 is a diamond-like interface, restricting access to it. By following this pattern, the complexity of the graph does not increase.
In the second column, nodes 1 , 2, and 4 have connections with a larger subgraph. In this case, there is no one node that restricts access to the diamond; a larger graph has the ability to connect with several nodes in a rhombus. This led to an increase in the complexity of the entire system. In addition, the complexity has cascaded into most of the system — I cannot change only one of the colors of the node, but must extend the changes to a larger subgraph.
These columns are similar to the dependency graph in the code base. If we add a node for each class and draw the edges between the classes that exchange data, then we end up with a graph similar to one of the above. The mention of the terms “components” and “modules” by me was influenced by the fact that I perceived these graphs from the point of view of software. In the last example, we touch on an important topic - you can manage the growing code base without increasing its complexity, if you control how the modules are connected to each other. A code base consisting of small interconnected modules that exchange data in a well-defined way will have less complexity compared to a base in which the modules exchange data randomly.
This is an example of how to manage interactions along a point rather than along an edge. I mean that modules with one interaction point will be able to maintain their own dynamics, without polluting the complexity of the code base. If programmers do not think about how they connect the modules in the code base, and the resulting modules have many interaction points, then the complexity of the code base will increase.
Trees are very simple in terms of color measurement. For their coloring requires only two colors. The tree structure protects against creating interconnected clusters, leading to jumps in complexity, because the parent nodes restrict access to the child nodes. In the dependency scheme, the parent nodes are similar to the abstraction on top of the functionality provided by the child nodes. If other nodes were connected to the child nodes directly, then the abstraction would be destroyed.
However, most dependency schemes are not trees due to code reuse. The programmer needs one object to be used by many other objects. But only up to a certain point - we do not need the web-presentation to communicate directly with the data storage level: first, the web-layer is at a separate level of abstraction, secondly, the web-layer is likely to have other responsibilities, therefore communicating directly with the level of data storage in one place will be too much.
The main conclusion from these reflections for me was that a good way to manage the complexity of the code base is to use objects that create APIs on top of a group of others. The complexity of a graph never increases if we create connections by connecting to a point bounding the internal graph. But if you open the "insides" outside, you can quickly come to very difficult graphs.
If you look at a different angle, you can perceive it as a graph - just squeeze all areas to circles and connect the circles corresponding to the adjacent areas of the map:
The four color theorem states that for marking any pattern that is similar to mine (or the corresponding graph) four colors are enough so that no adjacent areas have the same coloring. This means that if we take a map of the United States or Europe, even with all these fancy borders, and assign a different color to each state or country, then four colors will be enough to mark the entire map.
')
Some cards do not need all four colors, they need only two or three. A map that can be colored in one color will not be very interesting, so we’ll skip it.
The first thing that struck me as a software developer: four colors are very few . It seems amazing that any graph can be colored in just four colors; It seems to me that if I draw graphs of some of the code bases with which I worked, where the edges of the communicating objects will be connected with edges, then they may easily need a dozen colors.
So, you guessed it, there is one condition in the four color theorem. The count must be planar (flat) . This means that no edges can intersect. It must necessarily be able to overlap on a two-dimensional plane without intersections. That is, if we have an intersected graph that cannot be imposed on a plane, then the four-color theorem does not apply to it. It will require more than four colors, but at least three dimensions will be required to draw it without intersections.
Therefore, you can do this:
but not like this:
Complexity
So what's interesting in these colors? Why should they bother someone? Why do I write this post? Briefly, this can be expressed in one word - complexity . The number of colors required for coloring a graph indicates its complexity - for more complex graphs, more colors will be needed. To understand how it will look in practice, let's try to paint the graphs. The graphs below have the same number of nodes, but their coloring requires a different number of colors (in the original article, the graphs are interactive and can be colored by clicking on the nodes):
The second graph intuitively seems more complicated, or at least less orderly. There is a specific measurable way to assess its complexity: it needs more colors to paint. Four colors are required for the second graph, only two for the first one. Why?
The difficulty arises from the very nature of the compounds of the graph. Some components of the second graph are strongly interrelated, unlike the nodes of the first. In fact, the first graph is based on a set of rules: this is a tree . The second graph was created by me: I randomly clicked the mouse, creating a multitude of interconnections.
A graph can contain any number of links without increasing the number of colors, as long as it is ordered according to certain logical rules. The number of nodes connected to each node is not important:
as the number of elements in the graph:
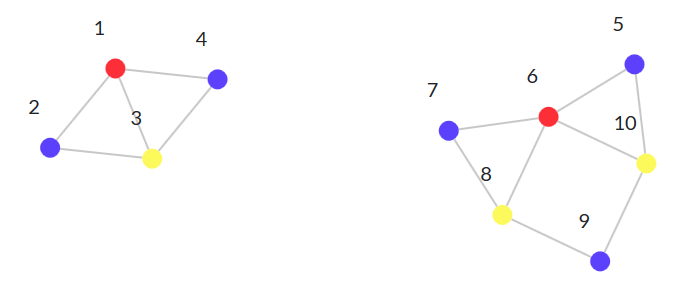
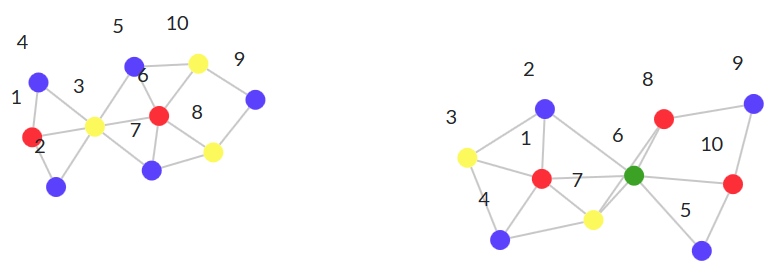
In fact, the number of colors in the graph components with a large number of links. In the triangle we get three colors, but the triangle is in fact very interconnected for the number of nodes that it has: it is a complete graph . An interesting challenge is the transition from three to four colors. In this case, you need to add connections between components that are already connected. Suppose we want to combine the following two graphs:
There are ways to do this without increasing the total complexity and with the increase. It all depends on how new edges are added:
(The second graph is drawn with a crossed edge, but in fact it is planar. If you pull the lower nodes upwards in the original article, it will be corrected.)
In the first graph, I used node 3 to connect with the second graph; node 3 is a diamond-like interface, restricting access to it. By following this pattern, the complexity of the graph does not increase.
In the second column, nodes 1 , 2, and 4 have connections with a larger subgraph. In this case, there is no one node that restricts access to the diamond; a larger graph has the ability to connect with several nodes in a rhombus. This led to an increase in the complexity of the entire system. In addition, the complexity has cascaded into most of the system — I cannot change only one of the colors of the node, but must extend the changes to a larger subgraph.
Software development
These columns are similar to the dependency graph in the code base. If we add a node for each class and draw the edges between the classes that exchange data, then we end up with a graph similar to one of the above. The mention of the terms “components” and “modules” by me was influenced by the fact that I perceived these graphs from the point of view of software. In the last example, we touch on an important topic - you can manage the growing code base without increasing its complexity, if you control how the modules are connected to each other. A code base consisting of small interconnected modules that exchange data in a well-defined way will have less complexity compared to a base in which the modules exchange data randomly.
This is an example of how to manage interactions along a point rather than along an edge. I mean that modules with one interaction point will be able to maintain their own dynamics, without polluting the complexity of the code base. If programmers do not think about how they connect the modules in the code base, and the resulting modules have many interaction points, then the complexity of the code base will increase.
Trees are very simple in terms of color measurement. For their coloring requires only two colors. The tree structure protects against creating interconnected clusters, leading to jumps in complexity, because the parent nodes restrict access to the child nodes. In the dependency scheme, the parent nodes are similar to the abstraction on top of the functionality provided by the child nodes. If other nodes were connected to the child nodes directly, then the abstraction would be destroyed.
However, most dependency schemes are not trees due to code reuse. The programmer needs one object to be used by many other objects. But only up to a certain point - we do not need the web-presentation to communicate directly with the data storage level: first, the web-layer is at a separate level of abstraction, secondly, the web-layer is likely to have other responsibilities, therefore communicating directly with the level of data storage in one place will be too much.
The main conclusion from these reflections for me was that a good way to manage the complexity of the code base is to use objects that create APIs on top of a group of others. The complexity of a graph never increases if we create connections by connecting to a point bounding the internal graph. But if you open the "insides" outside, you can quickly come to very difficult graphs.
Source: https://habr.com/ru/post/346710/
All Articles